Express Performance Monitoring
Get end-to-end visibility into your Express performance with application monitoring tools. Gain insightful metrics on performance bottlenecks with Node.js monitoring to optimize your application.
Where Does Express Loses Runtime Clarity?
Execution Flow Ambiguity
Request handling is resolved dynamically at runtime. Under load, execution paths diverge in ways that static code review cannot predict.
Event Loop Saturation
One slow execution path degrades unrelated requests. Express provides no direct signal when the event loop becomes the bottleneck.
Async Delay Accumulation
Small async delays compound across execution chains. By the time latency is visible, the original source is already obscured.
Unattributed Response Time
Slow responses appear without clear ownership. Engineers cannot determine which execution segment caused the delay.
Concurrency-Induced Variance
Identical requests behave differently under parallel load. Express does not explain why response times fluctuate.
Production-Only Behavior
Certain execution paths activate only under real traffic patterns. These conditions cannot be reproduced reliably outside production.
Error Timing Disconnect
Failures surface after execution has already diverged. The relationship between cause and effect is lost.
Fragmented Runtime Evidence
Logs and metrics describe symptoms, not execution. Engineers must infer behavior instead of observing it.
Complete Performance Visibility for
Express Applications
Real-time observability for Express workloads that helps teams understand request flow, optimize performance, and resolve production issues faster.
Detailed Request Handler Breakdown
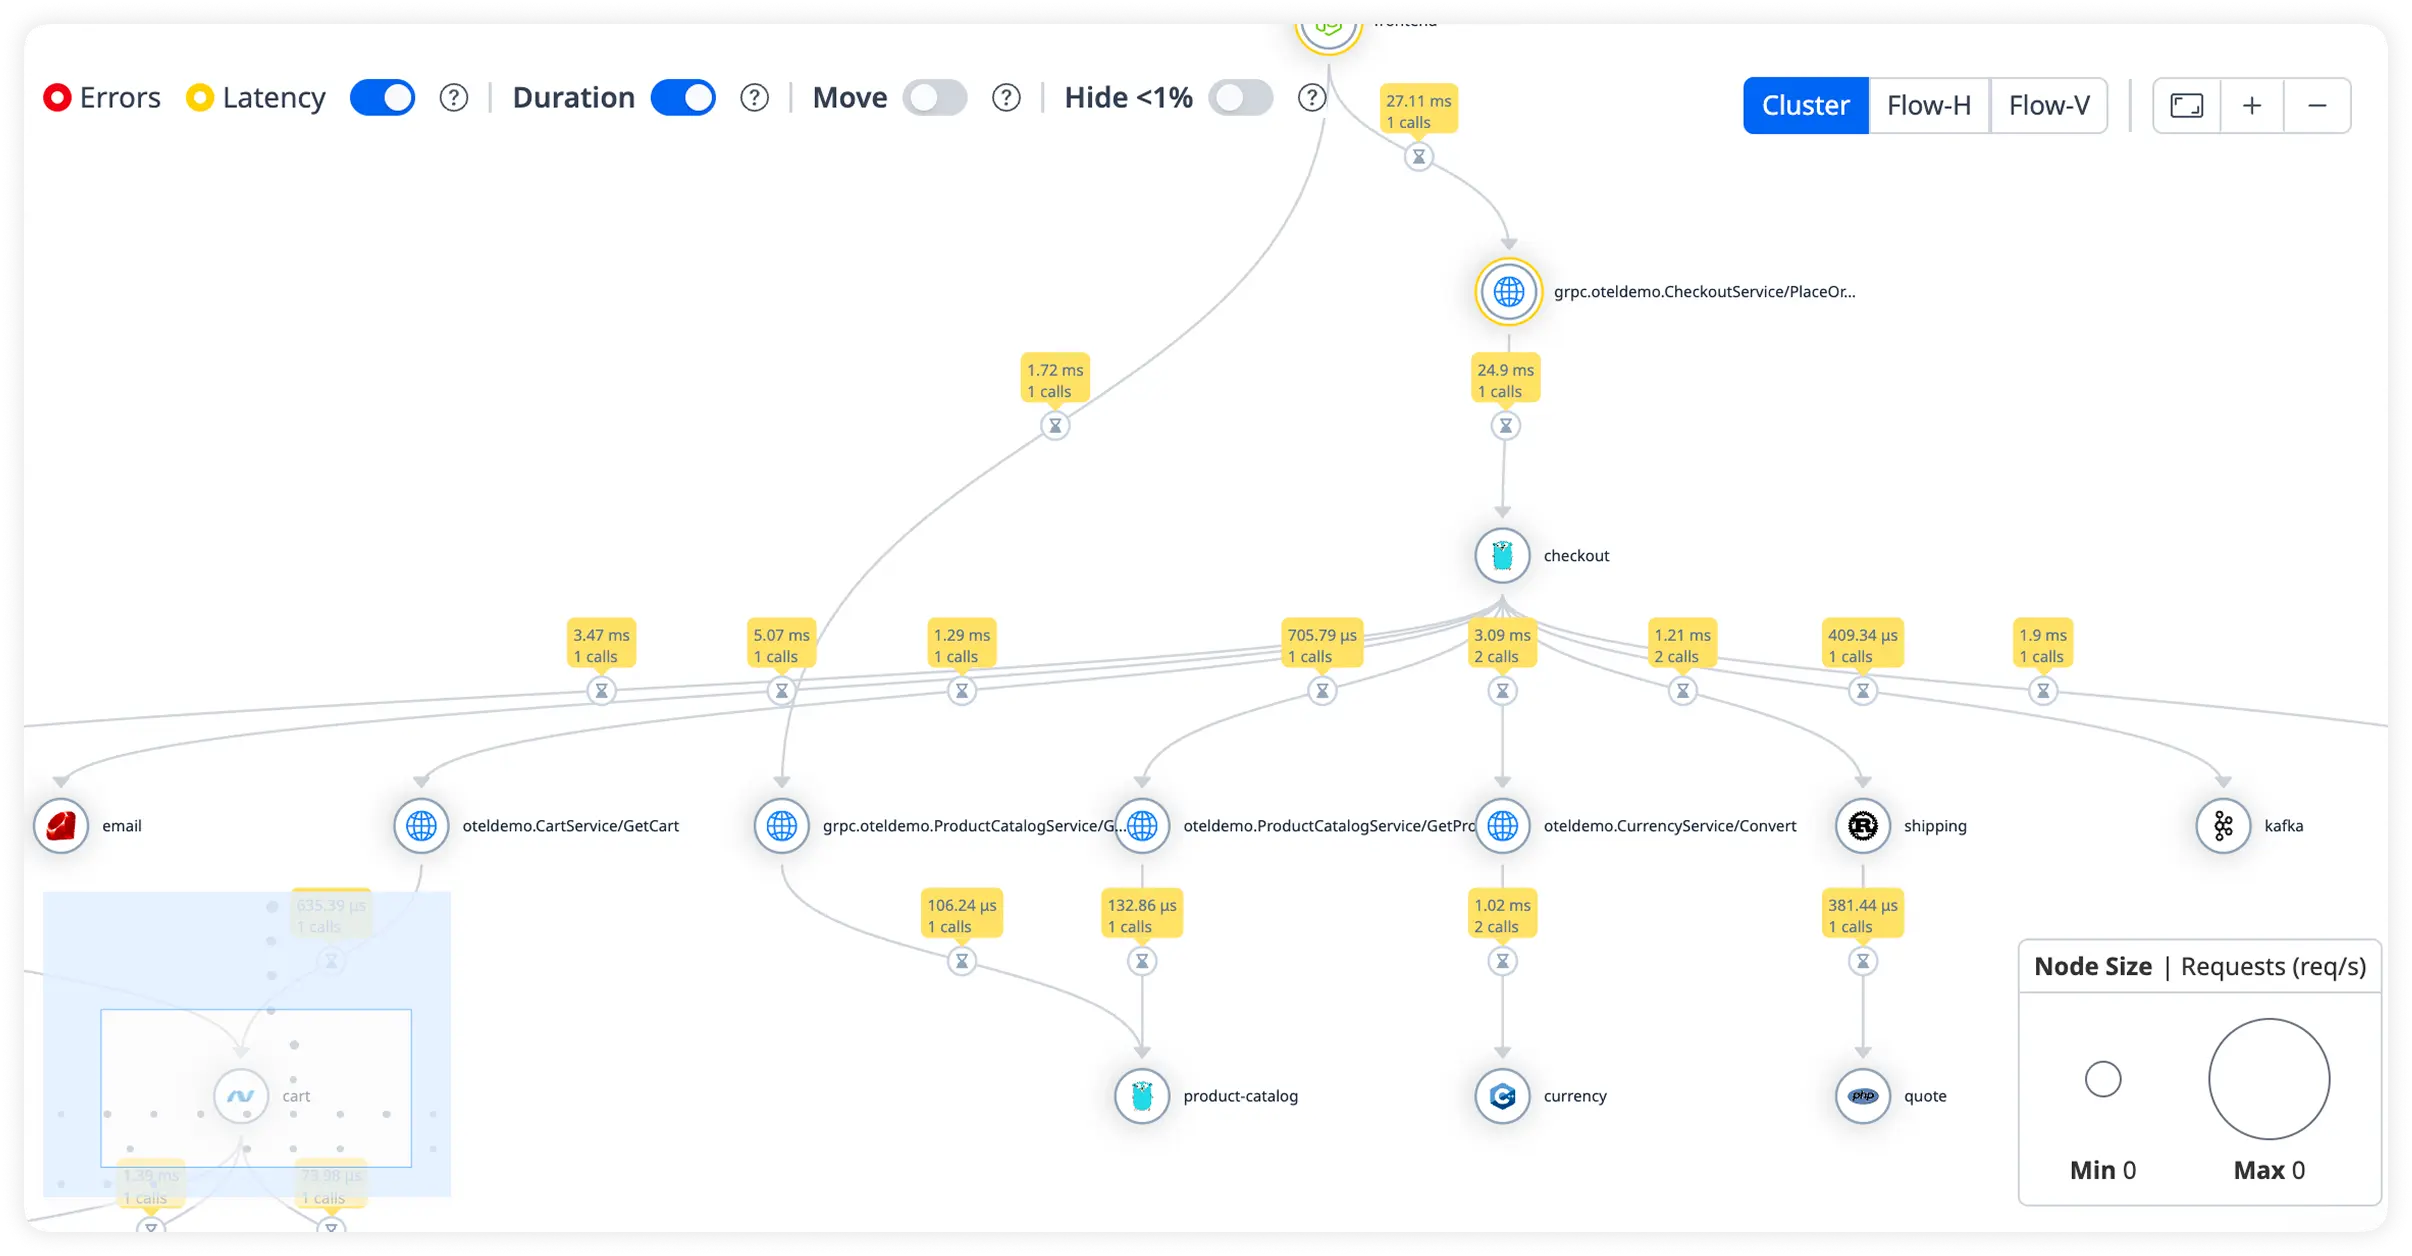
Analyze how each middleware and route handler contributes to request latency. Quickly identify slow processing steps across your Express application.
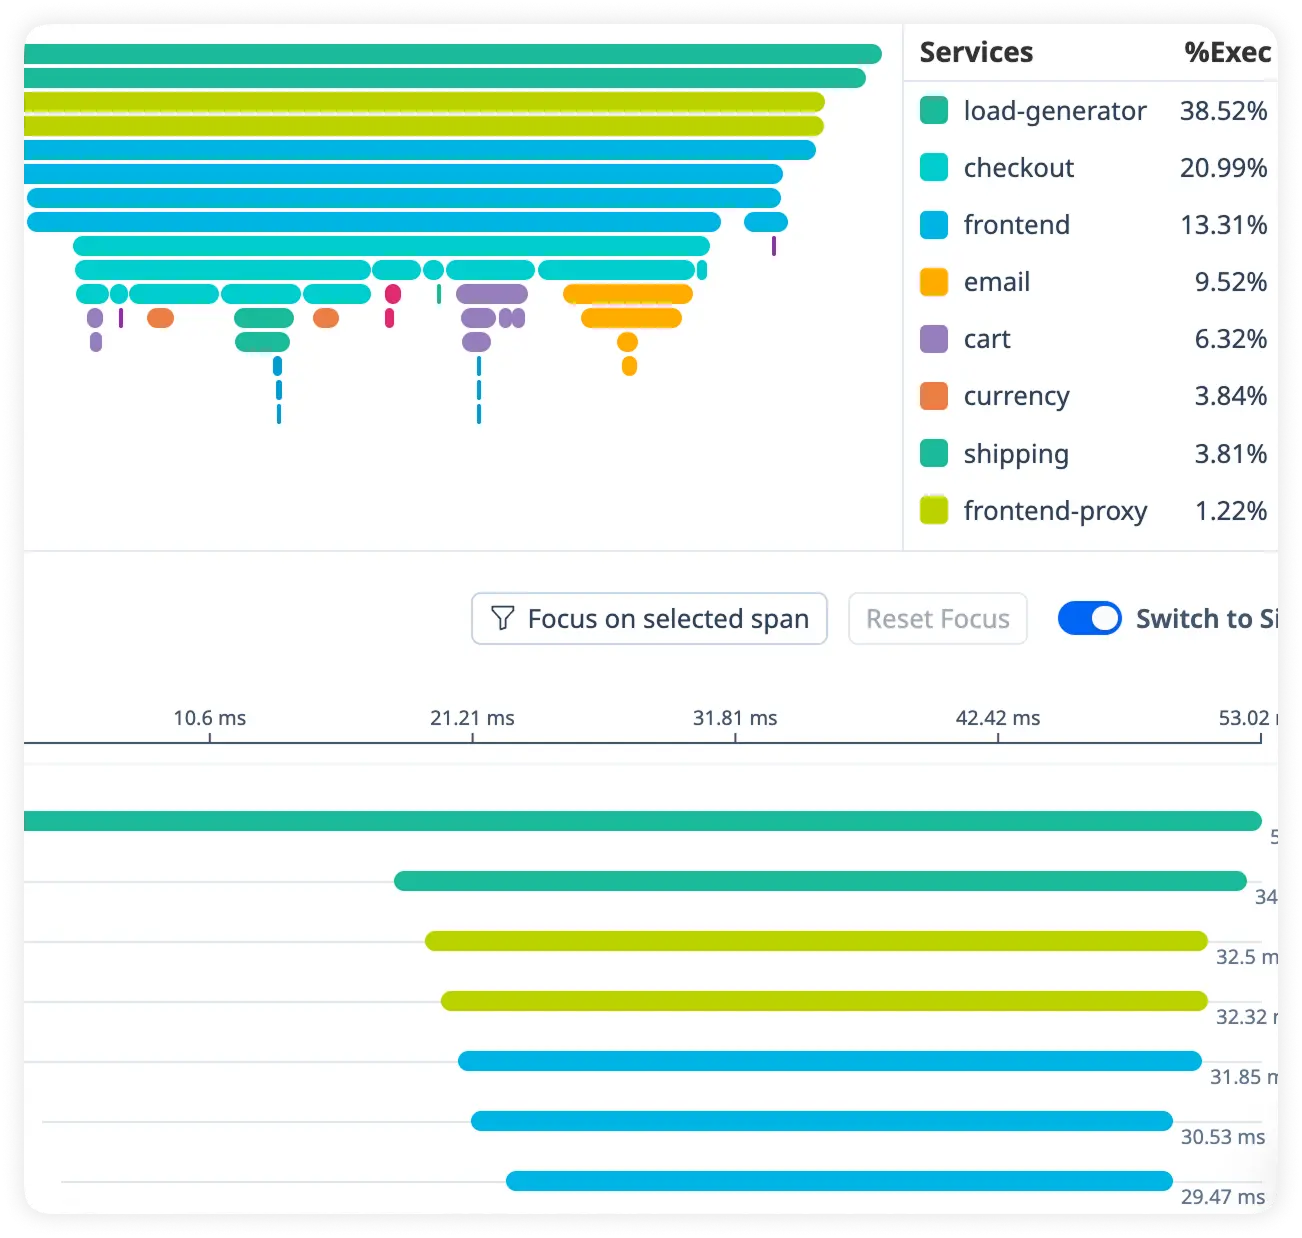
Deep Async Delay Insight
Track time spent in asynchronous operations and background tasks. Uncover hidden delays affecting overall response performance.
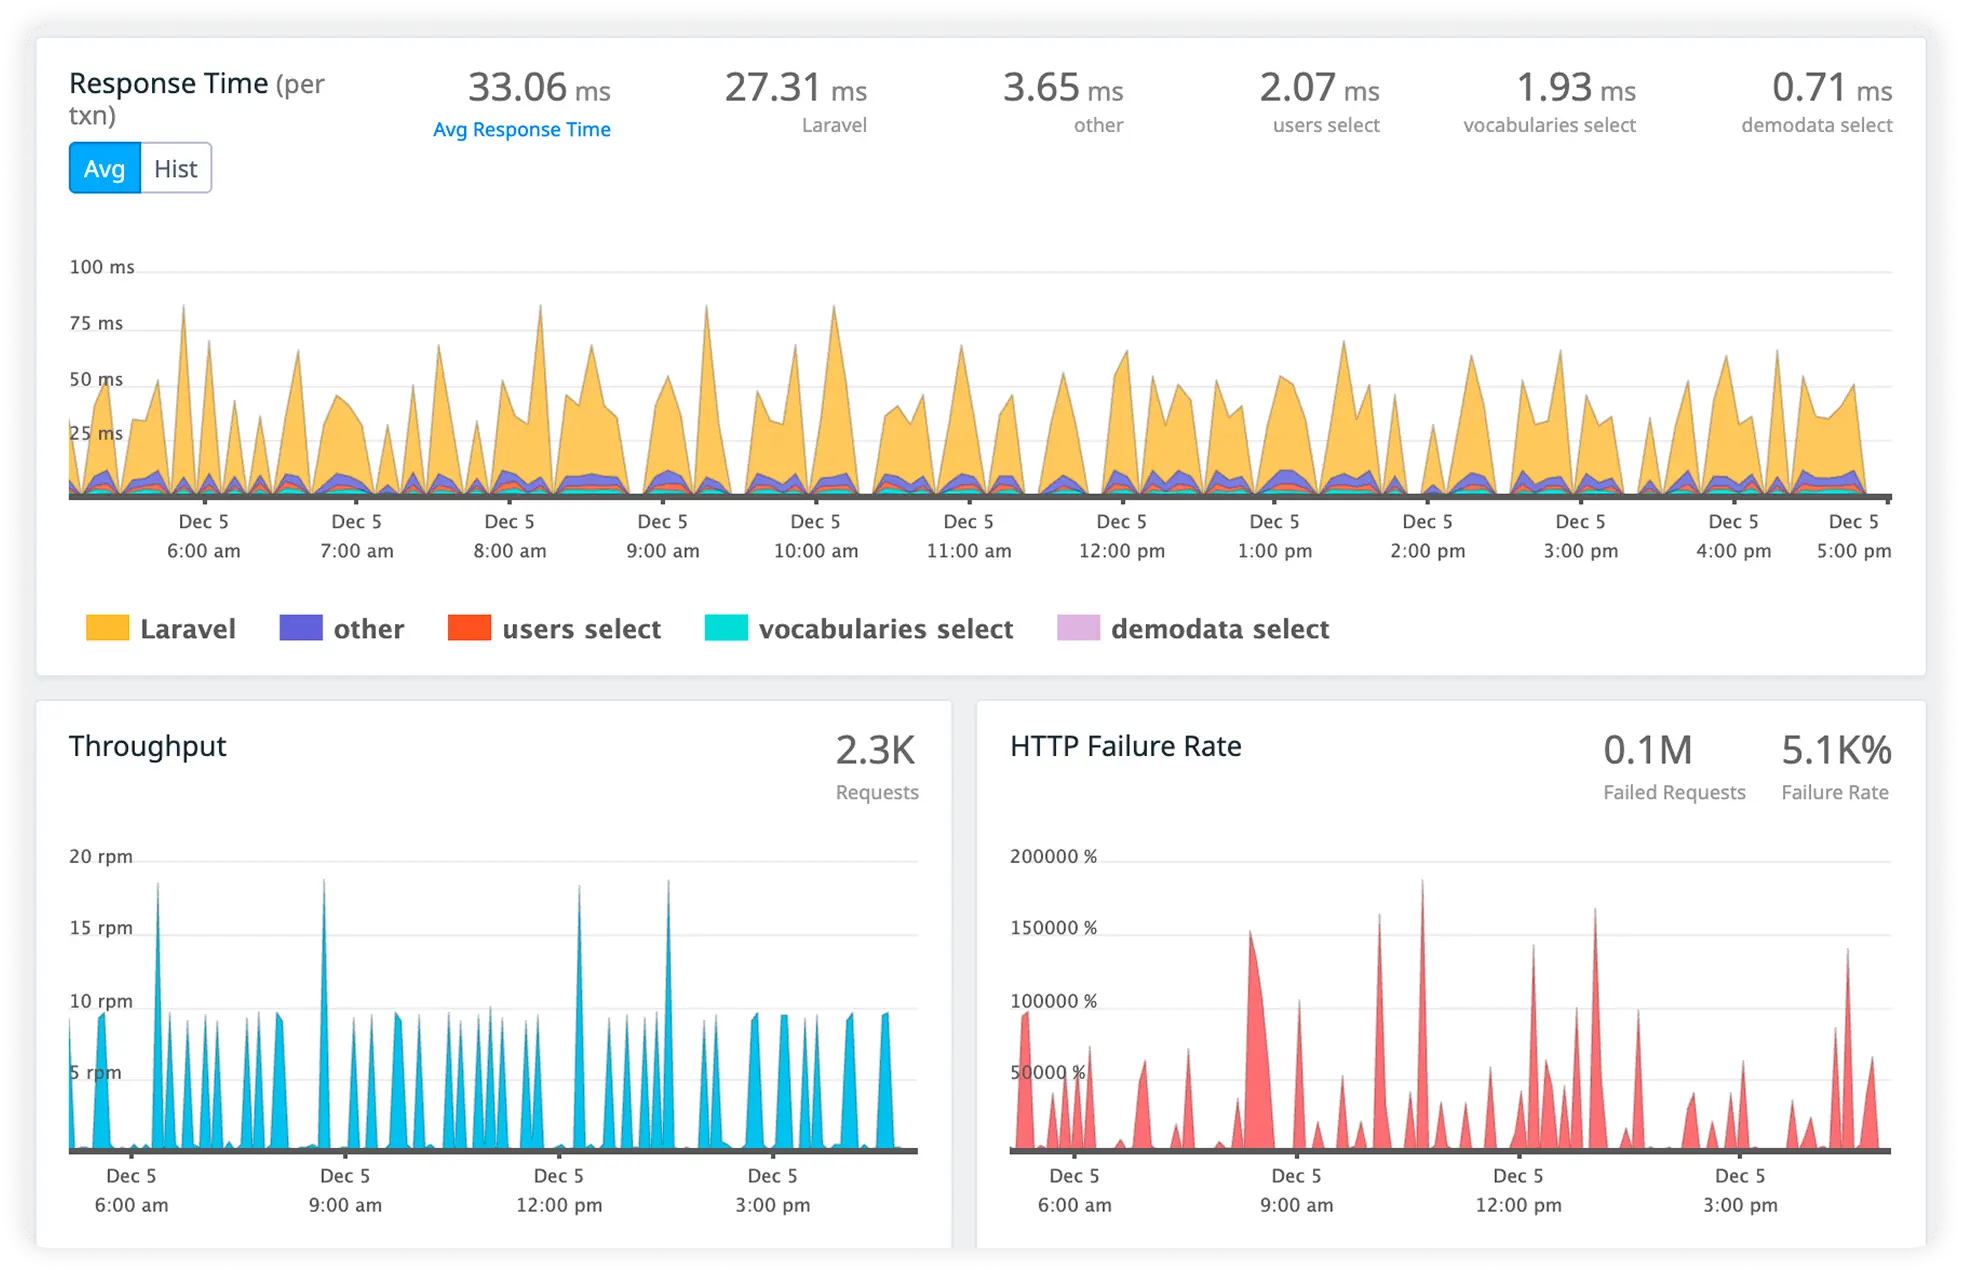
Measure Database Call Cost
Monitor database query execution time and resource usage in real time. Eliminate inefficient database operations that slow application responses.
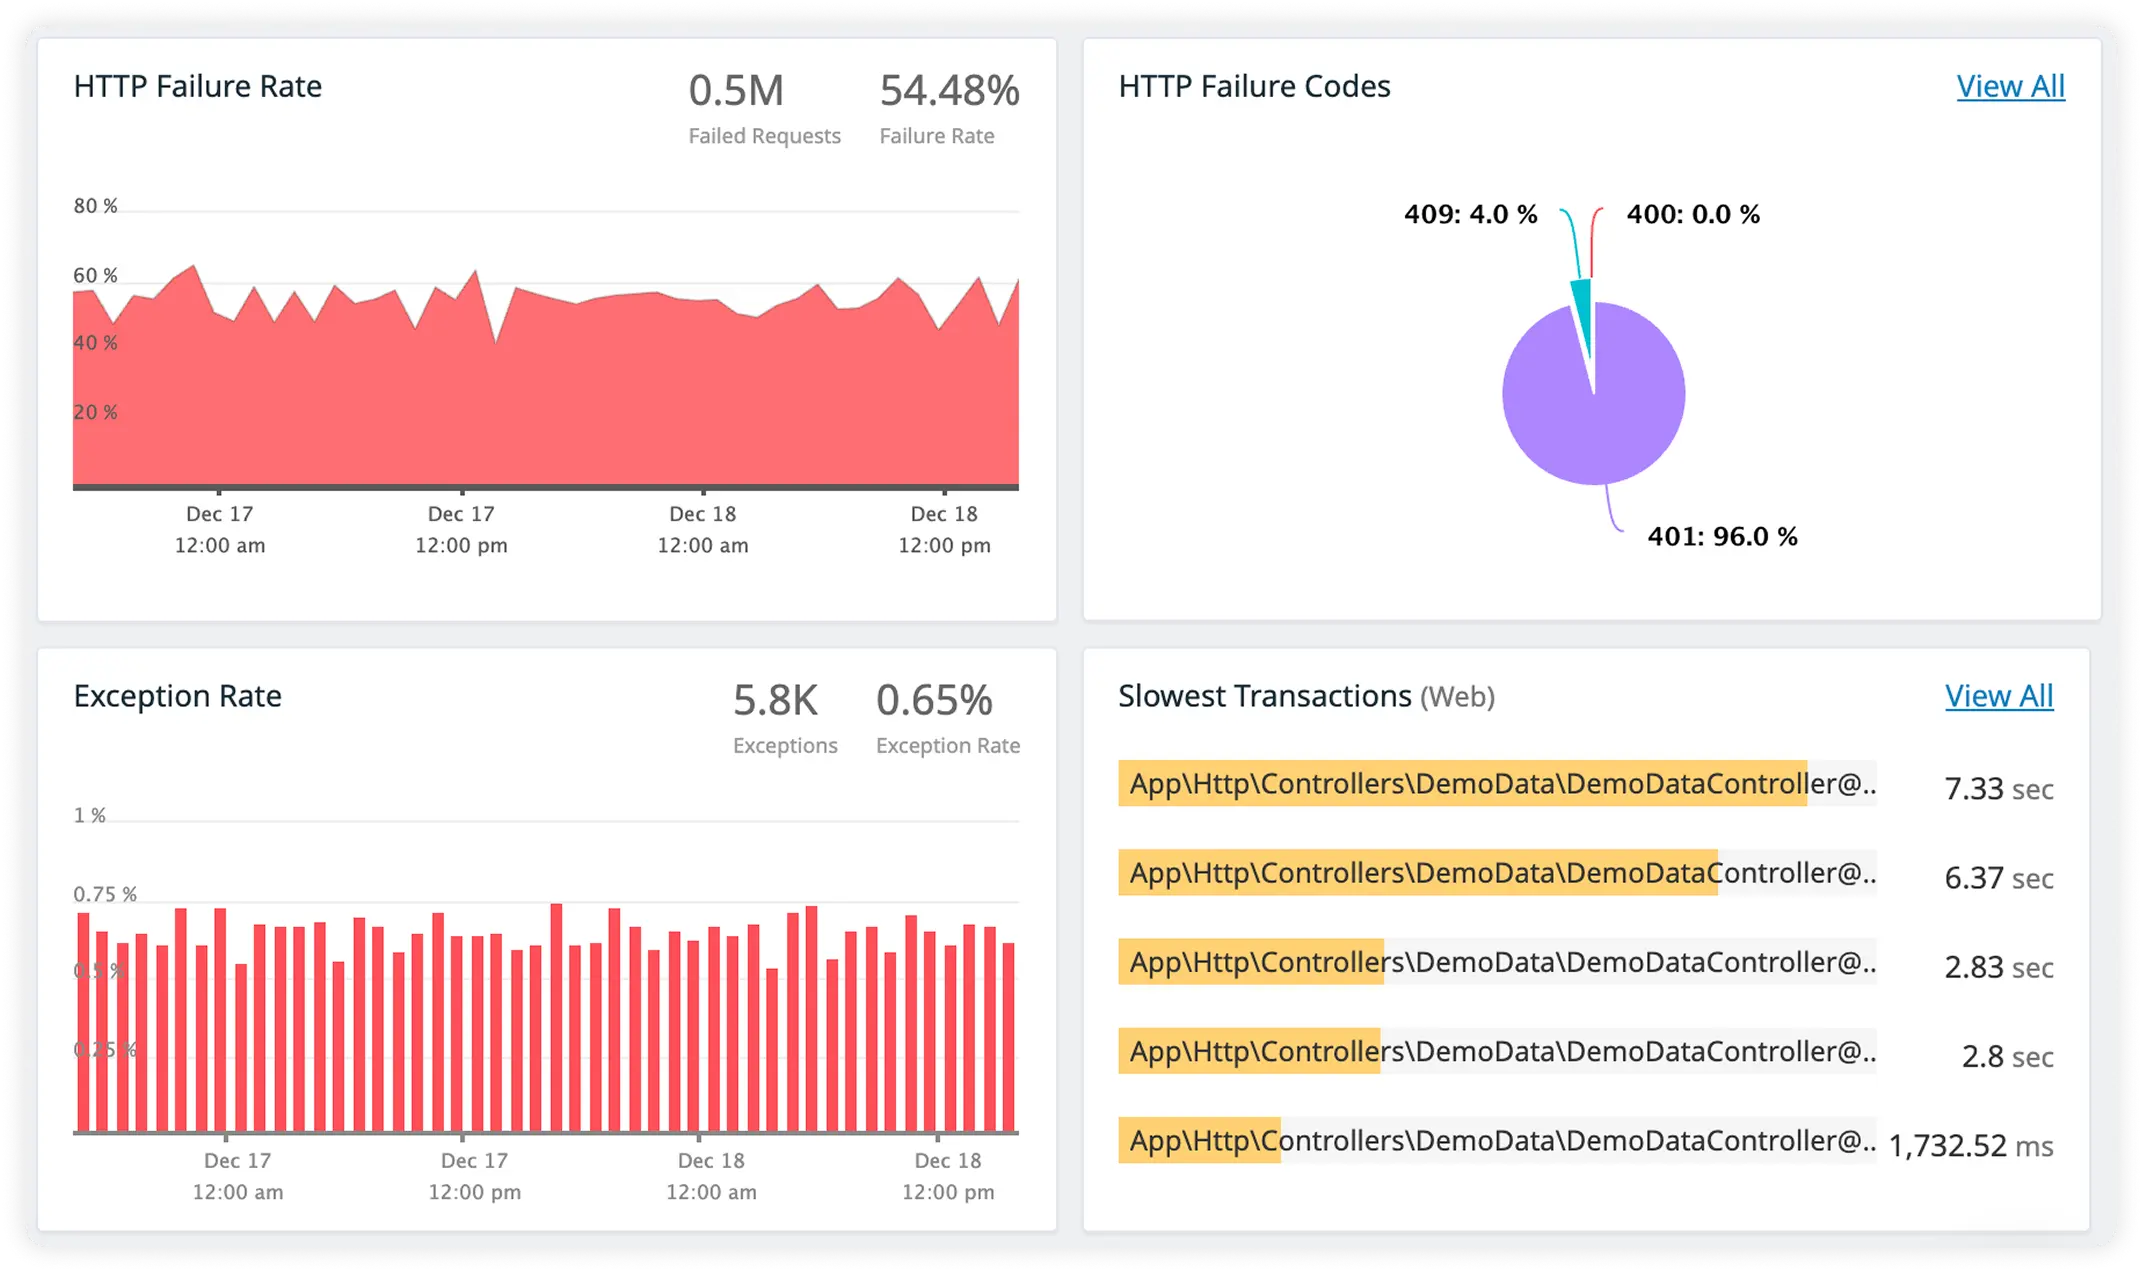
Upstream Service Timing with Error Context
Track response times for external APIs and microservices alongside detailed error information. Pinpoint failures while understanding how upstream services impact performance.
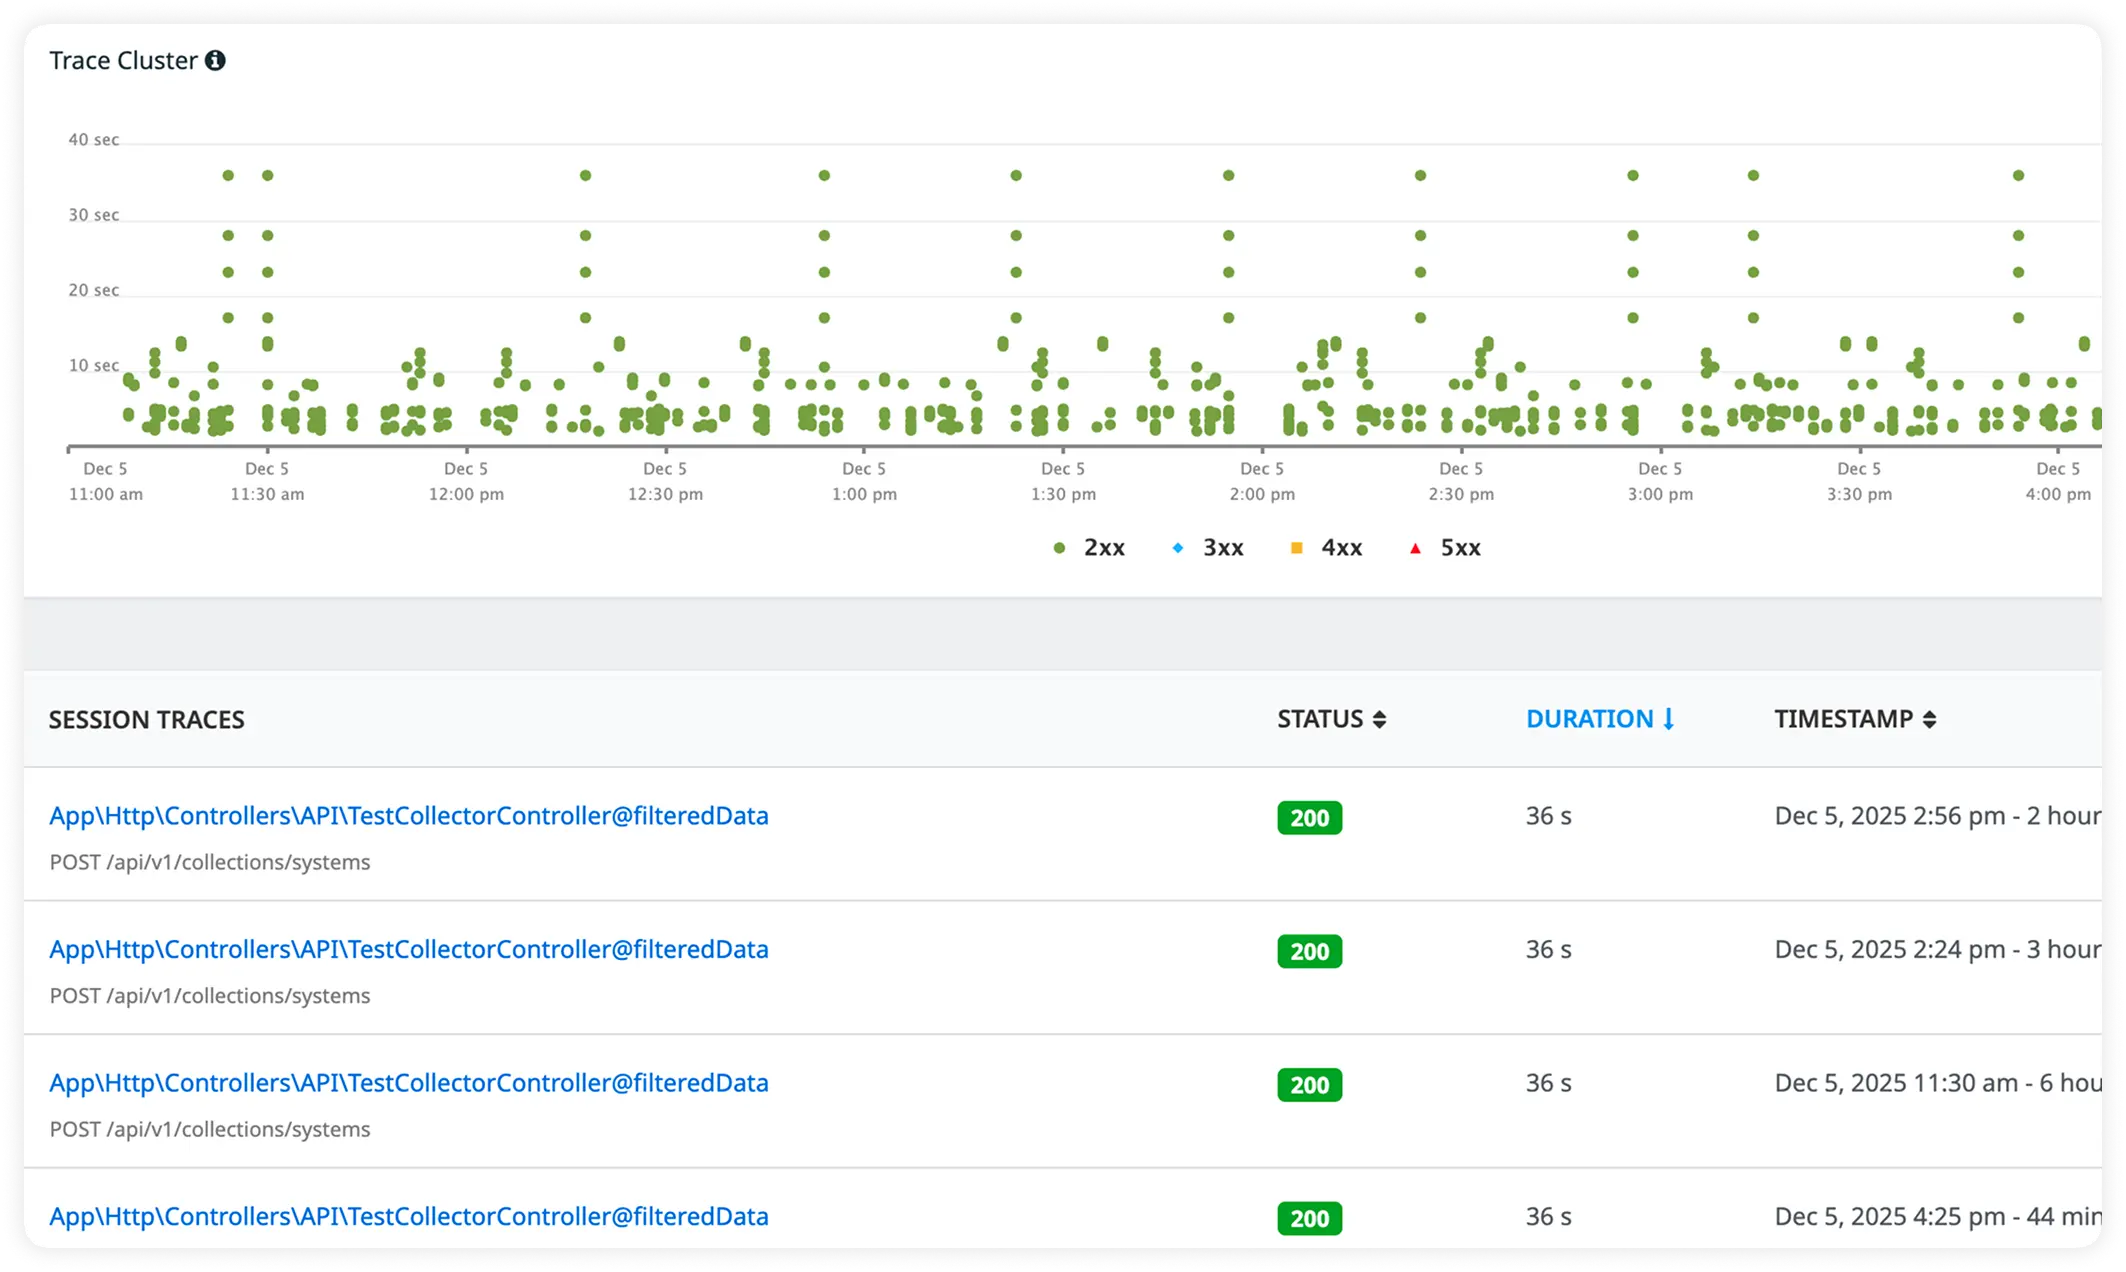
Why Engineering Teams Commit To Atatus?
Express teams adopt Atatus to regain certainty over runtime behavior. It turns opaque execution into something engineers can reason about during normal operation and high-pressure incidents.
Runtime Behavior Visibility
Engineers see how requests actually execute under real traffic, not how they are expected to behave in theory.
Event Loop Awareness
Teams understand when shared execution resources become constrained and how that impacts request latency.
Async Execution Clarity
Asynchronous delays are exposed in context, allowing engineers to reason about timing instead of guessing.
Faster Incident Orientation
During incidents, engineers know where to look first, reducing time spent forming unverified hypotheses.
Low Friction Adoption
Visibility fits existing Express services without requiring architectural or workflow changes.
Shared Execution Understanding
Platform, SRE, and backend teams operate from the same view of runtime behavior, reducing misalignment.
Production Confidence
Engineers rely on data captured from active request execution, not inferred metrics or sampled aggregates.
Scales With Load
High concurrency does not obscure execution detail or distort timing relationships.
Engineer-Centric Design
Runtime behavior is presented in terms engineers debug against, not dashboard primitives.
Unified Observability for Every Engineering Team
Atatus adapts to how engineering teams work across development, operations, and reliability.
Developers
Trace requests, debug errors, and identify performance issues at the code level with clear context.
DevOps
Track deployments, monitor infrastructure impact, and understand how releases affect application stability.
Release Engineer
Measure service health, latency, and error rates to maintain reliability and reduce production risk.