WebSphere Performance Monitoring
Get end-to-end visibility into your WebSphere performance with application monitoring tools. Gain insightful metrics on performance bottlenecks with Java monitoring to optimize your application.
Why WebSphere Production Issues Stay Unresolved?
WebSphere JVM blindspots
Thread pool exhaustion evades detection as executor queues saturate without runtime visibility into lock contention or queue depths under production load.
EJB queuing delays
Container backlogs hide transaction-level breakdowns to database waits, leaving servlet response paths fragmented across filter chains and downstream calls.
GC pause fragmentation
Major/minor collection cycles scatter across verbose logs without aggregate histograms, masking allocation hotspots and survivor space bottlenecks.
Cluster log dispersion
Node-specific events fragment across isolated WebSphere files, obscuring dynamic workload routing and load balancer strain during scale events.
Session replication latency
State sync delays compound invisibly across geographic clusters, evading end-to-end latency percentiles for WebContainer bottlenecks.
Message engine failover gaps
JMS queue backlogs and MDB crashes evade cross-node timelines, prolonging root-cause hunts during distributed outage cascades.
Method profiling absence
Phantom memory leaks demand manual heap walks without bytecode-level granularity, fueling JVM-vs-code ownership debates in SRE teams.
Scaling Breaks Assumptions
As clusters scale horizontally, previously stable workloads behave differently. Performance baselines drift without warning or explanation.
Complete Performance Visibility for
WebSphere Applications
Real-time observability for WebSphere environments that helps teams understand request performance, optimize system behavior, and resolve production issues faster.
Detailed Request Timing Breakdown
Track how long each request takes across servlets, controllers, and internal processing layers. Quickly identify slow execution paths affecting response times.
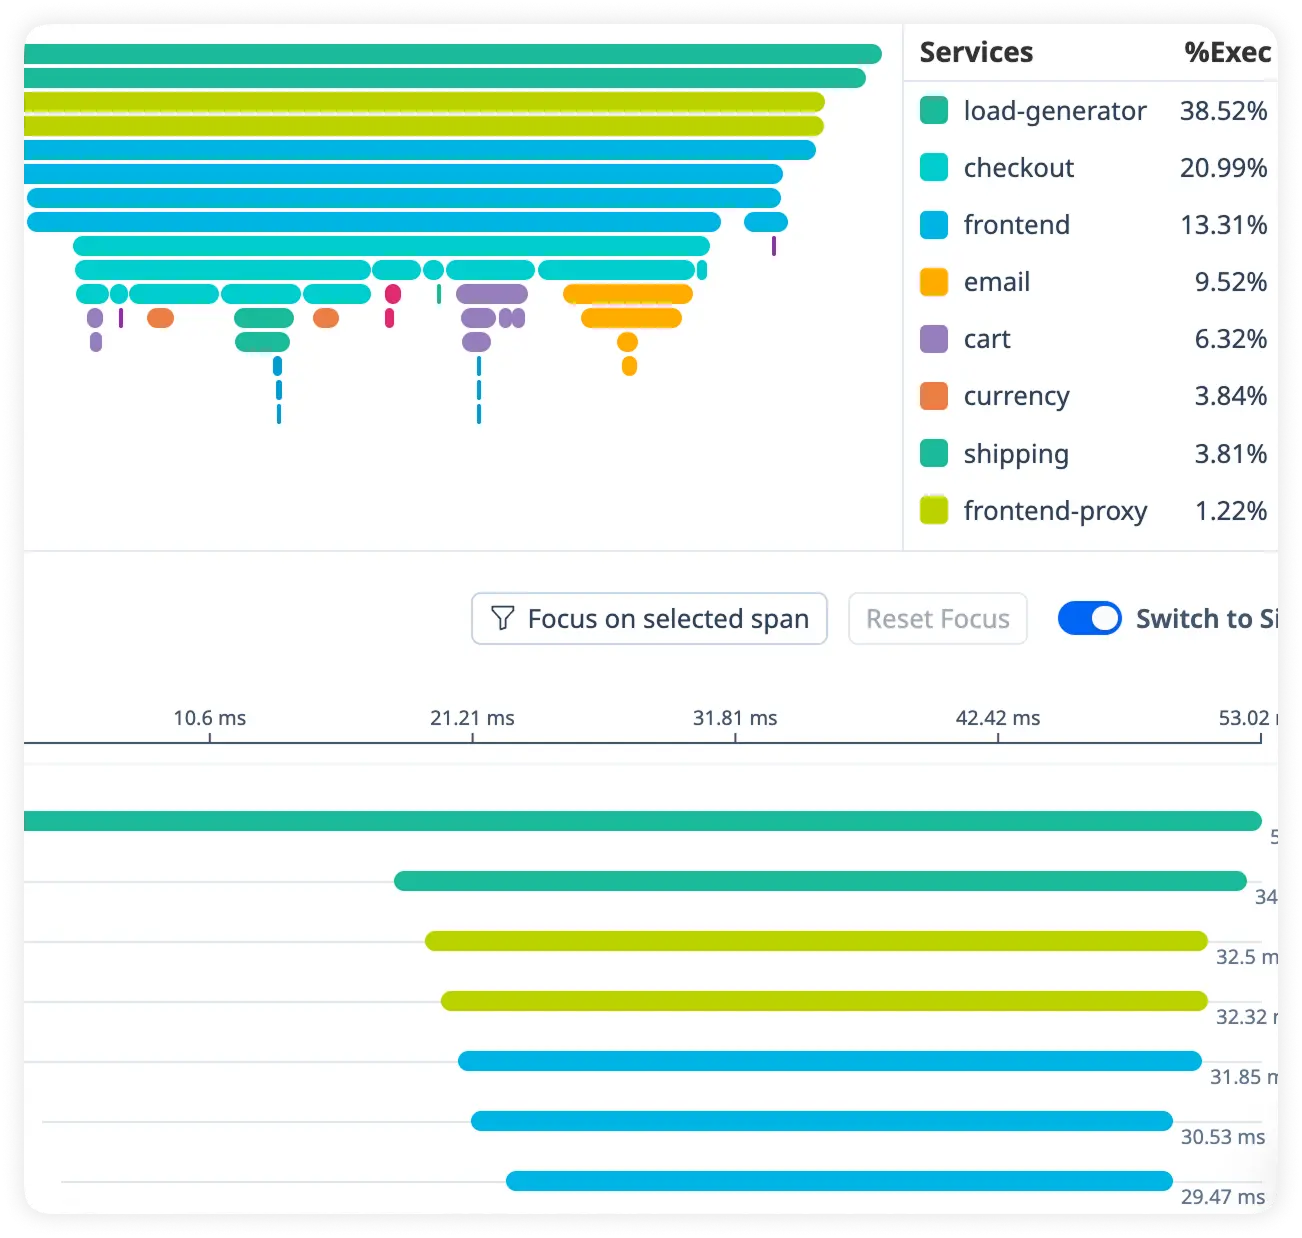
Monitor JVM Response Latency
Measure JVM processing time, thread performance, and runtime delays across requests. Uncover bottlenecks inside the Java virtual machine.
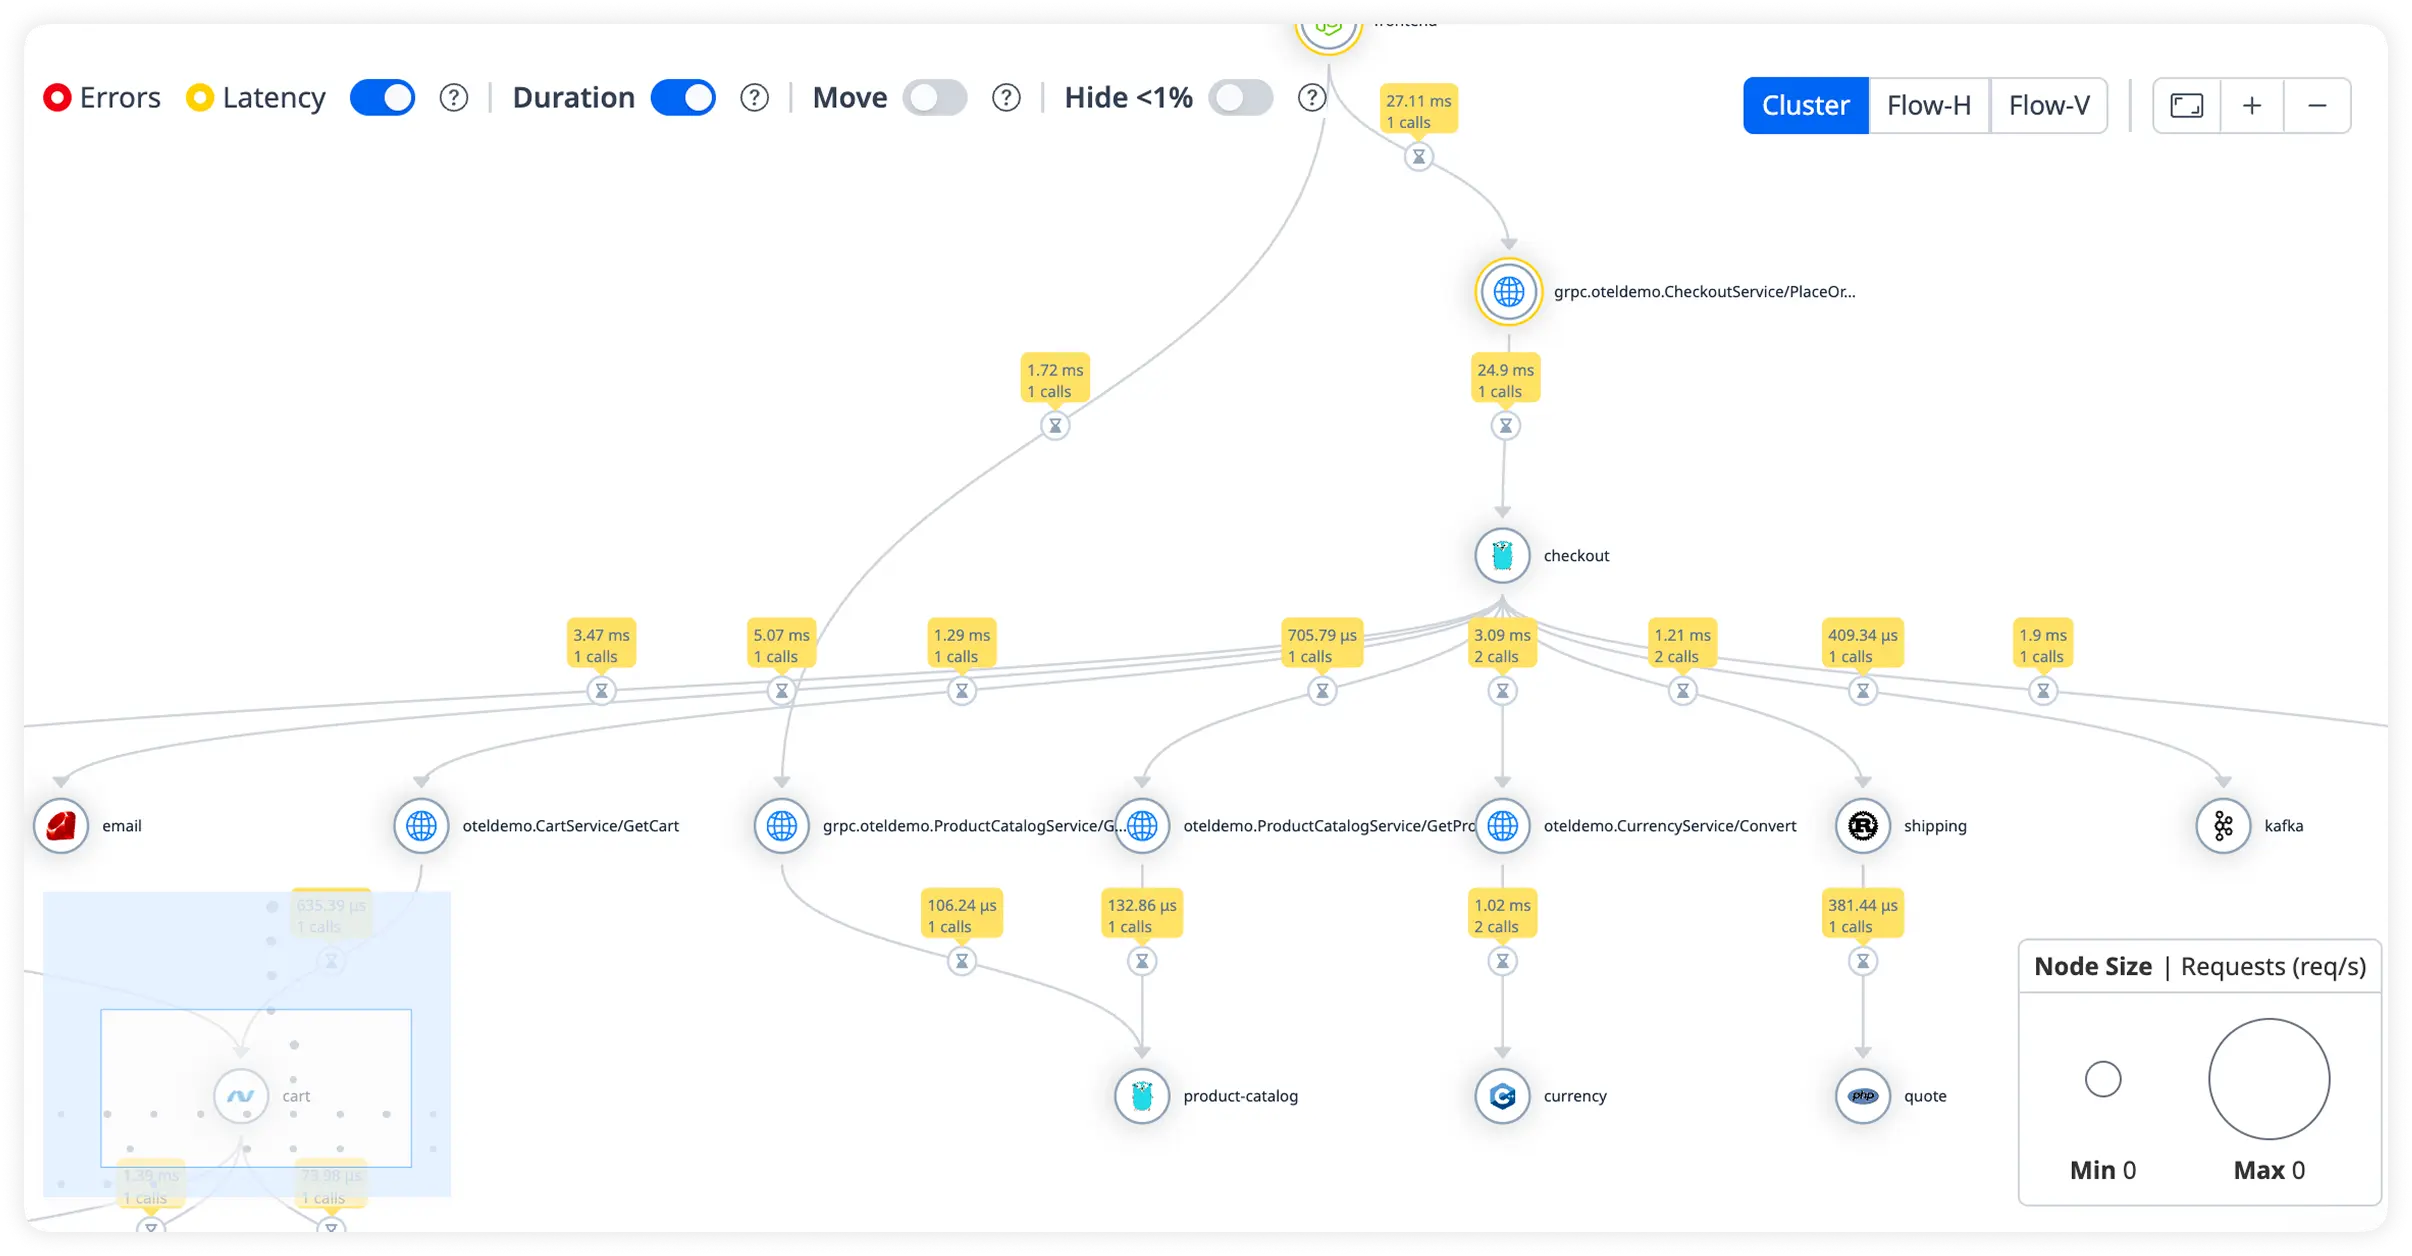
Identify Database Call Delays
Analyze query execution times and database latency in real time. Eliminate inefficient data access slowing application performance.
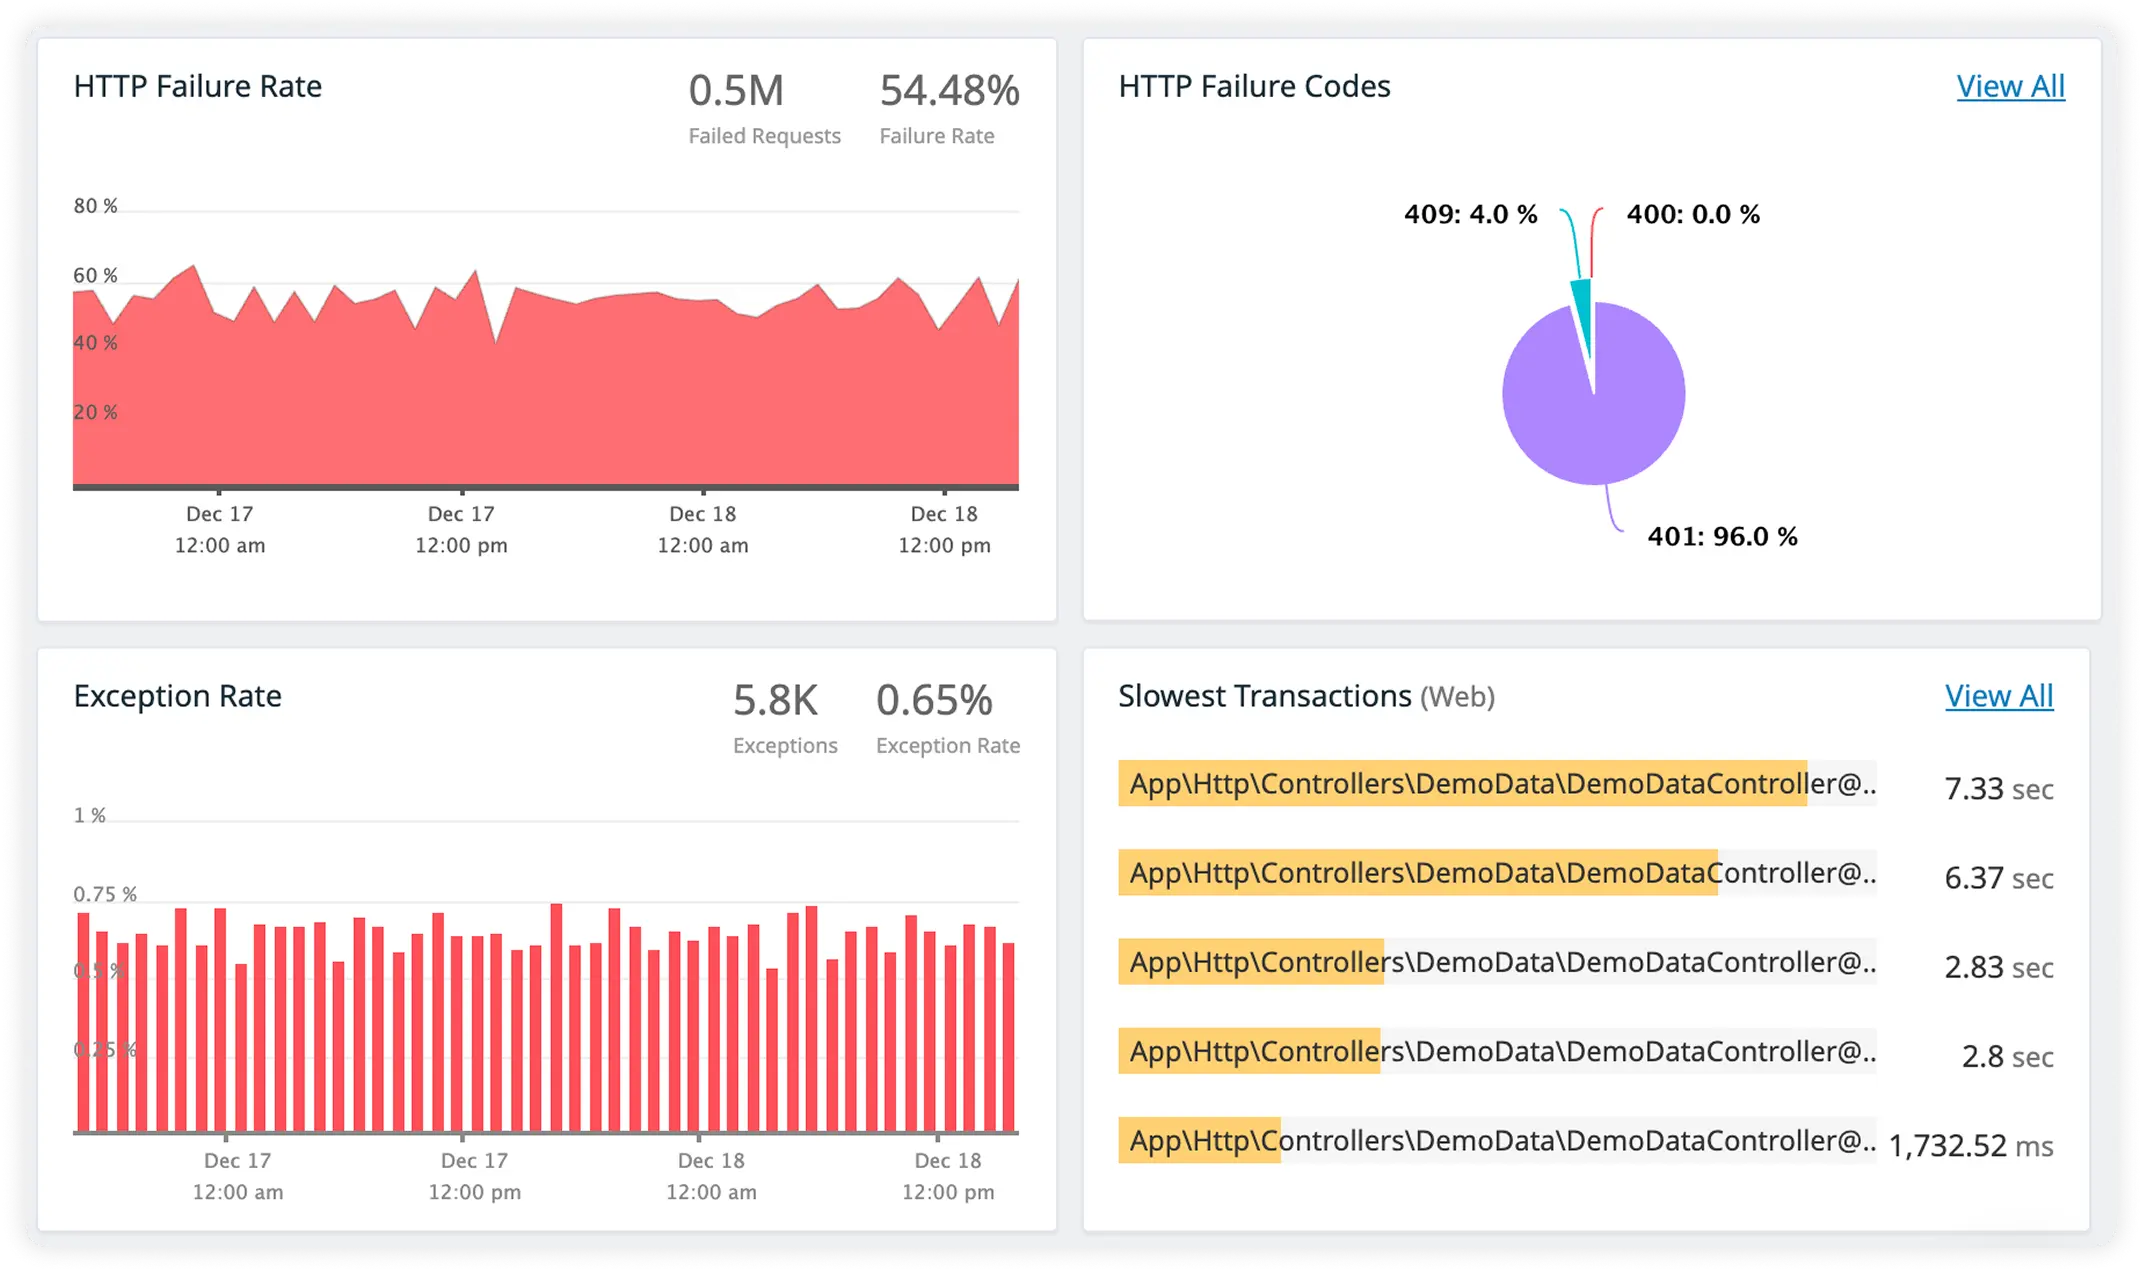
External HTTP Impact with Trace-Linked Logs
Track response times for external services alongside correlated request logs. Debug faster while understanding how external dependencies influence performance.
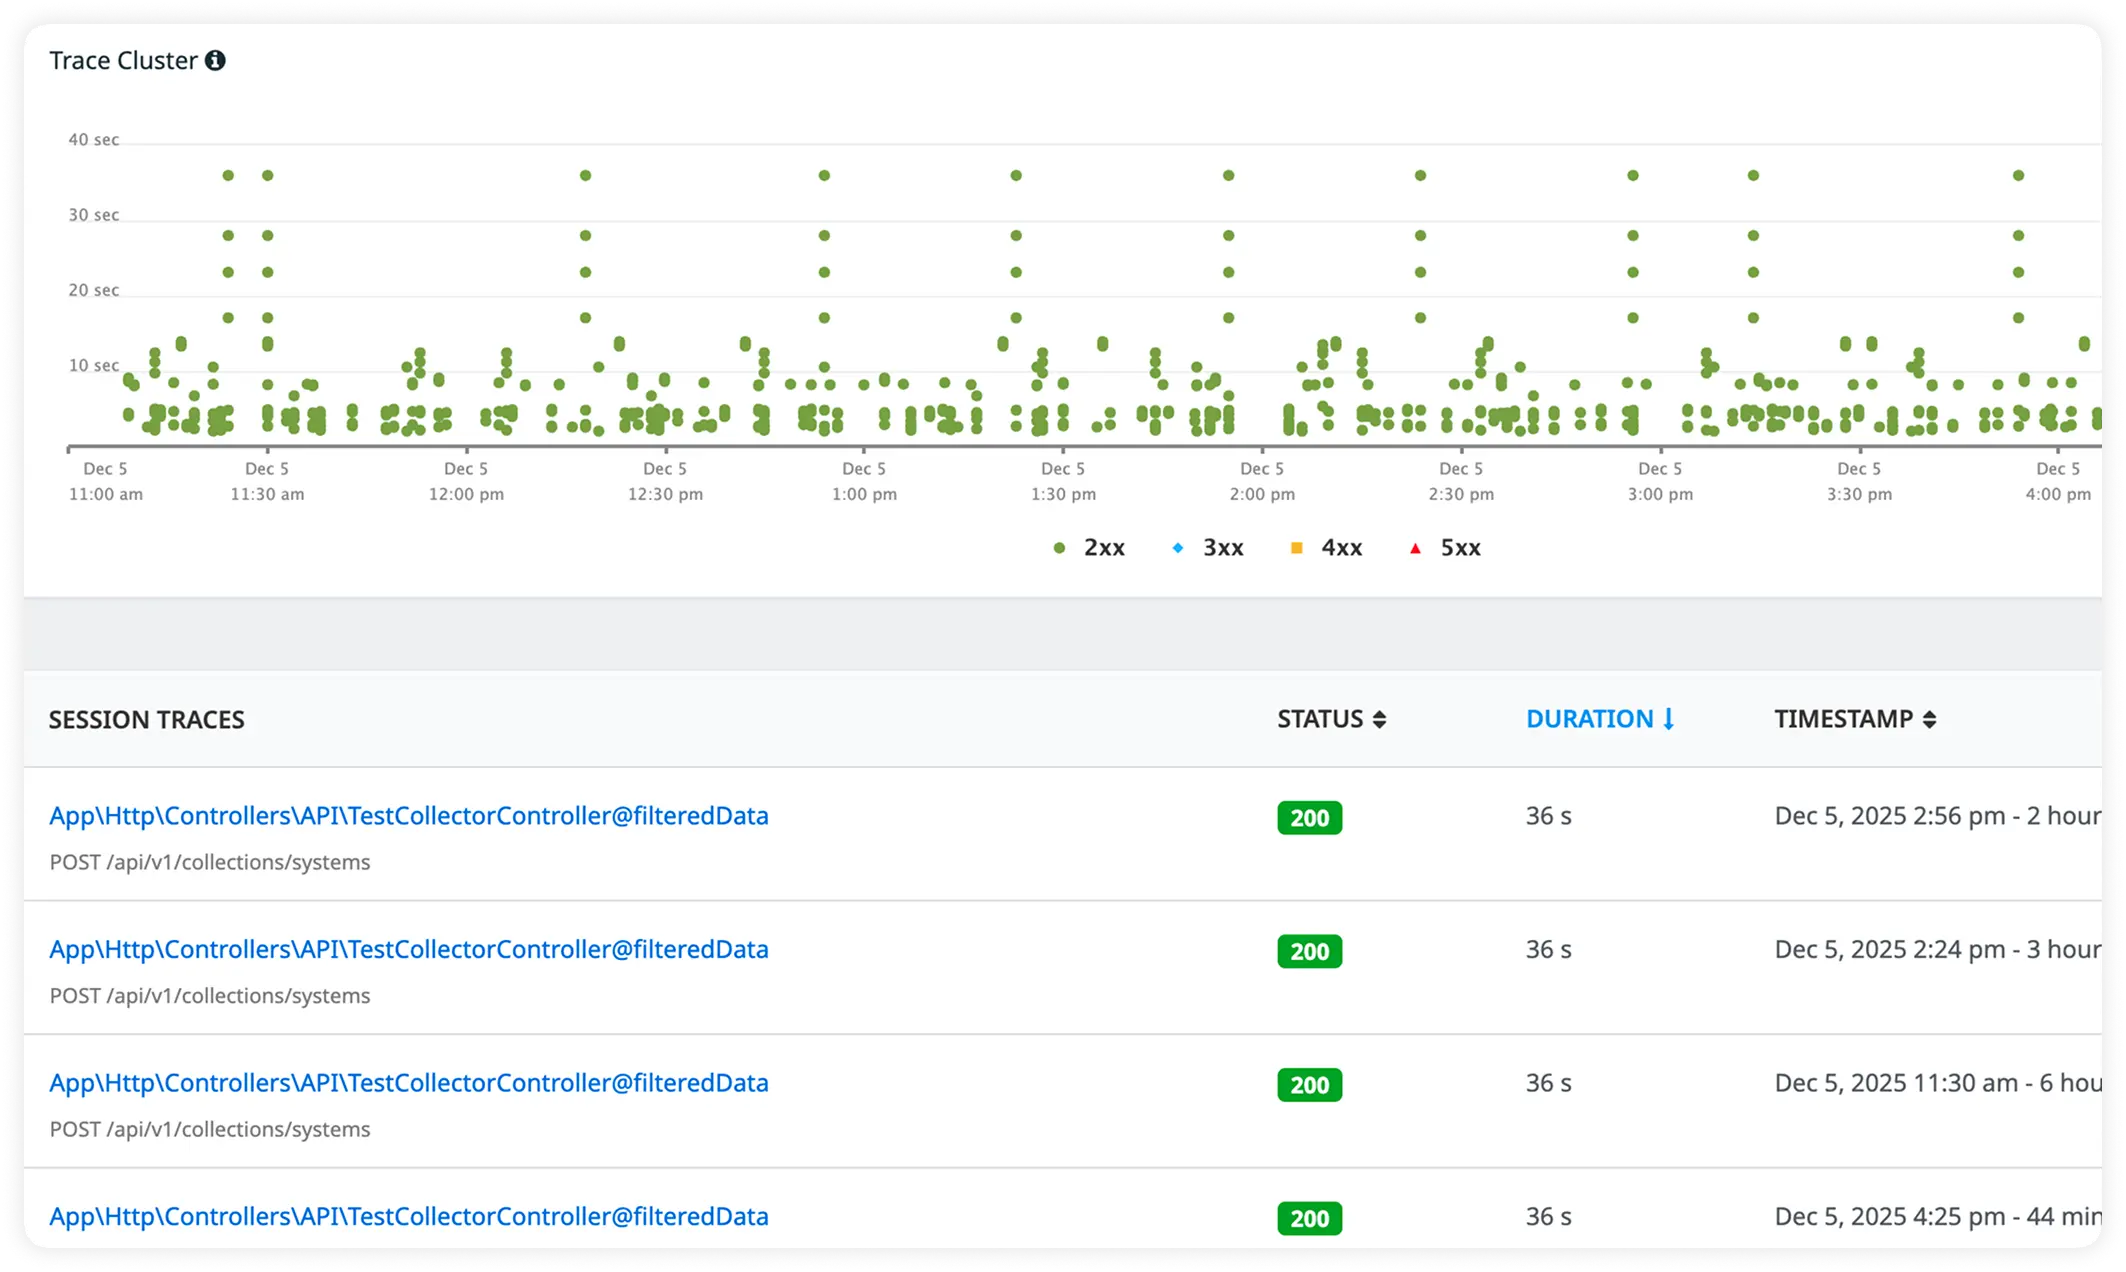
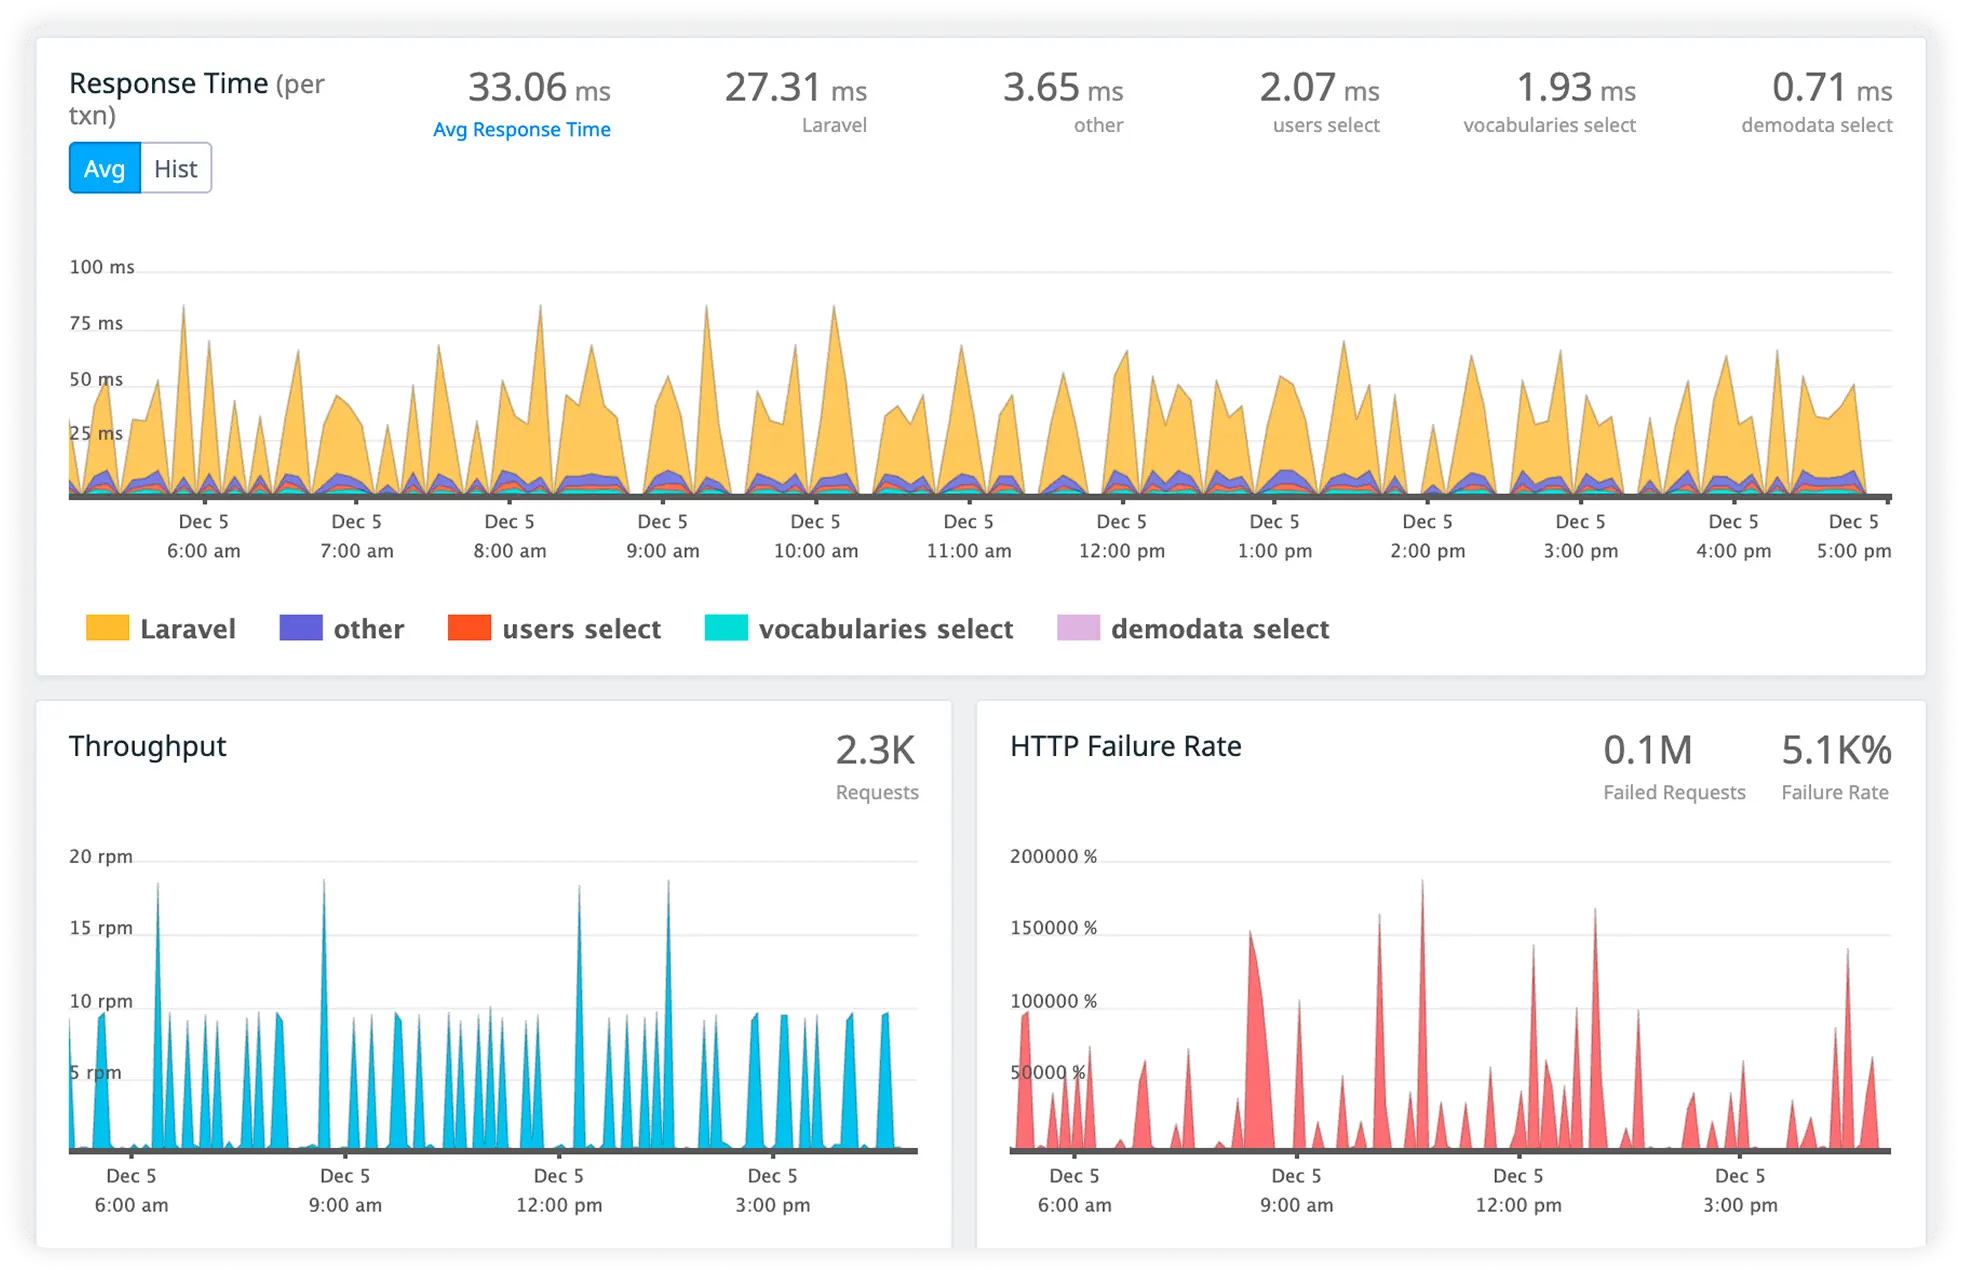
Why Teams Choose Atatus for websphere Observability?
Atatus is chosen when teams need reliable production understanding without friction. It earns trust by aligning with how engineers actually debug, validate, and operate WebSphere systems.
Native WebSphere instrumentation
Zero-config agents hook classloading to capture JVM internals without deployment cycles or config drift across scaled clusters.
End-to-end transaction paths
EJB/servlet flows correlate seamlessly to JDBC deadlocks and external calls, surfacing latency cliffs in unified trace views.
EJB-Level Stack Fidelity
Transaction rollbacks map to exact interceptor chains in prod dumps. Developers repro XA failures with container-equivalent traces. Debugging flows match runtime exactly.
Runtime GC mastery
Pause histograms predict old-gen promotion failures while metaspace traces link classloader leaks to allocation patterns proactively.
Automated thread diagnostics
Live heap walkers parse executor saturation alongside SQL waits, cutting manual dump analysis from hours to seconds.
PMI metric federation
Native counters stream into distributed queries with custom MBean pivots, linking admin console data to flame graph hotspots.
Cluster scale propagation
Auto-discovery instruments dynamic nodes while traffic histograms expose load balancer inefficiencies and session affinity gaps.
Prod validation
Backend stacks diff dev/staging baselines against cluster p99s, quantifying code deploy regressions empirically before rollout.
Incident velocity acceleration
Unified query planes shave SRE MTTR via anomaly flyouts that contextualize alerts with method-level root causes instantly.
Unified Observability for Every Engineering Team
Atatus adapts to how engineering teams work across development, operations, and reliability.
Developers
Trace requests, debug errors, and identify performance issues at the code level with clear context.
DevOps
Track deployments, monitor infrastructure impact, and understand how releases affect application stability.
Release Engineer
Measure service health, latency, and error rates to maintain reliability and reduce production risk.