Dynamic Runtime Ambiguity
Grails resolves controllers, services, and domain logic dynamically at runtime, making it difficult for engineers to confirm which code paths executed under real traffic conditions rather than assumed framework behavior.
Get end-to-end visibility into your Grails performance with application monitoring tools. Gain insightful metrics on performance bottlenecks with Java monitoring to optimize your application.
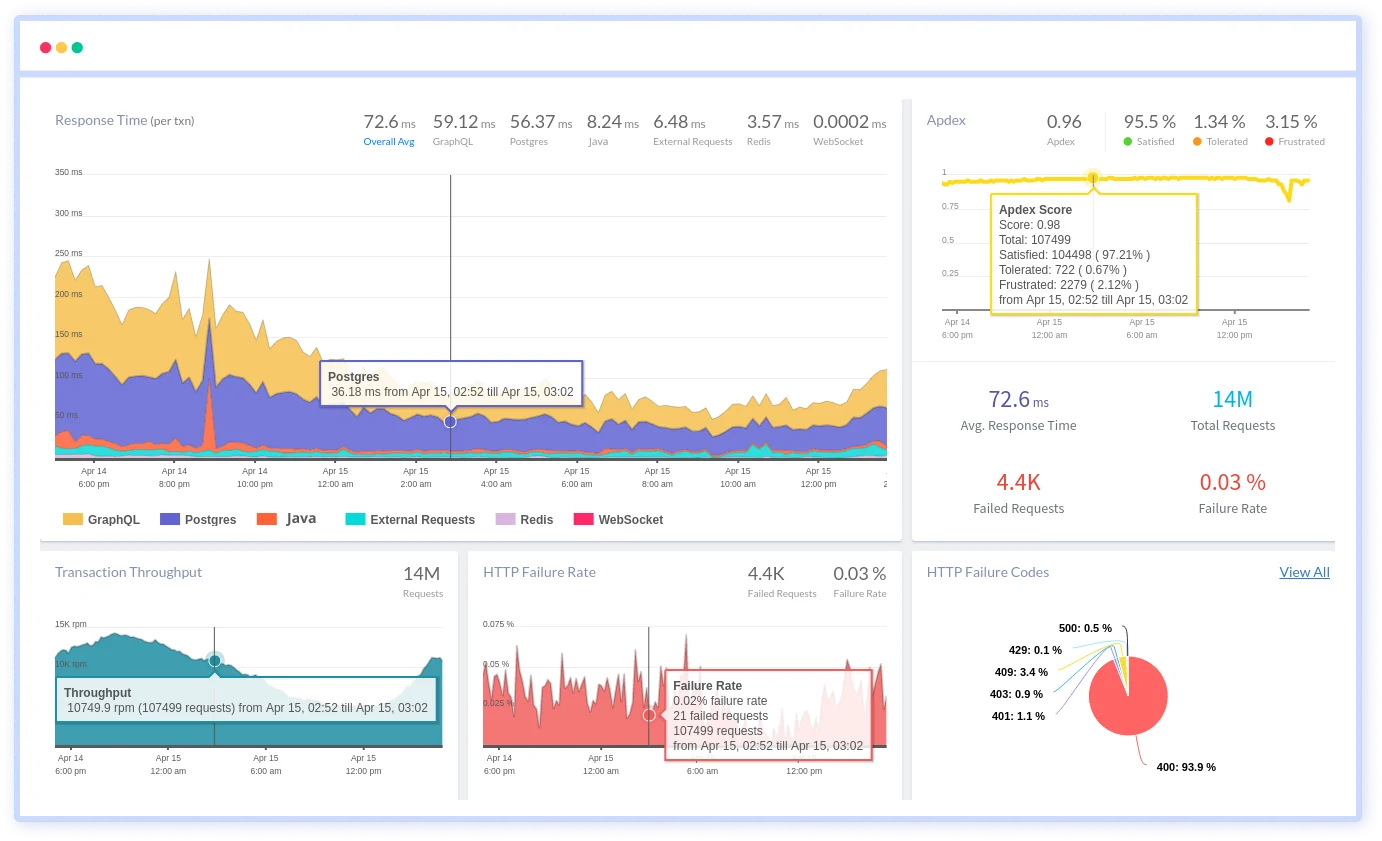
Grails resolves controllers, services, and domain logic dynamically at runtime, making it difficult for engineers to confirm which code paths executed under real traffic conditions rather than assumed framework behavior.
GORM-generated queries execute implicitly, causing performance degradation without clear attribution to specific request flows, domain models, or transactional boundaries.
JVM scheduling, garbage collection, and thread usage degrade performance gradually, leaving teams unaware of contention until latency and errors become visible.
Execution context breaks across scheduled jobs, async services, and message processing, forcing engineers to manually reconstruct failure paths.
Plugins introduce interception, filters, and lifecycle hooks that affect runtime execution, often without clear visibility when issues surface in production.
Differences in configuration resolution, external integrations, and JVM tuning cause runtime outcomes that no longer match staging or test assumption.
Framework layers and dynamic method calls inflate stack traces, slowing root-cause isolation and increasing investigation time.
Increased concurrency stresses Grails internals and JVM resources, leading to gradual degradation without clear early warning signals.
Real-time observability for Grails workloads that helps teams understand request behavior, optimize execution flow, and resolve production issues faster.
Track how long each request takes from entry to response. Quickly uncover slow execution paths affecting application responsiveness.
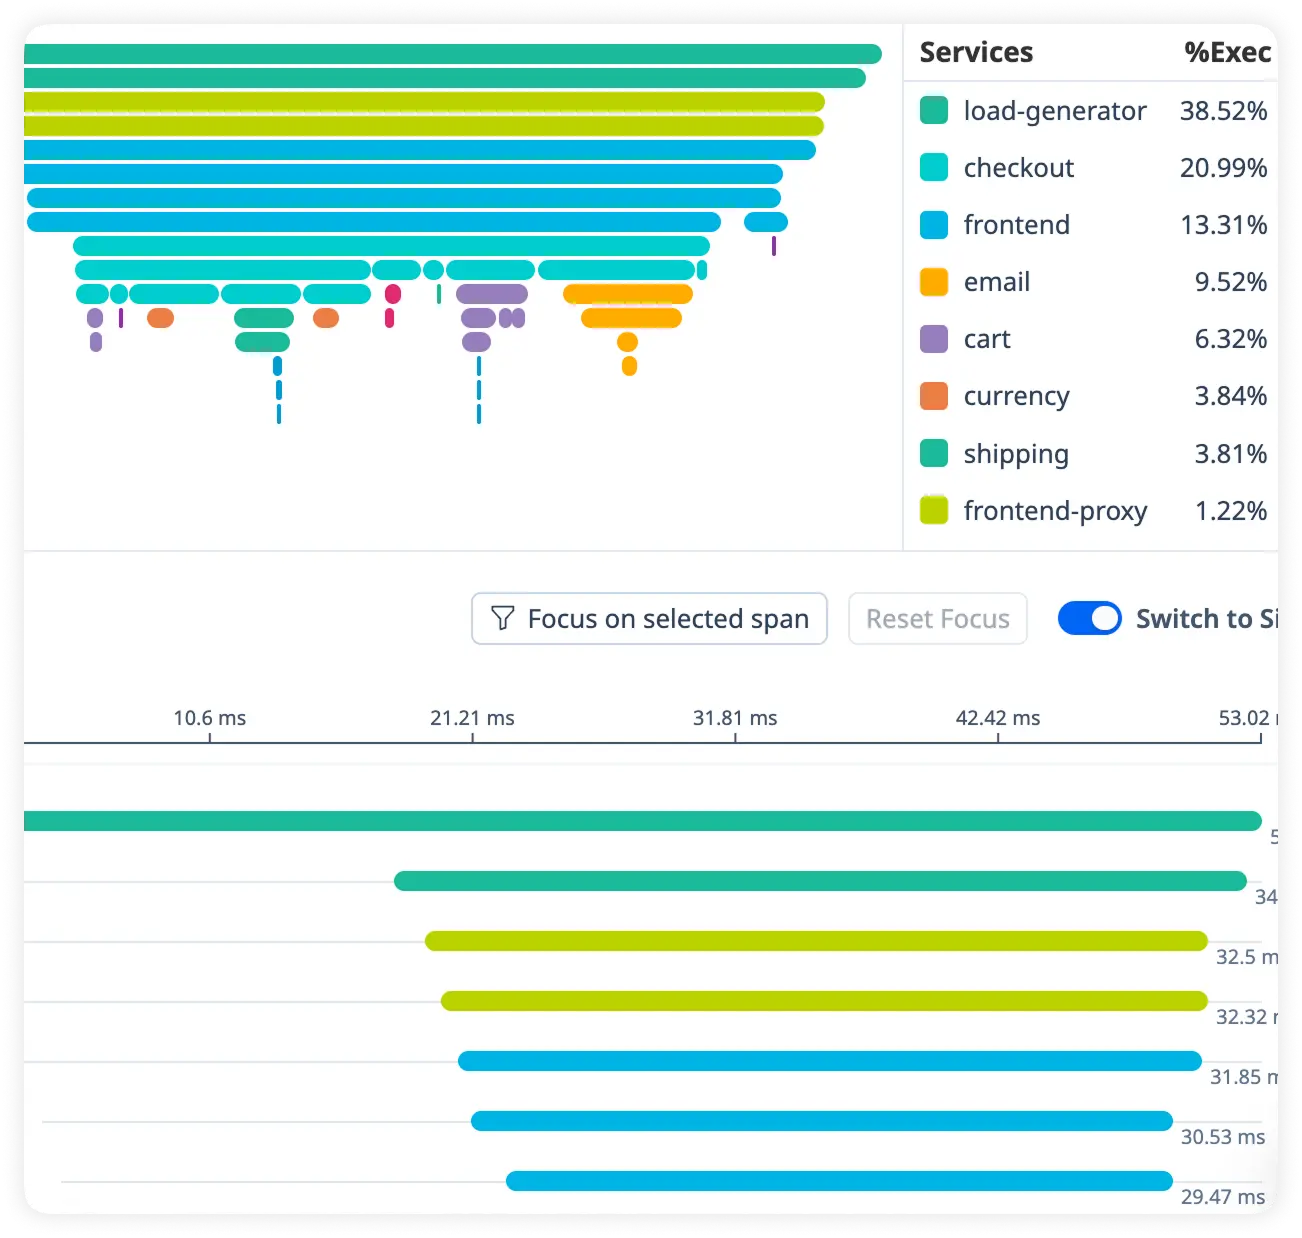
Measure how much time each controller action consumes during request handling. Pinpoint slow processing steps across your Grails application.
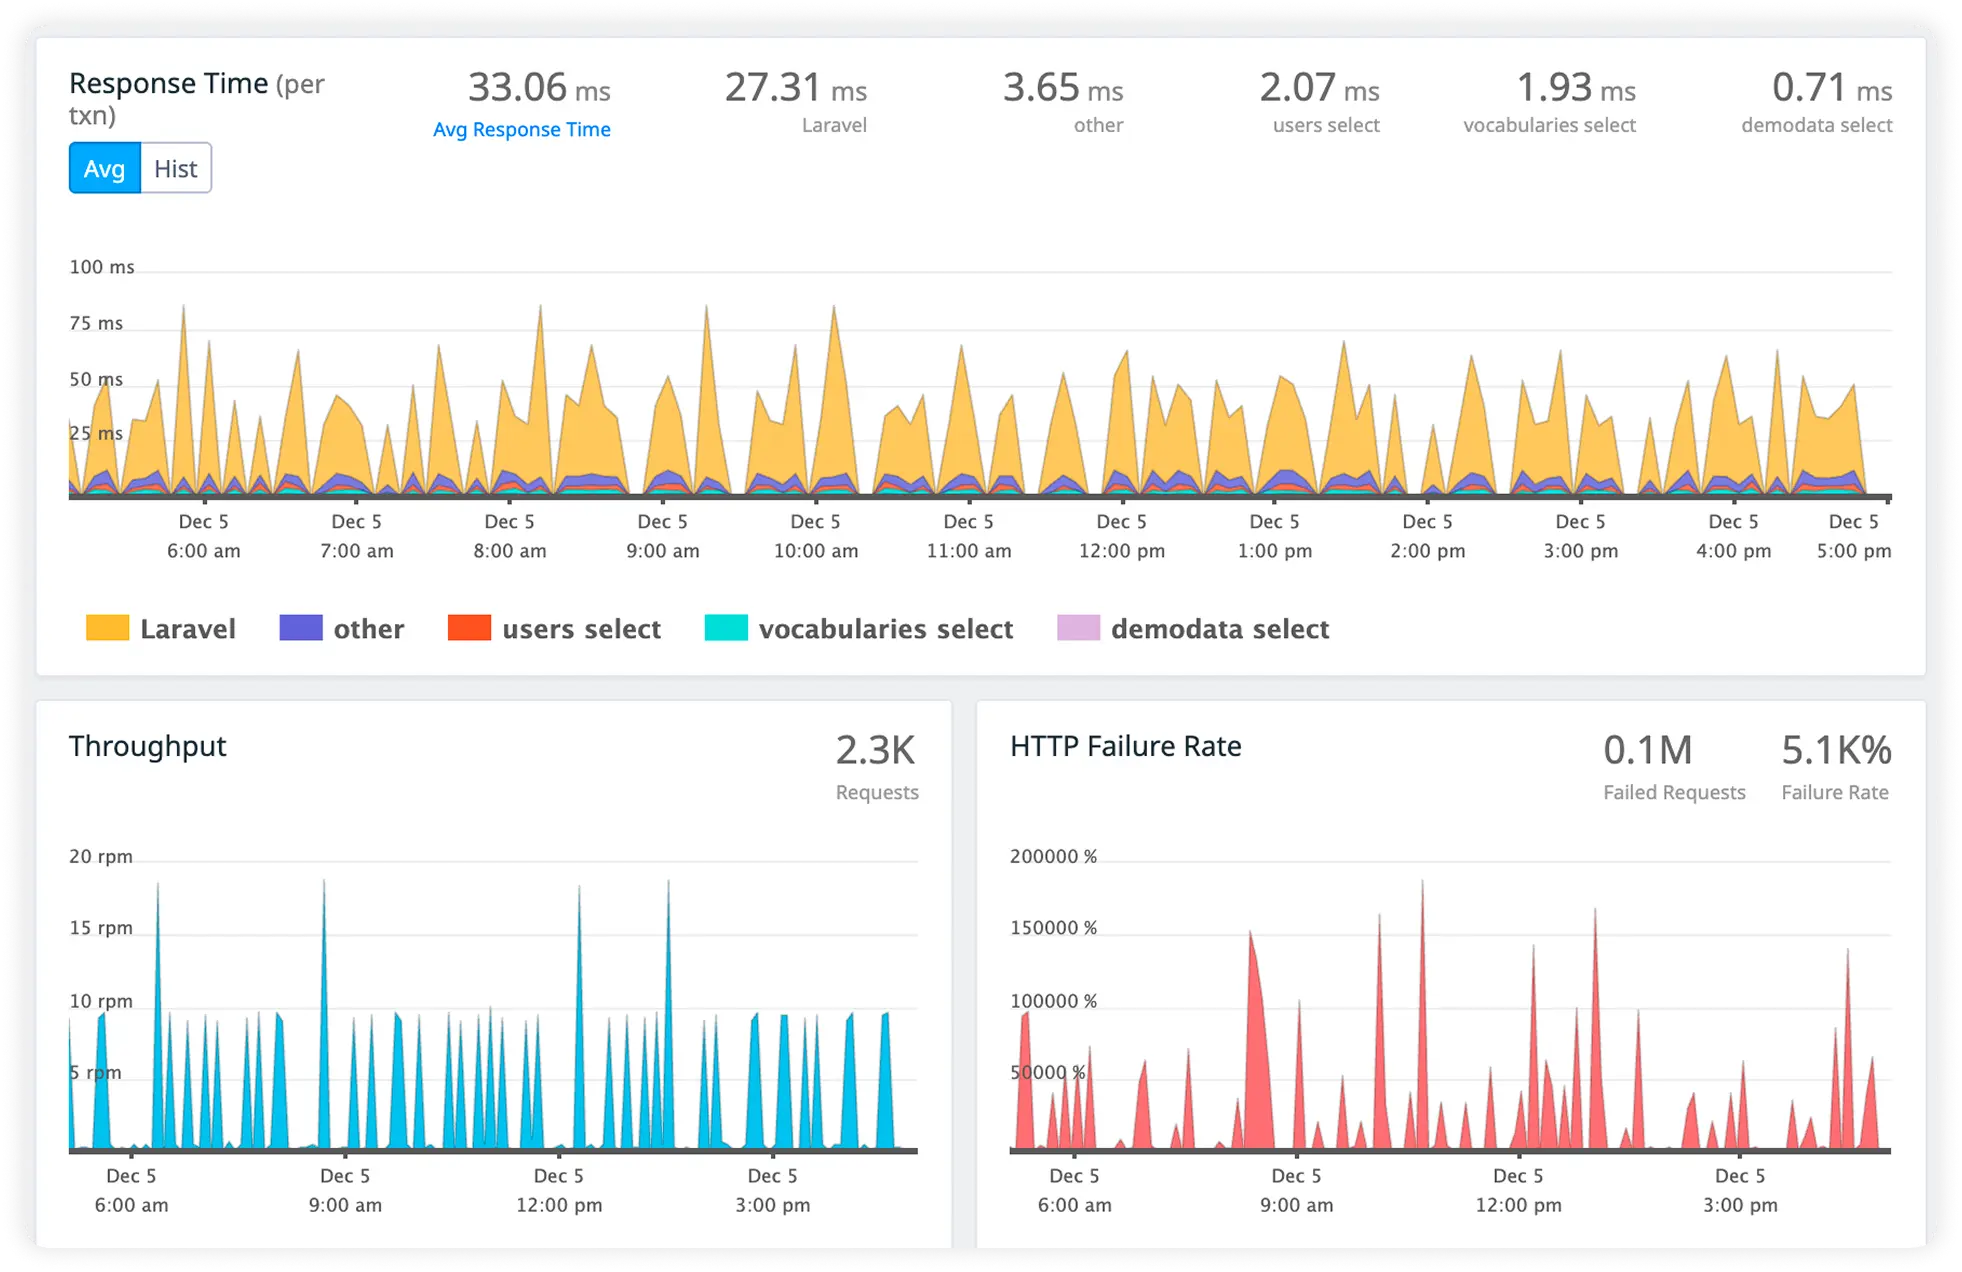
Analyze database query execution time and connection latency in real time. Eliminate inefficient database interactions slowing application performance.
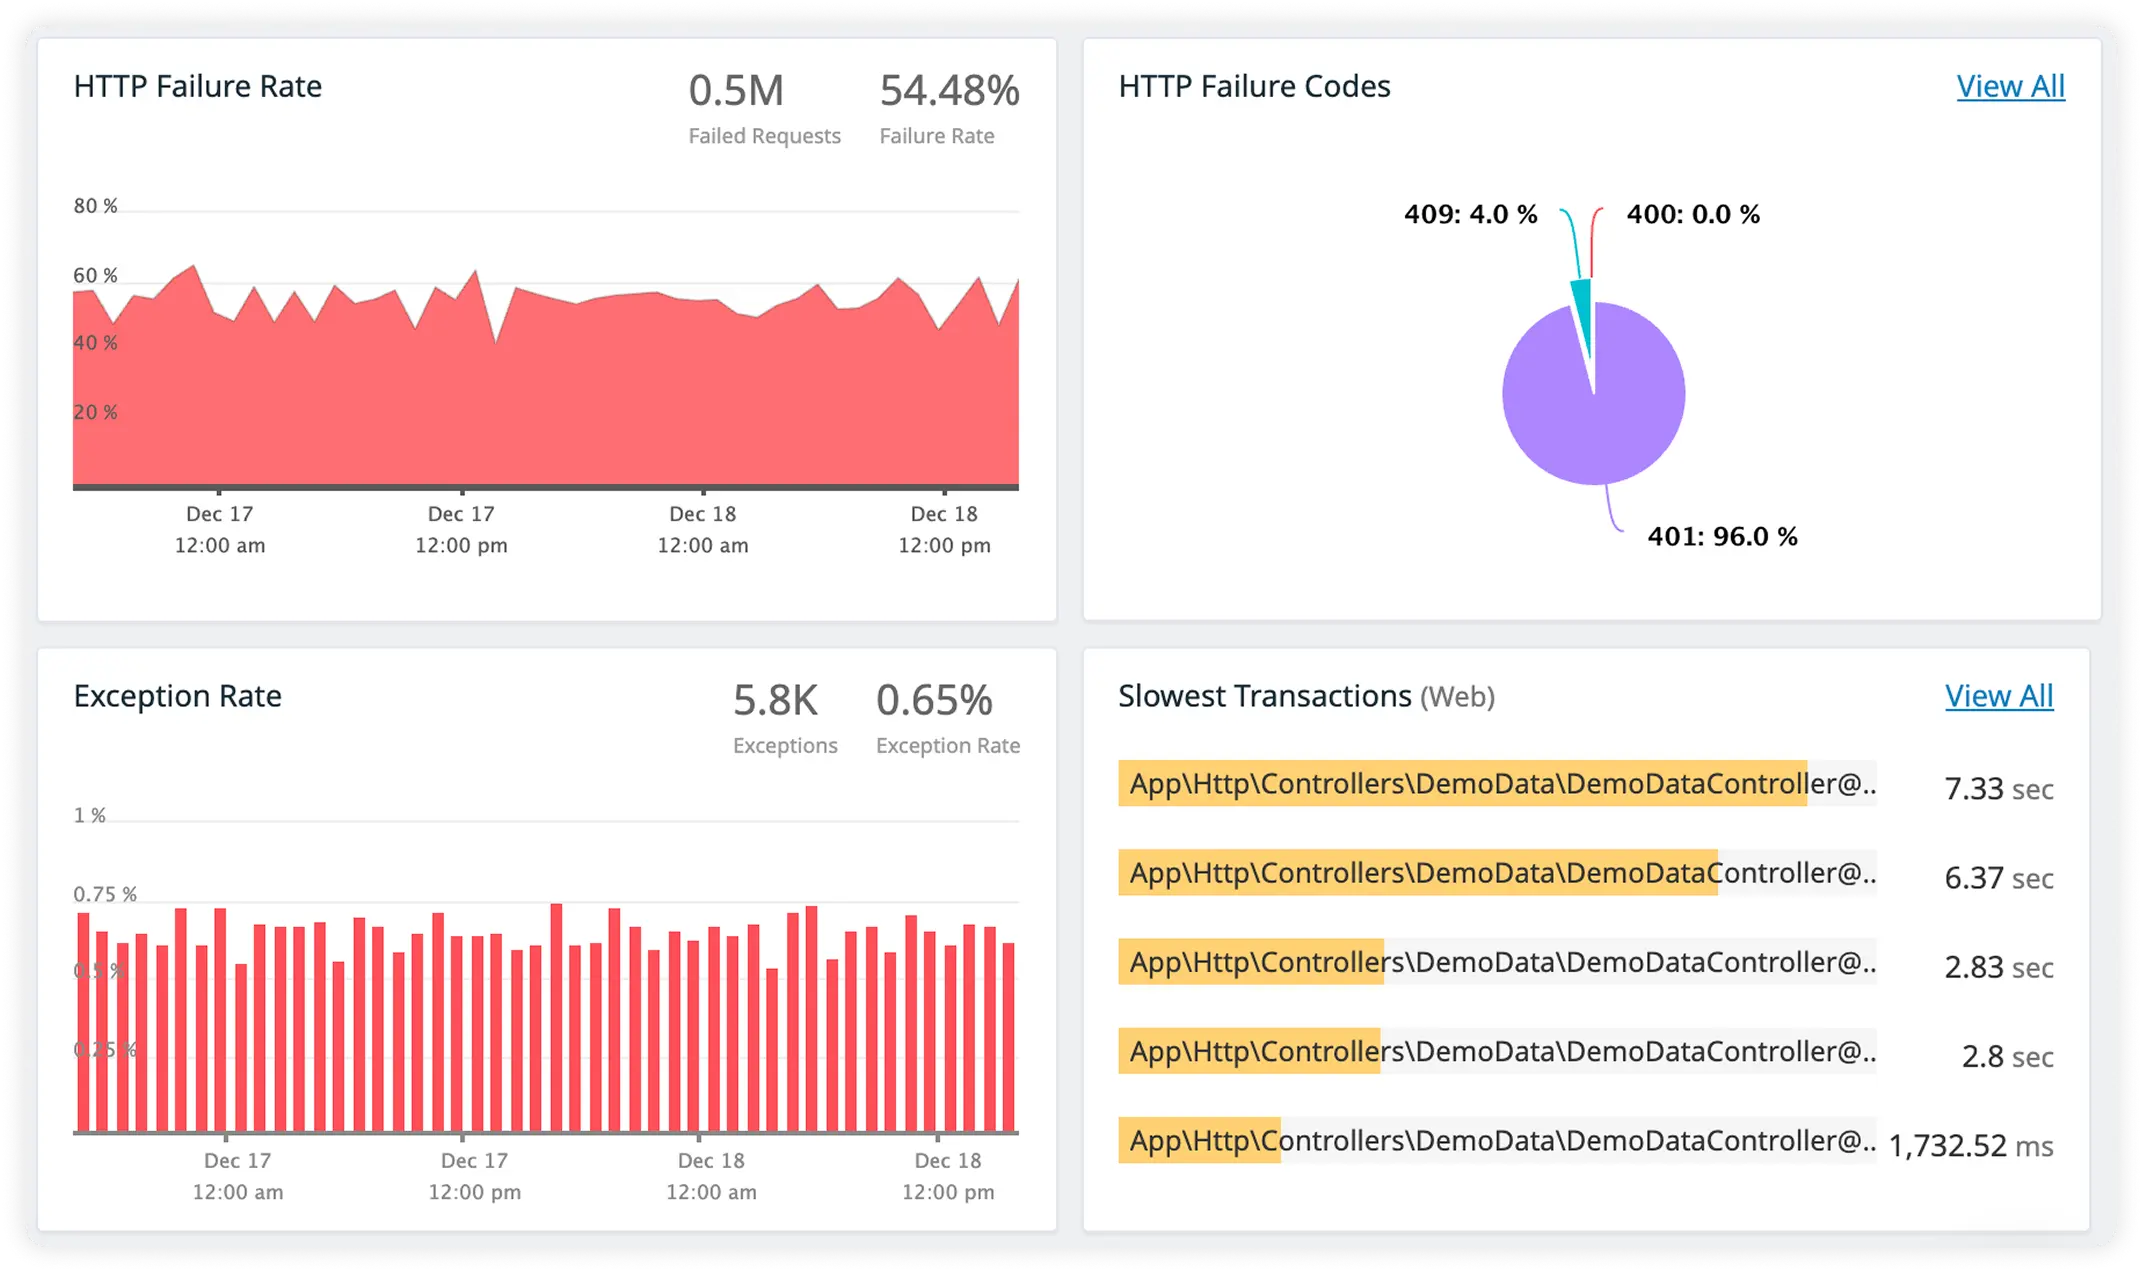
Track response times for external services while visualizing complete request flow across your application. Understand how dependencies impact overall performance.
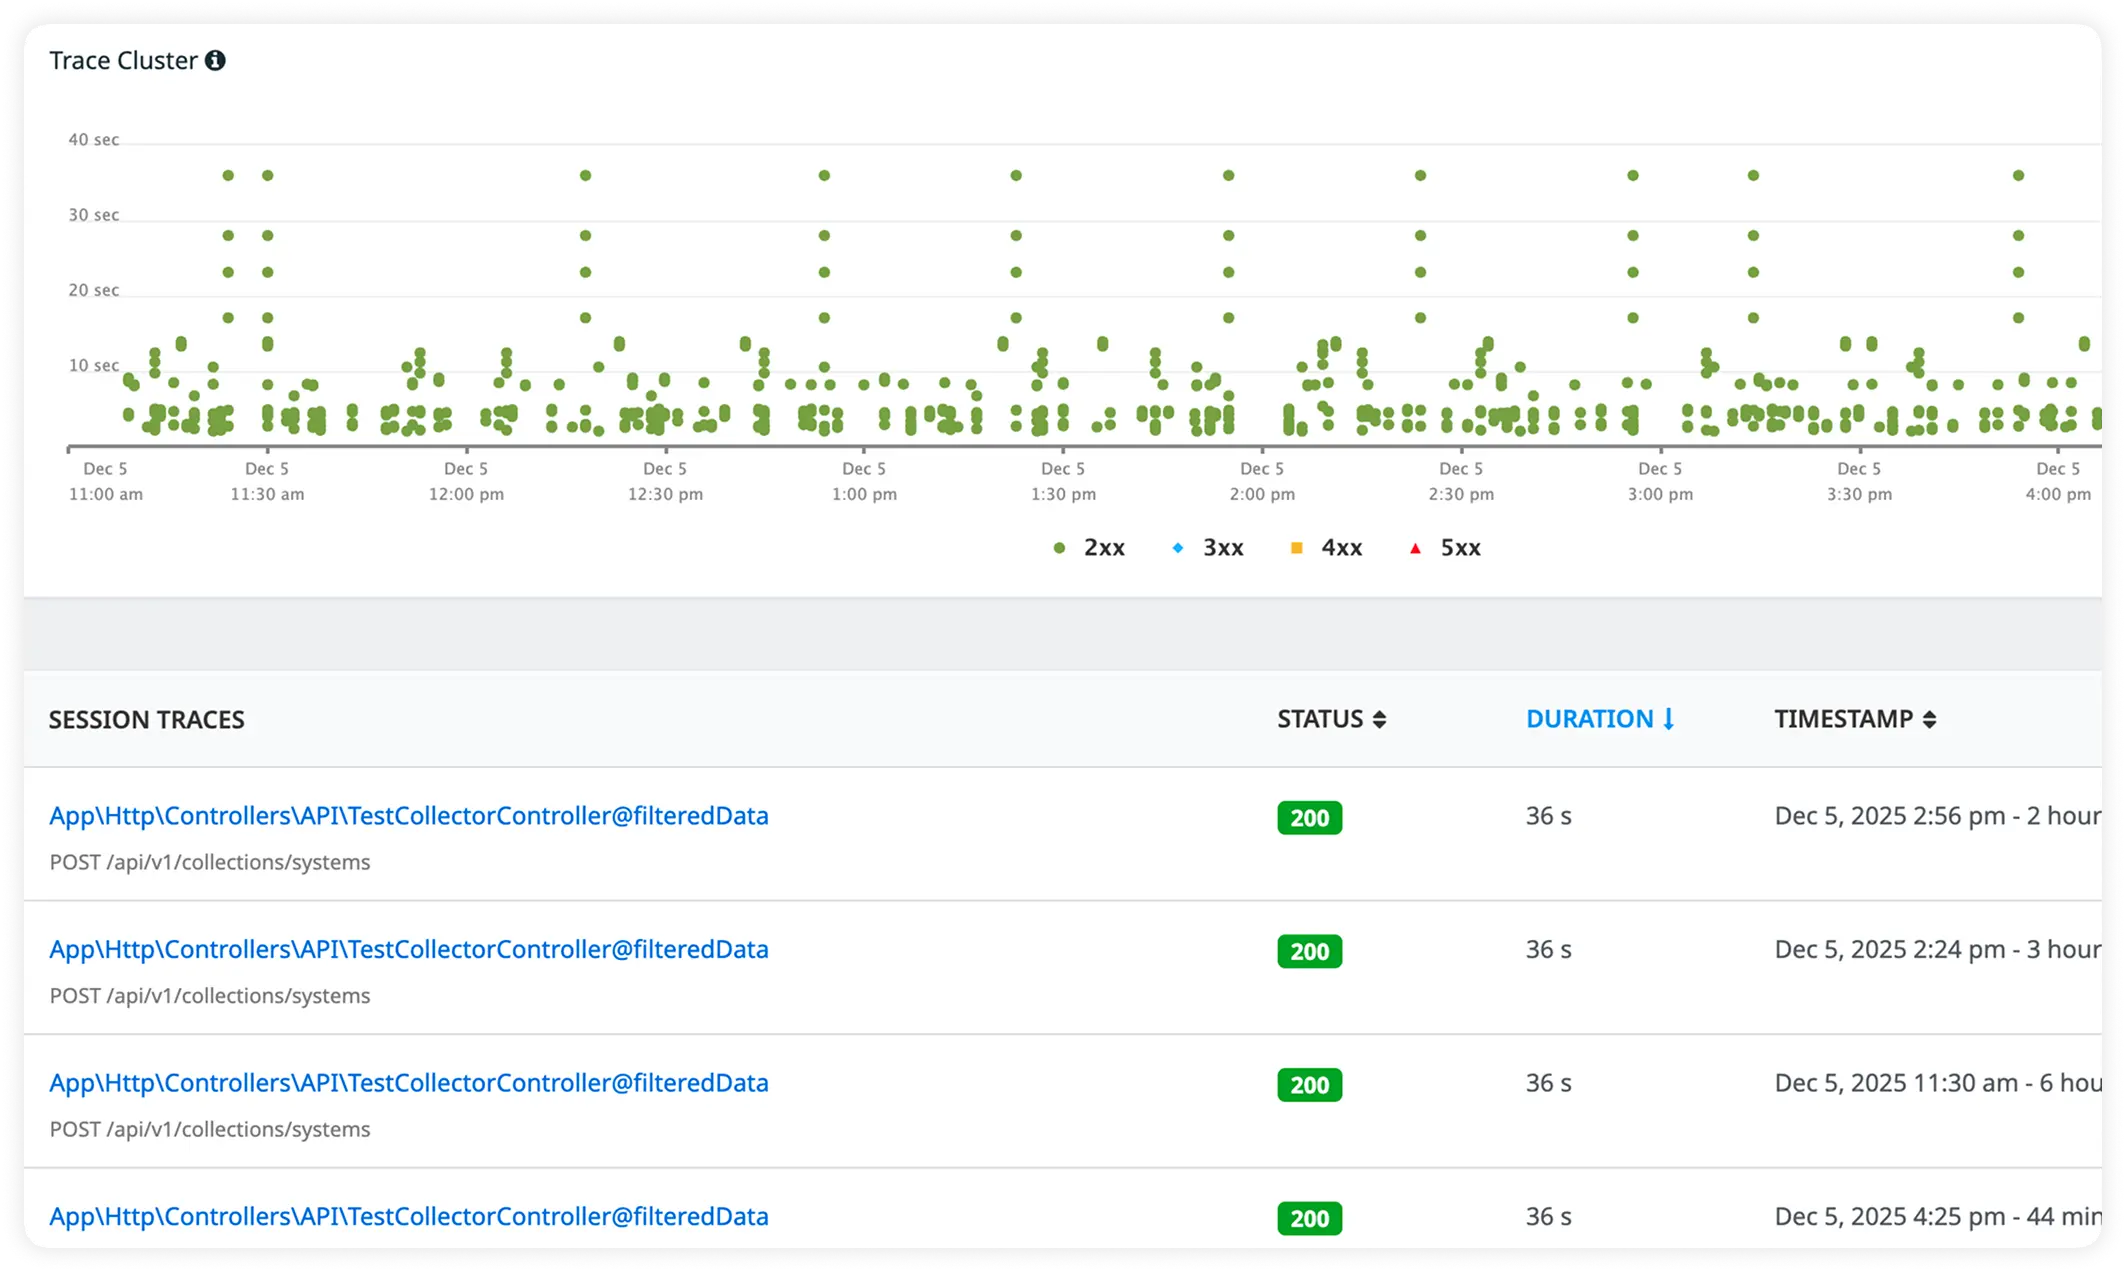
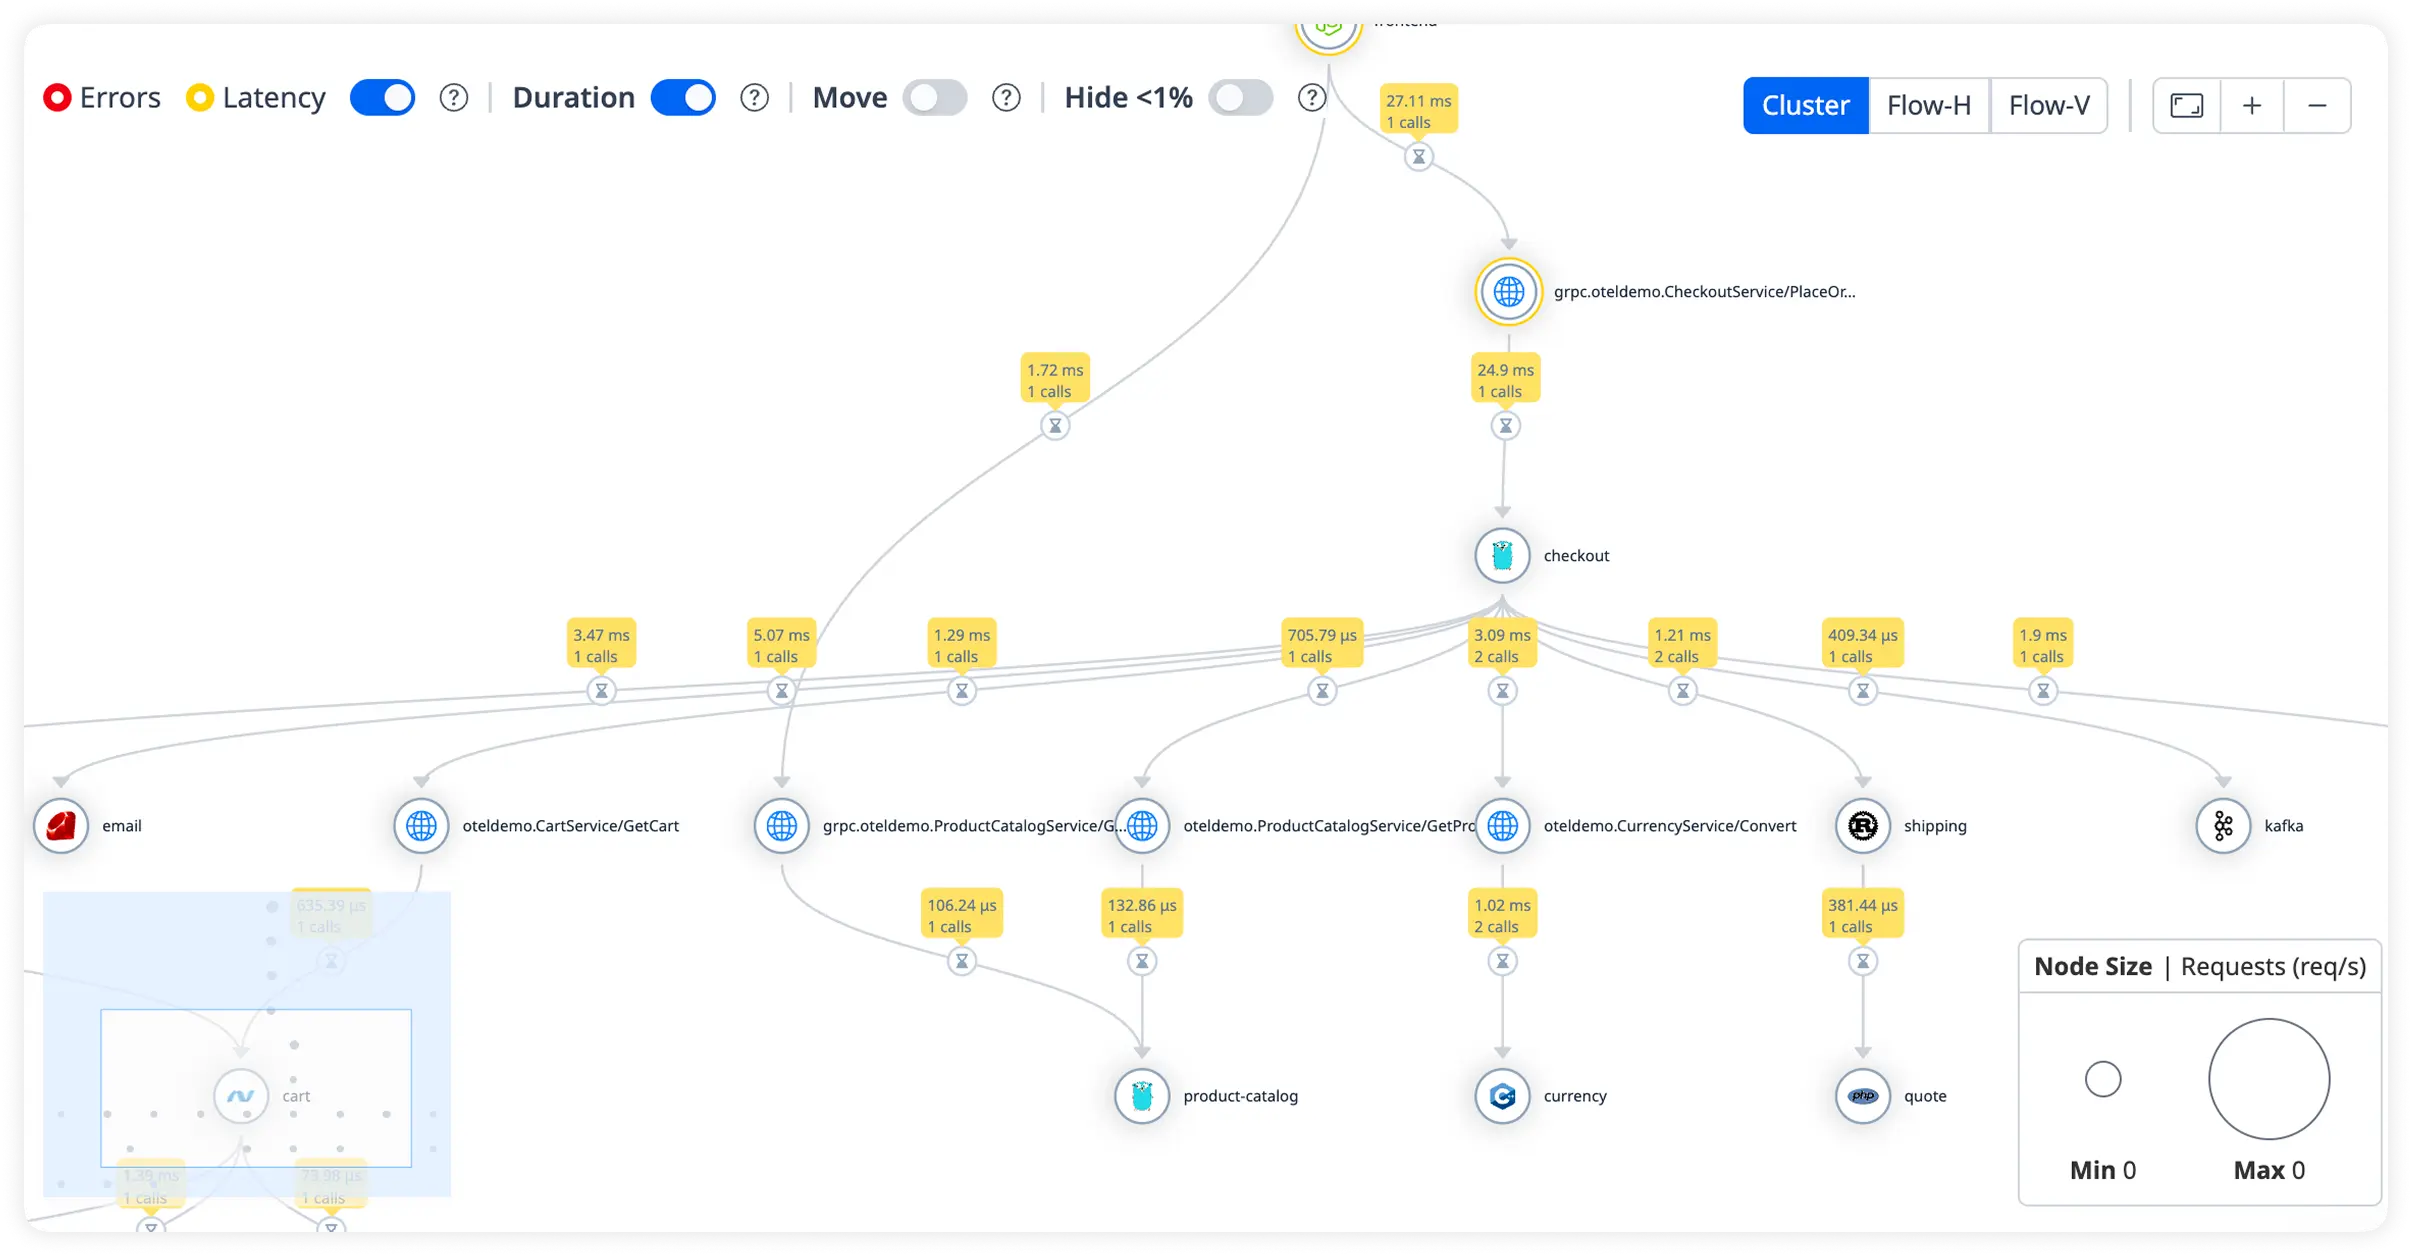
Grails teams converge on Atatus when framework abstraction, JVM behavior, and production scale demand dependable execution insight.
Engineers reason about actual runtime flow instead of inferred convention behavior.
Production signals become reliable early, reducing hesitation during incident response.
Teams interpret performance and failures with clear awareness of Grails and JVM interaction layers.
Debug workflows follow structured paths rather than individual intuition.
Incident response remains predictable even during cascading failures.
Backend, platform, and SRE teams operate from the same execution reality.
Engineers spend less time decoding abstractions and more time resolving issues.
Operational understanding remains intact as plugins, traffic, and services expand.
Teams retain confidence in runtime behavior as systems and ownership evolve.
Atatus adapts to how engineering teams work across development, operations, and reliability.
Debug errors and slow paths with the full context of what happened.
Atatus for developersTrack deployments and see how each release affects stability.
Atatus for DevOpsWatch latency and error rates to ship with less production risk.
Atatus for release engineersPricing, deployment, data and the agent. If something is missing, a person will answer it on a demo call.
The Grails performance monitoring tool helps developers to optimize the Grails server performance.
A good Grails APM solution answers the following two questions:
You can easily use application performance monitoring tools to answer, detect and resolve the above issues before they could impact the end users.
In general, there are two types of monitoring:
Every organization should have a well-implemented Grails APM solution, which allows DevOps teams (and the organization as a whole) to resolve issues and performance bottlenecks efficiently and reduce Mean Time To Resolution (MTTR). This has a substantial impact on the bottom line of the business.
Now organizations do not have to deal with the unnecessary work involved in maintaining an extensive software analysis group.
Your Grails performance monitoring tools should be easy to use, offer actionable insights, and be able to:
Technical Benefits:
Business Benefits:
With the help of the database monitoring, you can easily identify the database performance bottlenecks.


