A Guide to PostgreSQL Performance Tuning
PostgreSQL is the most powerful and versatile SQL database available today. There is a problem that comes with this level of power and versatility. How do the developers of PostgreSQL fine-tune the default configuration for everyone?
Well, they can't do it.

The issue is that each database differs not only in design but also in needs. Some systems are used to store massive amounts of data that are rarely searched. Others have essentially static data that is frequently searched, sometimes frantically.
Most systems, however, have some amount of reads and writes to the current database, which is frequently unequal. When you add this level of complexity to your unique table structure, data, and configure hardware, you can see why tuning is challenging.
The default PostgreSQL configuration is a rock-solid setup targeted at everyone's best guess at how an "average" database on "average" hardware should be set up. This tutorial is intended to assist all levels of PostgreSQL users in better understanding PostgreSQL performance tuning.
We will go over the following:
- Beefing up your PostgreSQL hardware
- Database Configuration
- Configuration Changes - PostgreSQL Performance Tuning
- Update Postgres Algorithm Data with ANALYZE
- Understand Your Query Performance
- Logs - PostgreSQL Performance Tuning Data
Introduction
We can improve the PostgreSQL performance by tuning the query and database performance-related parameters. We need to locate a slow and long-running query from the database using the pg_stat_activity catalog table to improve query performance; once we've found a slow query, we need to develop a query planner to explain it.
We must tune performance-related parameters such as shared_buffers, wal_buffers, effective_cache_size, work_mem, maintenance_work_mem, and synchronous_commit for improved database performance; we must change this value dependent on resources.
Setup and Best Practices
We'll go over how to change your basics of configuration for quicker PostgreSQL performance.
1. Beefing up your PostgreSQL hardware
There are a few things to consider while creating a PostgreSQL bare metal server. CPU, RAM, Disk, and network card in a small number of cases.
- CPU
Choosing the proper and high CPU for PostgreSQL performance could be critical. When dealing with huge amounts of data, CPU speed is important, but CPUs with larger L3 caches will also improve performance. Having more and faster cores will assist the operating system and PostgreSQL is more efficient in utilizing them for OLTP performance. - Disk
Choosing a faster drive set will greatly increase performance if the application is I/O bound (read and/or write-intensive). There are a variety of options, including NMVe and SSD drives. - Network Card
Even while network cards appear to be unrelated to PostgreSQL performance, as data expands rapidly, faster or bonded network cards will also speed up base backups. - RAM
The cheapest of the existing hardware, as well as the best for PostgreSQL performance. Operating systems aim to cache as much data as possible using the available memory. Less disk I/O and faster query times will result from more caching. When purchasing new hardware, we recommend starting with as much RAM as possible.
When it comes to hardware updates, keep the following in mind:
i. Updating Your Memory
Memory is used by your system to effectively cache data that it requires frequently. When you're optimizing your queries later, remember to keep your memory in mind. The larger your cache, the less your database will have to write to disk, which can slow things down.
PostgreSQL tries to keep the most frequently accessed data in memory to optimize performance based on how you run your queries and the configuration you provide.
ii. Separate Application and Database
On the subject of memory, if your database application is running on the same server as your application, you might want to consider isolating it. If a different component is affecting your metrics and environment, it will be impossible to truly examine and enhance your database performance.
2. Database Configuration
PostgreSQL includes a number of the default configuration. This default configuration is set up for compatibility and is essentially the best estimate that tries to accommodate all of PostgreSQL's possible use cases. Fortunately for you, this implies that tweaking the default configuration could result in some rapid wins.
Before we get to start PostgreSQL with some of the most frequent configuration improvements, it's worth noting that there are several PostgreSQL performance tuning tools available, such as PGTune, that attempt to do some of the configuration efforts for you. Their effectiveness varies, but it's worth testing the difference between these tools' output and your present database configuration.
In PostgreSQL, database configurations are made either directly in the configuration file (postgresql.conf) or by using the ALTER SYSTEM command. If you wish to see all of your database's current configurations right now, use the SHOW command:
SHOW ALL
This command displays a list of all existing configurations together with their settings. It's also worth noting that certain configurations will only apply under specific circumstances, such as a database restart. Some configuration changes will require a server restart, while others will require a configuration reload.
When you've made database configuration changes, execute the following command to discover details including if a restart is required for your configuration update:
SELECT * FROM pg_settings WHERE pending_restart = true;3. Configuration Changes - PostgreSQL Performance Tuning
To get the most out of your PostgreSQL database, you'll probably want to change a lot of different configurations. Let's go over some of the primary configurations you can tweak to improve your system performance.
i. max_connections
Your applications communicate with your database through connections. To establish each link, some communication and setup will be required. PostgreSQL queries can be sent down the wire to your database once the connection is established.
The number of connections in your PostgreSQL database is set by default, but you can change it. You want to ensure your applications aren't connecting needlessly, as this might be expensive and slow down performance. Since memory allocations are done per connection, you'll want to strike a balance between memory allocation and the number of connections.
ii. checkpoint_segments
A checkpoint is a routine action that records data about your system. A checkpoint is performed after a certain number of segments by default, but depending on your system, you may wish to increase this value. The default configuration is commonly believed to be excessively aggressive and executes checkpoints too frequently, thus you could want to increase this amount to reduce checkpoint frequency.
iii. work_mem
Memory allocation and management are key elements of PostgreSQL performance tuning. If your system does a lot of complicated sorting, boosting sort memory can assist the database in optimizing its configuration for your setup. Instead of making expensive disk calls, PostgreSQL can cache more data in memory during sorting.
iv. random_page_cost
This is simply the amount of time your optimizer should spend reading memory before accessing your disk. You should only change this setting after you've completed other plan-based optimizations, like vacuuming, indexing, or altering your queries and schema.
v. autovacuum_work_mem
When maintenance_work_mem is set to a large amount, auto vacuum workers will be able to use that much Memory each. Since a vacuum worker uses 6 bytes of memory for each dead tuple it wishes to clean up, an 8MB value will allow for roughly 1.4 million dead tuples.
vi. effective_io_concurrency
This value should be set to the number of disks needed to store the data for read-ahead during particular procedures. It was designed to help Postgres understand how many reads would likely occur in parallel when using striped RAID arrays of spinning disks, but using a multiple of that number has shown to improve performance, likely because good quality RAID adaptors can re-order and pipeline requests for efficiency.
vii. shared_buffers
The simplest way to improve the performance of your database server is to edit this parameter. For most modern hardware, the default is quite low. According to conventional thinking, this should be set to approximately 25% of the system's available RAM. Like most of the options, I'll discuss, you'll need to experiment with them at various levels (both up and down) to discover how well they perform on your system. Most individuals find that increasing it beyond a third degrades performance.
viii. max_fsm_pages
This option aids in the management of the free space map. When you delete something from a table, it isn't immediately gone from the disk; instead, it is recorded as "free" in the free space map. The space can then be utilized for any future INSERTs on the table. If your system has a lot of DELETEs and INSERTs, this value may need to be increased to minimize table bloat.
ix. fsync
This option controls whether or not all of your WAL pages are fsync()'d to disk before a transaction is committed. This is safer, but it can slow down writing performance. There is a risk of unrecoverable data corruption if fsync is not enabled.
These options work together to increase performance by printing out numerous transactions that commit at the same time. If there are more than commit siblings backends active at the time your transaction is committing, the server will wait to commit delay microseconds to try to commit multiple transactions at the same time.
Analyzing PostgreSQL Performance
PostgreSQL performance enhancements will be limited by the system configuration. Although you can undertake some setup ahead of time, the data and analysis you have of your system will drive a lot of your configuration decisions.
You should optimize the way it's set up, understand how it's searched, and optimize based on these use cases. For making these PostgreSQL optimizations, PostgreSQL and the community provide some useful tools.
4. Update Postgres Algorithm Data with ANALYZE
Before we go any further, it's vital to understand how a query works. From the first request to the database through the response it sends, the life cycle is what happens. PostgreSQL doesn't just reach for a large bag of memory.
When you have a lot of data, a simple data fetch can cause performance issues. If you scan your database sequentially for data (also known as a table scan), your performance will grow linearly as the number of rows increases. We can, however, do better.
So, what is a query's life cycle?

There is an initial transfer of the query string to PostgreSQL. After that, the query string is parsed and a plan is formed. Plans are quite crucial. PostgreSQL's plans are the steps it will take to locate requested data. The performance of these plans is influenced by how you set up your database settings, structure, and indexes.
As a result, it will be critical that we comprehend plans and how to optimize them. The database will then execute the plan and obtain the data.
There may be a difference between the database plan PostgreSQL wants to use and the method it pulls your data. This is because PostgreSQL's strategy is based on metrics and statistics that are rarely updated. Some data must be updated regularly to keep the statistics used in the plan current.
ANALYZE comes in handy here. The ANALYZE command refreshes these statistics, giving Postgres a new set of information on how to make plans.
If you're changing the tables or schema or adding indexes, remember to perform an ANALYZE command afterward to ensure the changes are applied.
5. Understand Your Query Performance
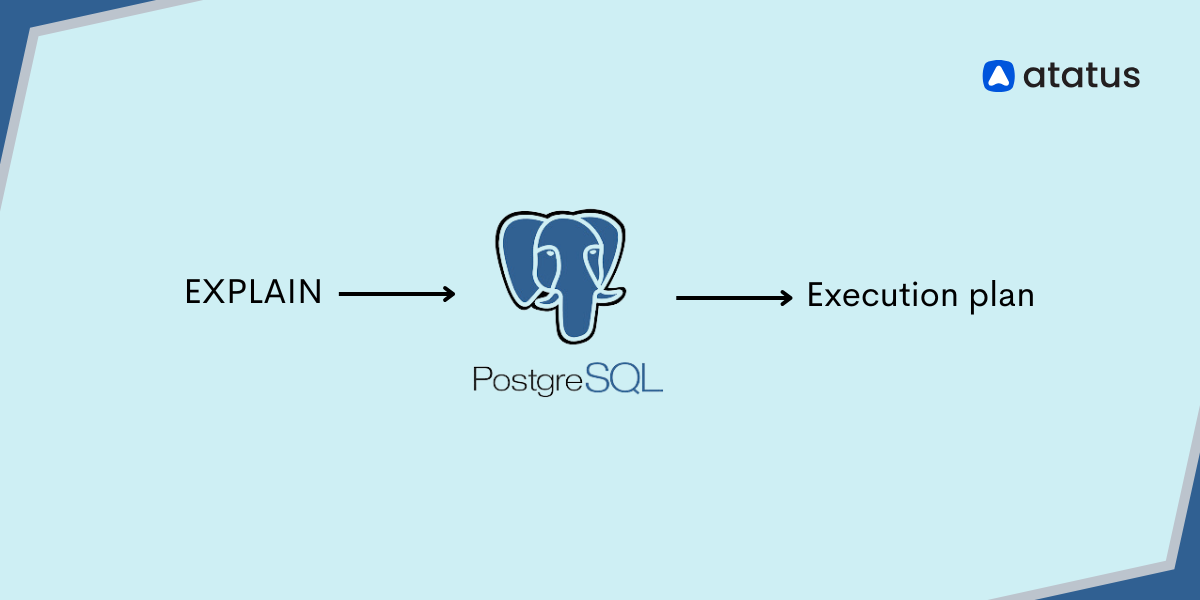
Query optimization is one of the next obvious places to look. Because the PostgreSQL queries you're performing could be inefficient for a variety of reasons, we'll need a mechanism to figure out what's going on, which is where the EXPLAIN command comes in.
EXPLAIN provides a detailed explanation of how PostgreSQL will handle your query. The plan is based on table statistics and considers things like database indexes to determine the most efficient path to your data.
However, EXPLAIN will only make guesses and offer you a solution that it believes will work. You can use EXPLAIN ANALYZE to acquire information about the projected plan as well as an update on the PostgreSQL query performance.
After you've figured out what the database is trying to accomplish, you can start analyzing it. PEV, for example, allows you to visualize and understand the output of your EXPLAIN command, which makes life easier.
6. Logs - PostgreSQL Performance Tuning Data
Let's pretend you have a running database and you're trying to figure out why your application is slow. Logs are one method of accomplishing this. When an application acts, it leaves behind a log of short information statements. To gain a picture of how the system is operating, you can collect these actions and analyze them in a log management tool like Atatus.
Your application does not log all data by default. This is because increased logging has an impact on database performance. So, while we go over how to adjust log settings to examine performance, keep in mind that the log settings themselves can have an impact.
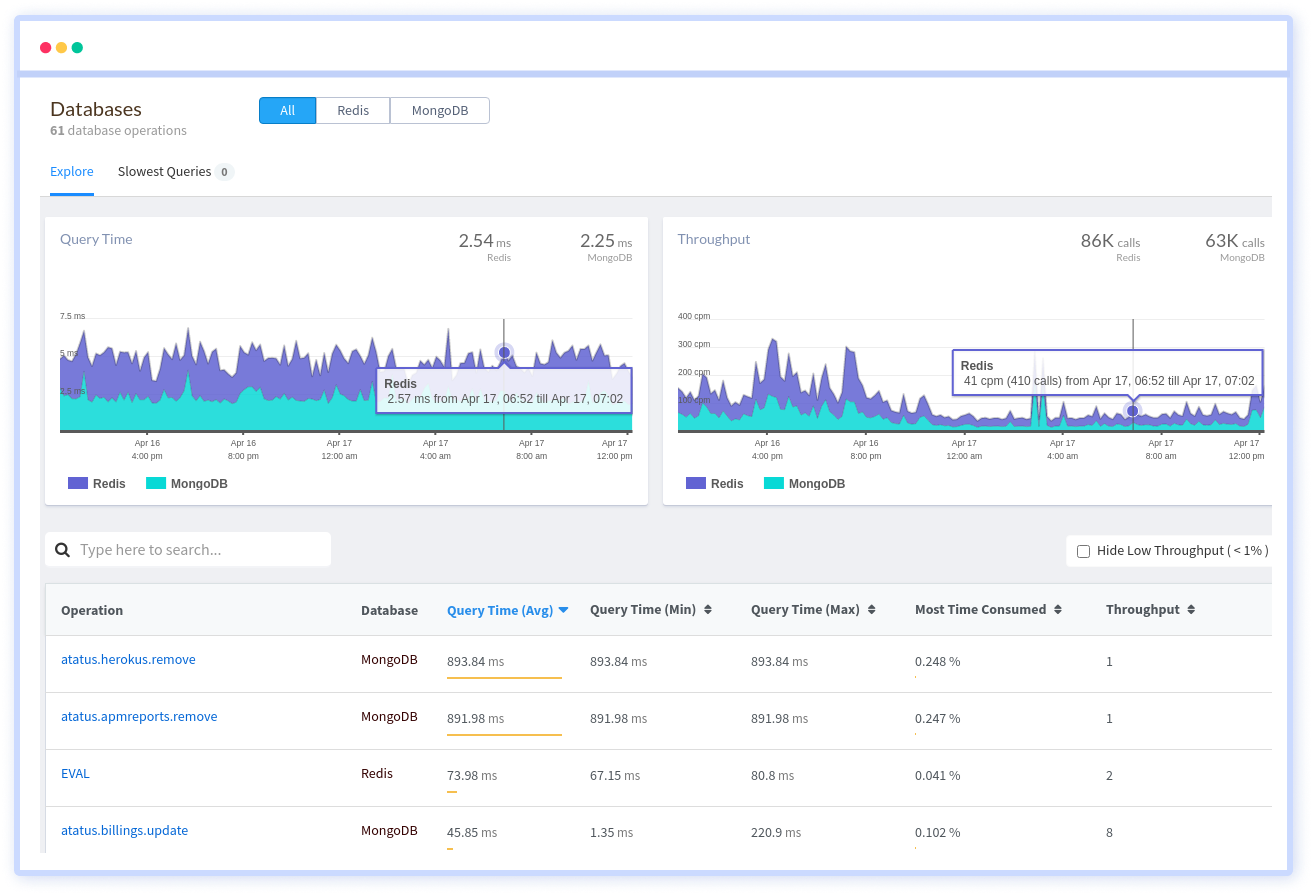
Depending on your configuration, logs are written to a temporary file on your system. When you've figured out where your logs are, you can analyze them with a tool like Atatus.
Atatus will provide statistics such as the most frequently executed queries, average query time, and so on. These aggregate metrics might help you figure out where you might have performance bottlenecks in your system.
So, now that we know how useful logs are for analyzing system performance, how do we set them up or change them?
- log_line_prefix
Your database logs will be in this format. Tools like PGBadger will require rich data as well as knowledge of the data type. Your log_line_prefix instructs PostgreSQL on how to format its log data. You'll need to set this value to be compatible with the tooling you're using to analyze your logs if you want to do any meaningful log analysis. - log_statement
This is the degree of logging you're using. The level of detail you want in your logs is commonly referred to as log levels. There are several options for log_statement, including ddl (which solely records database structure changes), mod (which records changes to existing data), and all (which logs … everything). - log_checkpoints
Checkpoints in PostgreSQL are periodic activities that store data about your system, as we described in the configuration settings. Excessive use of log checkpoints can result in performance degradation. If you suspect this is the case, enable log checkpoints to get detailed information about the checkpoints, including how often they run and what might be triggering them. - logging_connection
You might also be interested in knowing about links. Something could be wrong if you just have one application connected to your database, but you notice a lot of concurrent connections. Too many connections flooding your database can cause requests to fail to reach the database, causing problems for your application's end users.
Conclusion
More characteristics can be tweaked to improve performance, although they have a smaller impact than the ones mentioned above. Finally, we must remember that not all metrics are significant for all types of applications. Some applications benefit from parameter adjustment, while others do not. Tuning PostgreSQL Database Parameters is necessary for the specific needs of an application and the operating system on which it operates.
Monitor Your Database with Atatus
Atatus provides you an in-depth perspective of your database performance by uncovering slow database queries that occur within your requests, as well as transaction traces, to give you actionable performance insights. With normalized queries, you can see a list of all slow SQL calls to see which tables and operations have the most impact, know exactly which function was used and when it was performed, and see if your modifications improve performance over time.
Atatus can be beneficial to your business, which provides a comprehensive view of your application, including how it works, where performance bottlenecks exist, which users are most impacted, and which errors break your code for your frontend, backend, and infrastructure.
#1 Solution for Logs, Traces & Metrics
![]() APM
APM
![]() Kubernetes
Kubernetes
![]() Logs
Logs
![]() Synthetics
Synthetics
![]() RUM
RUM
![]() Serverless
Serverless
![]() Security
Security
![]() More
More