An Ultimate Guide to Node.js Logging in 2025

Logging helps developers in reducing errors and cyber-attacks. The application is designed to be dynamic. We can't always predict how an application will react to data changes, errors, or program changes. Logging in allows us to better understand our own programs.
For all applications, an absolute logging solution is essential. A good logging system increases the application's stability and makes it easier to maintain on the production server. Application logging is the process of gathering information about your program's execution time.
When a user has an issue, you have no way of knowing what went wrong. You can only hope to contact the user who had the issue and have them tell you what happened.
As you can see, this is a bad strategy. This article focuses on some of the most important aspects of Node.js logging:
- What is Log?
- Why Logging is Important?
- Log Levels
- Where should I Log?
- Best Practices for Node.js Logging
What is Log?
Logs are events that reflect many characteristics of your application; if created correctly by the team, they are the simplest means of troubleshooting and diagnosing your application.
Debugging is done with logs by operations engineers and developers. Logs are used by product managers and UX designers to plan and develop. Marketers want to know how well various components related to advertising campaigns are doing.
Anyone with a stake in the company can benefit from the information provided by logs. However, you won't appreciate the worth of your logs until they've been properly evaluated. And in order to do so, we'll need to keep track of the correct data.
Why Logging is Important?
Previously, logging was seen as a low-priority task. People did not put forth much effort into creating significant logs. Logs, on the other hand, have become a useful piece of information as a result of technological advancements in machine learning and artificial intelligence.
Logs can be used to analyse user behaviour and the application's general health. It analyses the major components of your application to improve performance. Measures crucial metrics including the number of errors or warnings logged, as well as your application's overall availability.
Furthermore, logs assist you in comprehending what is occurring within your application. What happened is documented in your logs. This data is helpful if something goes wrong and you need to troubleshoot an issue. As a developer, the first thing you should do is look through the logs to determine what happened leading up to the issue. You'll be able to see exactly what actions lead to the problem if you do it this way.
When debugging your application, logs are quite useful. Additionally, technical advances such as trend analysis enable your company to spot anomalies by examining logs, allowing it to go from reactive to proactive monitoring. You can limit the number of errors since you can correct them before they affect the user.
Log Levels
One of the best practices for efficient application logging is to use the right log level. The priority of communication is indicated by its log level. Each level is represented by an integer.
RFC5424 specifies the severity of logging levels. A decimal severity level indicator is included with each message priority. These, along with their numerical values, are included in the table below. The severity values must be between 0 and 7, inclusive.
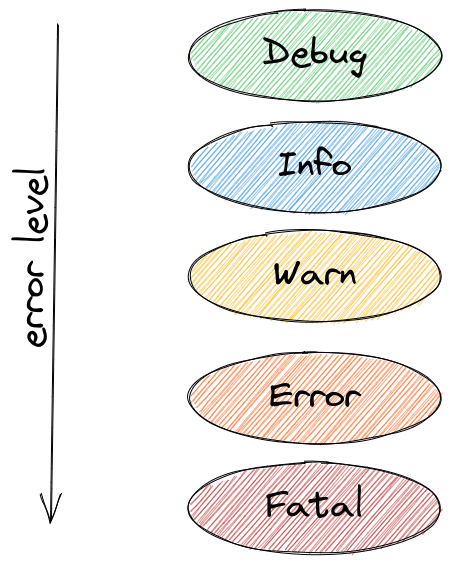
- Code 0 (Emergency): the system is unusable
- Code 1 (Alert): action must be taken immediately
- Code 2 (Critical): critical conditions
- Code 3 (Error): error conditions
- Code 4 (Warning): warning conditions
- Code 5 (Notice): normal but significant condition
- Code 6 (Informational): informational messages
- Code 7 (Debug): debug-level messages
Each log level indicates the importance and urgency of the message in general. Let's take a look at the most significant levels and how they're used:
- ERROR
Something went wrong, and it needs to be looked at right away. For example, if the database is down, or if communication with other microservices has failed, or if the required input is unknown. System operators and monitoring systems are the key target audiences. - WARNING
These logs are warnings that do not prevent the application from continuing; they serve as notifications when something goes wrong and a workaround is used. For example, incorrect user input, retries, and so on. These warnings should be fixed by the administrators in the future. - INFORMATIONAL
Some critical messages, such as event messages that indicate when a task is completed. Consider the following scenario: "New User created with id xyz". This is the only way to keep track of progress logs. - DEBUG
This level is for developers; it's akin to logging the information you see while using a debugger or a breakpoint, such as which function was called and which parameters were supplied, and so on. It should have the current condition so that debugging and pinpointing the issue is easier.
A developer should be able to look at a detailed event and assess whether it needs to be fixed right away.
Where should I Log?
An event source pattern is an excellent example of loose coupling. An event source pattern is frequently used in a microservices architecture. It consists of a number of services that place events on a bus or in a line. Independent processes “listening” to the queue can reply to those events.
Log events are different kinds of events that can be queued. Multiple listeners can each listen to the queue and write to their own log. With this level of adaptability comes an increased level of complexity. We frequently only register a single logger to the log call. There are several options, but anything we use for logging must be able to handle the volume of log messages.
Some of the most common log locations are listed here.
1. console or stdout/stderr
The basic console.log and console.info functions in Node.js will log to stdout. stderr is where console.warn and console.error are written. These will print the output to your console by default. This will be the developer tools console on the front end. This is generally sufficient for running your Node.js backend locally.
2. Log File
If you've already used the console everywhere, you can route stdout and stderr to a file without touching your code. This is accomplished by using the standard redirect when launching your application:
node project.js > project.log 2>&1This will send stdout to a file named project.log and stderr to stdout.
When would you use a file to log to?
In most cases, logging to persistent storage is preferable in production. The simplest approach to store logs is in a file. It isn't, however, the finest long-term option.
You might wish to log into your file system when you're running locally. When you have numerous processes running at the same time, this can be useful. It's possible that they're in distinct containers.
When you have a process that spans numerous processes, such as a workflow, you'll want to bring all the logs together in either case. It will make the analysis go more smoothly. You don't want to have to switch back and forth between different log outputs to connect the dots.
The ideal way to log-structured events is to send them to a log management tool. Structured logging makes data easier to correlate, find patterns, and use. Querying the data is more efficient when the logs are stored in a centralized logging database - specifically, one designed for the purpose.
Here are some log management tools that we suggest for logging:
- Atatus
- Loggly
- PaperTrail
- Sumo Logic
- Splunk
- GrayLog
- LogDNA
Best Practices for Node.js Logging
Node.js logging can be done in a variety of ways. To improve logging, we can use the built-in features or one of the many popular packages. The best method for logging is to pipe stdout and stderr to your desired log destination. Because debug, the main logger in node js, writes directly to process.stdout and process.stderr, this is the case.
We'll go over the most successful techniques as part of Node.js logging best practices in the sections below.
#1 Begin with console.log
Console.log is the original node.js logging technique. console.error, console.info, and console.warn are some of the versions. Those are just extra methods on top of the main function, which is:
console.log(level, message)You can write to console.log, but outside the code, you have limited control over where things log.
If you run console.log, you may notice a slight slowdown in performance. When your project grows larger, I recommend moving to a logging library to avoid performance issues.
#2 Move to Log Library
Logging libraries assist developers in creating and managing log events, which can improve your application's overall efficiency and effectiveness. Winston, Bunyan, and Log4js are three of the most popular logging libraries for Node.
Comparison of Logging Libraries
We'll go through the most significant features of three logging libraries in this section: Winston, Bunyan, and Log4js.
- Winston Logging
Winston is a universal logging library that allows logs to be stored in several locations. It lets you store certain log levels in a remote location. The remaining logs can be saved somewhere else, such as a database. This handy feature lets you send higher-level logs to a log aggregation tool while storing lower-level logs in a database or file storage. - Bunyan Logging
Bunyan is also a logging library with a lot of features. Bunyan, like Winston, allows you to customize your transportation options. - Log4js Logging
Log4js is a fork of the well-known Java logger Log4j. The package isn't as well-known as Winston or Bunyan, but it still has some unique features. Developers can use Log4js to log to the console, a file, or a log aggregator through a TCP connection.
Winston may be the ideal option if you wish to store your error log in a distant place or separate database because it supports multiple modes of transport. Bunyan also has a CLI for filtering and supports several modes of transport. Alternatively, Log4js offers log streams and log aggregators, such as logging to a console.
Here's an example of how to use Winston to build up a logging library:
const winston = require('winston');
const config = require('./config');
const enumerateErrorFormat = winston.format((info) => {
    if (info instanceof Error) {
        Object.assign(info, {
            message: info.stack
        });
    }
    return info;
});
const logger = winston.createLogger({
    level: config.env === 'development' ? 'debug' : 'info',
    format: winston.format.combine(
        enumerateErrorFormat(),
        config.env === 'development' ? winston.format.colorize() : winston.format.uncolorize(),
        winston.format.splat(),
        winston.format.printf(({
            level,
            message
        }) => `${level}: ${message}`)
    ),
    transports: [
        new winston.transports.Console({
            stderrLevels: ['error'],
        }),
    ],
});
module.exports = logger;
The point is that, while a standard console.log should nearly always be used, a logging library can be more useful and helps avoid application performance degradation.
#3 Log HTTP Requests with Morgan
Logging your HTTP request in your Node.js application is another great practice. Morgan node.js tool is one of the most popular tools for doing so, as it takes the server logs and organizes them to make them more readable.
To use Morgan, simply type the following into the format string:
morgan = require('morgan');
app.use(morgan('dev'));
Configure Winston with Morgan
If you prefer to use the Winston library, Morgan makes it simple to set up:
const morgan = require('morgan');
const config = require('./config');
const logger = require('./logger');
morgan.token('message', (req, res) => res.locals.errorMessage || '');
const getIpFormat = () => (config.env === 'production' ? ':remote-addr - ' : '');
const successResponseFormat = `${getIpFormat()}:method :url :status - :response-time ms`;
const errorResponseFormat = `${getIpFormat()}:method :url :status - :response-time ms - message: :message`;
const successHandler = morgan(successResponseFormat, {
    skip: (req, res) => res.statusCode >= 400,
    stream: {
        write: (message) => logger.info(message.trim())
    },
});
const errorHandler = morgan(errorResponseFormat, {
    skip: (req, res) => res.statusCode < 400,
    stream: {
        write: (message) => logger.error(message.trim())
    },
});
module.exports = {
    successHandler,
    errorHandler,
};
To configure Winston with Morgan, simply set up Winston to transmit the output of Morgan back to it, as shown in the example above.
#4 Define Log Level
It's critical to specify your log levels before starting a build with your development team so that you can distinguish between log events. It's easier to gather important information at a glance when log events are managed in an ordered and consistent manner.
It's essential that everyone in the team agrees on when to utilize which log level. A WARNING level, for example, could be assigned to a failed login attempt. A failed login attempt, on the other hand, could indicate that something is wrong or that someone is attempting to break into an account.
You can lose out on vital information in your production environment if your team uses multiple log levels for similar events.
Additionally, decide on a specific log style format. In every log message, you might want to add the user ID. Before you begin creating your code, define these standards. It's easier to study logs when they're in a standard format.
#5 Server Logs
Server logs are a crucial component of application monitoring. Whatever hosting environment you use, you must keep a watch on this. Sending all of the data to a single location is the optimal solution. Application logs, database logs, and server logs should all be viewed together because they all have an influence on your users.
Let's not forget about the network. Although most of us have little influence over the network, it's worth examining how you might log network concerns. Errors can sometimes be traced back to the network. We can chase our tails seeking a cause after an incident if we don't have insight into network issues.
Conclusion
While no infrastructure is perfectly secure or error-free, logging is an essential step for developers who wish to keep an eye on production and reduce errors. Other team members, such as QA, Support, and new programmers, can benefit from logging because it saves critical information to learn from and grow on.
Node.js logging is an important part of any node.js application's process. Almost everyone involved in the application is affected by Node.js logging. Logs are essential to the feedback loop that promotes success, from users to executives to designers and engineers. We should keep track of everything, from minor details to major events.
Atatus Log Monitoring and Management
Atatus is delivered as a fully managed cloud service with minimal setup at any scale that requires no maintenance. It monitors logs from all of your systems and applications into a centralized and easy-to-navigate user interface, allowing you to troubleshoot faster.

We give a cost-effective, scalable method to centralized node.js logging, so you can obtain total insight across your complex architecture. To cut through the noise and focus on the key events that matter, you can search the logs by hostname, service, source, messages, and more. When you can correlate log events with Application Performance Monitoring(APM) slow traces and errors, troubleshooting becomes easy.
#1 Solution for Logs, Traces & Metrics
![]() APM
APM
![]() Kubernetes
Kubernetes
![]() Logs
Logs
![]() Synthetics
Synthetics
![]() RUM
RUM
![]() Serverless
Serverless
![]() Security
Security
![]() More
More

![New Relic vs Splunk - In-depth Comparison [2025]](/blog/content/images/size/w960/2024/10/Datadog-vs-sentry--19-.png)
![Splunk vs Prometheus: A Side-by-Side Comparison [2025 Guide]](/blog/content/images/size/w960/2024/08/Datadog-vs-sentry--13-.png)