Apache Logs - Turning Data into Insights!
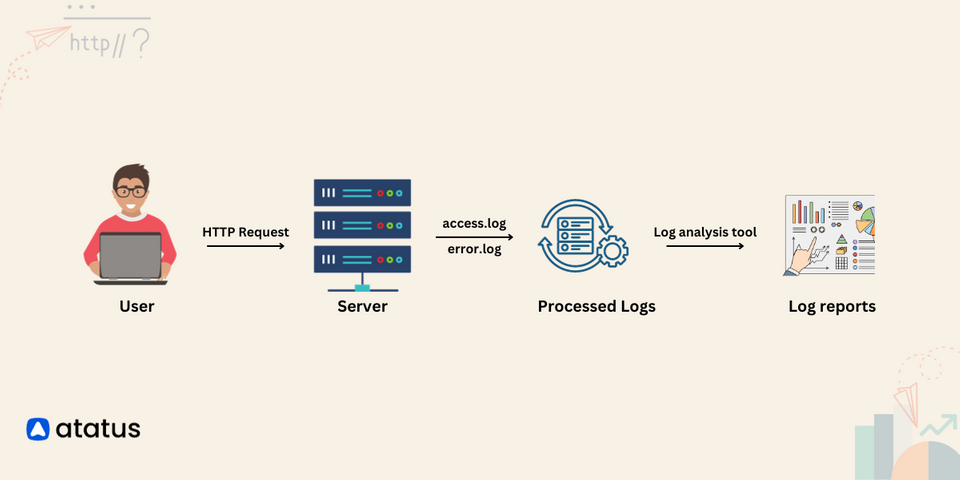
In the vast digital landscape of the internet, where websites and web applications serve countless users daily, there exists a silent but powerful guardian of information – Apache logs. Imagine Apache logs as the diary of your web server, diligently recording every visitor, every request, and every response.
At its core, Apache logs capture a variety of critical information. They record the IP addresses of visitors, revealing their geographic locations and potentially malicious activities. They log the URLs requested by users, exposing the pages and resources in demand. They also document the server's responses, indicating whether a request was successful or encountered errors.
However, it is not only about collecting data, it is also about understanding it. Working with Apache logs means taking the data, sorting it out, and creating pictures or graphs to turn the raw logs into useful information. To gain a deeper understanding of the concept of Apache logs, let's dive into the blog and explore it more comprehensively.
Table of Contents
- Introduction to Apache Log
- Types of Apache Log
- Modules Associated with Logging Activities
- Log Locations
- Log Rotation
- Custom Log Formats
- Apache Logs Monitoring with Atatus
Introduction to Apache Log
An Apache Logs are a detailed text file maintained by a web server, such as Apache, which serves as a record book for all interactions between the server and visitors' web browsers. This log documents essential information like who accessed the server, the precise time of access, the requested content, and whether the access was successful. It is similar to a server's memory, helping website owners monitor site activity and resolve any issues that may arise.
Consider you operate a website utilizing the Apache web server, and within your website exists a page named "example.html." Each time a visitor arrives at your website and views this page, Apache carefully logs the interaction in its Log. Here is an example of what a log entry in the Apache Log might look like,
log_entry = '192.168.1.100 - - [20/Sep/2023:14:30:00 +0000] "GET /example.html HTTP/1.1" 200 350 "-" "Mozilla/5.0 (Windows NT 10.0; Win64; x64) AppleWebKit/537.36 (KHTML, like Gecko) Chrome/70.0.3538.102 Safari/537.36"'
print(log_entry)
The above code creates a variable named "log_entry" to hold a lengthy text, similar to placing a message inside a labeled box. When we use "print(log_entry)," we are essentially instructing the computer to display the contents of the "log_entry" box on the screen.
Types of Apache Log
Apache generates various logs to assist administrators in monitoring and resolving server-related issues. The primary types of Apache logs includes,
- Access Log
- Error Log
- Custom Logs
- Combined Logs
1. Access Logs
Access log in Apache provide detailed information about website visitors, including the pages they view, request success status, and server response times. These logs assist website owners in monitoring traffic, visitor locations, and identifying security concerns, enabling better insights into website performance and potential issues.
log_entry = '127.0.0.1 - - [20/Sep/2023:14:30:45 +0000] "GET /example-page.html HTTP/1.1" 200 1234'
2. Error Logs
The Apache error log provides essential information about errors that the web server encounters during request processing, including issues like missing files and diagnostic details about the server's health.
It serves as a record of problems on the web server, alerting administrators when issues arise, such as malfunctioning web pages. These logs play a vital role in identifying and resolving server-related problems, ensuring the server operates smoothly and efficiently.
error_log_entry = '[Wed Sep 20 14:45:32.123456 2023] [error] [client 127.0.0.1] File does not exist: /var/www/html/non-existent-page.html'
3. Custom Logs
Custom logs, as the name suggests, allow server administrators to tailor logs according to their specific needs. This customization proves valuable when administrators want to track particular aspects of their server's performance or gather specific information related to their server's operation and objectives.
Consider a scenario, where you have to manage a web server for an e-commerce website. You need to monitor and log the daily count of product page views, which is not included in the standard access logs. To address this need, you decide to create a custom log to record this specific data. Here is a sample python code to illustrate how you can implement this custom logging,
def print_log_file(log_file_path):
    with open(log_file_path, 'r') as log_file:
        for line in log_file:
            print(line.strip())

log_file_path = '/var/log/product_page_views.log'

print_log_file(log_file_path)
When you run this code after logging some product page views, the output would look like this:
21/Sep/2023 /products/item123
21/Sep/2023 /products/item456
4. Combined Logs
Combined Logs are comprehensive access logs that provide extensive visitor information, including their referral sources (the "Referer" header) and detailed actions taken on the website. They offer a comprehensive view of website traffic and user interactions.
Modules Associated with Logging Activities
Effective log management is important across diverse domains such as software engineering, cybersecurity, and system administration. Log-centric modules hold a central position in the facilitation of organized log data handling and analysis.
These modules serve the critical purposes of log data aggregation, storage, and interpretation, contributing significantly to tasks such as issue resolution, security surveillance, and performance enhancement.
The following modules discussed below contribute to valuable modifications or improvements in logging behaviour.
1. mod_log_config
mod_log_config serves as the foundational logging module within Apache. It plays a central role in handling Apache's logging functionality. Administrators can configure Apache to log information such as client IP addresses, requested URLs, response status codes, and more in a format of their choice, making it a versatile tool for monitoring and troubleshooting web server activity.
# Enable mod_log_config
LoadModule log_config_module modules/mod_log_config.so

# Define a custom log format
LogFormat "%h %l %u %t \"%r\" %>s %b" custom_format

# Assign the custom log format to a specific location or virtual host
CustomLog /var/log/apache/access.log custom_format
2. mod_log_debug
mod_log_debug is an experimental module in Apache that extends the logging capabilities for debugging purposes. With mod_log_debug, you can log specific events, track client-related information, and customize debug log entries. However, its availability may depend on the Apache distribution you're using, as it's not included in all versions.
# Enable mod_log_debug (if available in your Apache distribution)
LoadModule log_debug_module modules/mod_log_debug.so

<Location /path/to/some/specific/directory>
    LogMessage "/path/to/specific/directory has been requested by" ${REMOTE_ADDR}
</Location>
3. mod_log_forensic
mod_log_forensic is designed to log data before and after the processing of HTTP requests, enhancing the server's forensic capabilities. This module is valuable for forensic analysis and auditing. Entries in the forensic log are tagged with "+" or "-" to indicate the beginning and end of a request's log data. It offers a unique perspective on request processing.
# Enable mod_log_forensic
LoadModule log_forensic_module modules/mod_log_forensic.so

<VirtualHost *:80>
    ServerName example.com
    ServerAdmin webmaster@example.com
    DocumentRoot /var/www/example.com
    ErrorLog /var/www/example.com/logs/error.log
    CustomLog /var/www/example.com/logs/access.log combined
    ForensicLog /var/www/example.com/logs/forensic.log
</VirtualHost>
4. mod_logio
mod_logio is responsible for logging data related to the number of bytes sent and received for each HTTP request. This module is particularly useful for monitoring server load, analyzing bandwidth usage, and assessing the efficiency of network protocols. It also introduces the ability to measure the Time to First Byte (TTFB) when enabled with LogIOTrackTTFB.
# Enable mod_logio (typically included by default)
LoadModule logio_module modules/mod_logio.so

# Configure LogFormat to include bytes transferred and TTFB
LogFormat "%h %l %u %t \"%r\" %>s %b \"%{Referer}i\" \"%{User-Agent}i\" %I %O %^FB" custom_format

# Assign the custom log format to a specific location or virtual host
CustomLog /var/log/apache/access.log custom_format
5. mod_filter
mod_filter is a versatile tool for security and content manipulation. It allows for various configurations, such as defining filter chains and providers, and can be used at different levels within Apache, including directory-specific configurations. It enhances Apache's output chain by introducing context-sensitive filters that can process server responses.
# Enable mod_filter (if not already enabled)
LoadModule filter_module modules/mod_filter.so

<IfModule mod_filter.c>
   <IfModule mod_include.c>
       # Declare a resource type filter
       FilterDeclare xss

       # Register a provider to filter certain requests
       FilterProvider xss INCLUDES %{REQUEST_FILENAME}="(/[<>]+)$"

       # Build the filter chain
       FilterChain xss

       # Log filtered requests
       CustomLog /var/www/log/xss.log xss

       # Define log format for filtered requests
       LogFormat "%h %u %t \"%r\" %>s \"%{Referer}i\" \"%{User-Agent}i\"" xss
   </IfModule>
</IfModule>
6. mod_unique_id
mod_unique_id generates a unique identifier for each HTTP request processed by Apache. The unique identifier is valuable for debugging, monitoring, and tracing requests across multiple server instances and child processes. It offers a reliable way to associate a single request with its lifecycle through the server.
# Enable mod_unique_id (if not already enabled)
LoadModule unique_id_module modules/mod_unique_id.so

# Configure the unique identifier to be written to the access log
LogFormat "%h %l %u %t \"%r\" %>s %b \"%{Referer}i\" \"%{User-Agent}i\" %{UNIQUE_ID}e" custom_format

# Assign the custom log format to a specific location or virtual host
CustomLog /var/log/apache/access.log custom_format
Log Locations
Apache server logs contain information about requests made to your Apache web server, including details like IP addresses, requested URLs, and response status codes. The location of these logs may vary depending on the operating system you are using, and you can also customize the location if needed.
- In Red Hat, CentOS, or Fedora Linux systems, the default location for Apache access logs is
/var/log/httpd/access_log. You can access these logs by examining the/var/log/httpd/access_logfile, which maintains a comprehensive record of all incoming HTTP requests to your server. - For Debian and Ubuntu systems, the Apache access logs are stored at
/var/log/apache2/access.logby default. These logs contain identical information to what you would find on other systems and can be accessed by reviewing the/var/log/apache2/access.logfile. - On FreeBSD, Apache access logs are kept in a slightly different default location, specifically at
/var/log/httpd-access.log. Despite the variance in location, the data within these logs is consistent with what you would typically find on other systems. To view these logs on FreeBSD, you would inspect the/var/log/httpd-access.logfile.
If you need to change the location where Apache stores its logs, you can do so using the CustomLog directive in your Apache configuration. For instance, to set a custom location like /path/to/custom/access_log, you would include this line in your Apache configuration.
CustomLog /path/to/custom/access_log common
This flexibility allows you to adapt the log storage to your specific needs, whether it's for organizational purposes or meeting particular logging requirements.
Log Rotation
Log rotation is a method for managing log files, ensuring they don't consume too much space or slow down your system. It works by deleting, moving, renaming, or compressing log files that are either too old or too large.
Without log rotation, your web server's log files can become massive, causing your server to run out of storage space. Additionally, reading from or writing to these large log files can slow down your server's performance.
Log rotation strategies offer various options to manage log files effectively, and the choice depends on your specific needs. Commonly used strategies includes:
1. Time Based Rotation
- In time-based log rotation, log files are rotated at specific time intervals, such as daily, weekly, or monthly.
- This strategy keeps log files organized by date and ensures that you have logs for different time periods.
Example: Consider a case where you want to rotate the Apache access logs daily; in that case, the below code sample can help you achieve it.
/var/log/apache2/access.log {
    daily
    ...
}
2. Size Based Rotation
- Size-based log rotation rotates log files when they reach a predefined size limit. This prevents individual log files from becoming excessively large.
- It's useful when you want to control log file sizes to conserve disk space.
Example: You can use the code given below to rotate a custom application log when it reaches 100MB.
/var/log/myapp.log {
    size 100M
    ...
}
3. Combination Strategy
- Combining time-based and size-based rotation allows for more precise log file management.
- For example, you can set a size limit, but also rotate logs daily to ensure that they don't get too large or too old.
Example: Utilize the code given below to rotate MySQL error logs daily, but also when they reach 50MB.
/var/log/mysql/error.log {
    daily
    size 50M
    ...
}
After creating or modifying your log rotation configuration files, you can manually trigger log rotation with the following command,
sudo logrotate -f /etc/logrotate.conf
Thus, effective log rotation helps keep log files organized, manageable, and compliant with data retention policies.
Custom Log Formats
Imagine you have a website with two sections, "Blog" and "Shop," and you want to keep track of visitor activity separately for each section. You can create custom log formats and assign them nicknames for this purpose.
Each section of your website may require slightly different information in your log files. Let us create two custom log formats named "blog_format" and "shop_format" to cater to the specific needs of each section.
# Define log format for the Blog section
LogFormat "%h %l %u %t \"%r\" %>s %b" blog_format

# Define log format for the Shop section
LogFormat "%h %l %u %t \"%r\" %>s %O \"%{Referer}i\" \"%{User-Agent}i\"" shop_format
Now that you've defined these two formats, you can use them separately for each section of your website respectively.
To create log files with the specified formats, you can use the CustomLog directive. Here is how you would configure it for the Blog and Shop sections,
For the Blog section:
CustomLog /var/log/apache2/blog.log blog_format
For the Shop section:
CustomLog /var/log/apache2/shop.log shop_format
These directives tell Apache to log visitor activity in separate log files /var/log/apache2/blog.log and /var/log/apache2/shop.log using the respective formats ("blog_format" and "shop_format"). This flexibility helps you manage and analyse visitor activity more effectively, especially when you have distinct sections or areas on your site that require different log data.
Apache Logs Monitoring with Atatus
Atatus is a comprehensive monitoring and analytics platform that helps organizations monitor the performance, availability, and security of their applications and infrastructure.
When integrated with Apache web server logs, it allows users to gain visibility into Apache server activity, troubleshoot issues, and optimize server performance. This integration enables real-time log data collection, analysis, and visualization in a centralized dashboard.
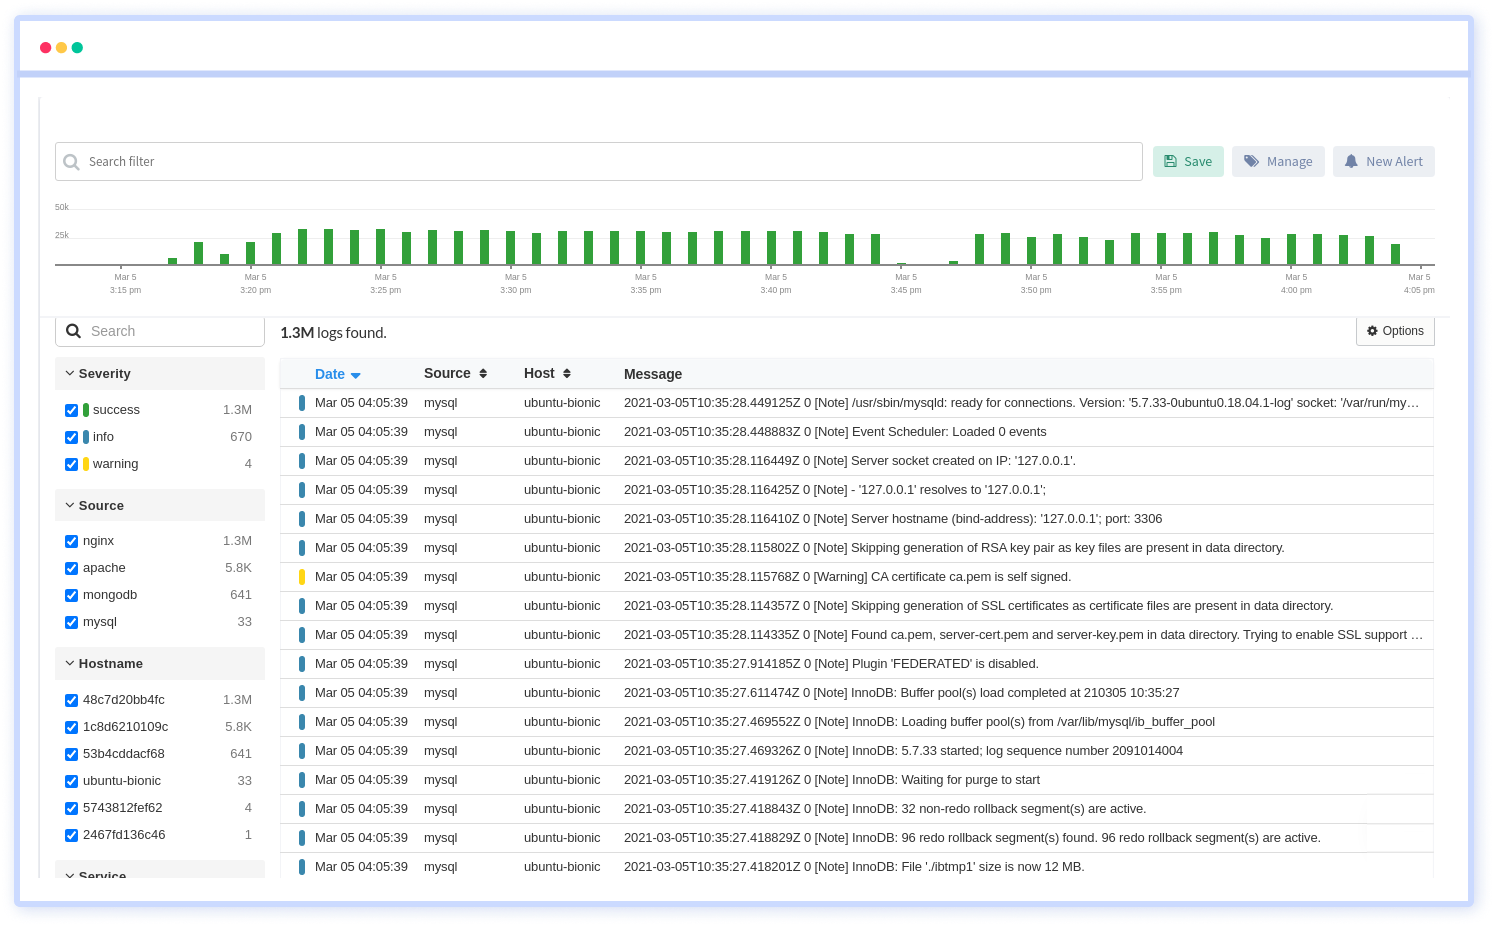
By centralizing log management, Atatus gains comprehensive visibility into its complex architecture, all in a cost-effective and scalable manner. This means Atatus can process all its logs, generate valuable metrics, and visualize log data, all conveniently accessible from a single centralized location.
Key Features
- Real-time Log Collection: Atatus collects Apache log data in real-time, providing you with up-to-the-minute insights into your web server's activities.
- Log Search and Filtering: Easily search and filter through large volumes of log data using flexible query capabilities. This enables you to pinpoint the information you need quickly and efficiently.
- Interactive Search: Live Tail typically includes an interactive search bar that allows users to filter log events in real-time based on keywords, patterns, or specific criteria. This makes it easy to focus on the most relevant log data.
- Multiple Log Sources: It can support streaming logs from multiple Apache web servers or log sources simultaneously, providing a centralized real-time view of all log events.
- Historical Analysis: Access historical log data to identify long-term trends, diagnose recurring issues, and plan for capacity upgrades or optimizations.
- Alerting and Notification: Set up alerts based on specific log events or patterns, ensuring that you're promptly notified when critical issues occur, such as server errors, security threats, or unusual traffic spikes.
Try your 14-day free trial of Atatus.
Conclusion
Apache logs are a critical component of web server management and security. They provide valuable insights into server activity, user behaviour, and potential security threats.
In this blog, we have explored key aspects of Apache logs, including log rotation, log locations, log formats, types and more importantly the logs monitoring using Atatus. These elements are crucial for managing and securing Apache web servers, ensuring efficient log storage, accessibility, and meaningful data collection for analysis and troubleshooting.
By analyzing and monitoring Apache logs effectively, administrators can optimize server performance, troubleshoot issues, and enhance overall web server security. Regular log analysis and the implementation of appropriate security measures are essential to ensure the smooth and secure operation of Apache web servers.
#1 Solution for Logs, Traces & Metrics
![]() APM
APM
![]() Kubernetes
Kubernetes
![]() Logs
Logs
![]() Synthetics
Synthetics
![]() RUM
RUM
![]() Serverless
Serverless
![]() Security
Security
![]() More
More