Prometheus Architecture Scalability: Challenges and Tools for Enhanced Solutions

After successfully deploying and implementing a software system, the subsequent task for an IT enterprise revolves around the crucial aspects of system monitoring and maintenance. An array of monitoring tools has been developed in alignment with the software system's evolution and requirements.
Monitoring tools for software systems provide the essential insights that IT teams require to comprehend the real-time and historical performance of their systems. This understanding empowers them to strategize actions for proficiently overseeing their networks, systems, and devices, enabling them to make informed decisions spanning both immediate and future contexts.
These tools encompass real-time monitoring, alerting and notification features, comprehensive dashboards for visualization, performance metrics assessment, log monitoring capabilities, scalability evaluation, network oversight, application performance tracking and so on.
As we have previously delved into the details of Prometheus, Prometheus stands out as a prominent monitoring tool. Similar to all monitoring tools, Prometheus possesses both its strengths and weaknesses.
This article, however, will concentrate exclusively on addressing one key limitation of Prometheus: its scalability. The reason for this specific focus is the multitude of queries and uncertainties developers frequently have about Prometheus' scalability. We intend to provide clear clarification in this regard.
- Scalability of Monitoring System - An Introduction
- Key Limitations of Prometheus
- Scalability Options in Prometheus
- Top 6 Scaling Tools for Prometheus
Scalability of Monitoring System - An Introduction
The scalability of a monitoring system refers to its ability to successfully handle increased workloads and growing needs. In essence, it refers to the system's ability to handle larger volumes of data, more resources, and higher traffic levels without sacrificing performance, responsiveness, or accuracy. A scalable monitoring system may adapt to changing situations, such as an expanding user population, newly monitored entities, or greater data flow while preserving efficiency and efficacy.
An Overview of Prometheus
Prometheus is an open-source monitoring and alerting toolset made for keeping tabs on the functionality, status, and metrics of software applications and systems. It has been designed with dynamic cloud-native environments and microservices architectures in mind.
Prometheus collects metrics from a variety of targets, including services, servers, and applications, and retains the time-series data it has gathered. This data can then be examined, represented visually, and used to provide alerts depending on predetermined rules.
The Prometheus architecture is centred on its core server for data collecting, storage, querying, and alerting. Exporters provide metrics, while the Push Gateway handles transient jobs. The data is saved in a labelled time-series database.
Alertmanager controls alerts, and Prometheus facilitates service discovery and relabeling. PromQL simplifies sophisticated queries, and visualisation tools like Grafana improve monitoring. The architecture is appropriate for dynamic systems, but scalability solutions such as federation and remote storage may be required.
Key Limitations of Prometheus
- Long-Term Storage: Not designed for long-term storage; hard to retain historical data.
- Scalability: Extremely big environments with various targets or metrics are difficult to scale.
- Lack of Native High Availability: Need external configurations for high availability, which influences system resilience.
- Limited Multi-Tenancy Support: Multi-tenancy is not natively supported and requires additional configuration.
- Global View of Data: As mentioned earlier, individual Prometheus instances serve as standalone data stores. While federation is possible, it introduces complexity, and Prometheus isn't inherently built for distributed databases. This hinders a simple path to achieving a cohesive, universal view of your time series data.
- Authentication & Authorization: Prometheus lacks built-in authentication measures, rendering its endpoints vulnerable without sufficient user validation. Authorization lacks native authorisation features, which means that once access is granted, users have complete control over queries and data editing.
Scalability Options in Prometheus
In Prometheus, scalability is the capacity to manage an increasing number of monitored targets and metrics while maintaining effective performance and resource allocation.
Prometheus has made improvements in terms of scalability, but it's important to realise its limitations and the best practices for growing successfully.
Prometheus embodies the following scalability options:
- Horizontal Scaling: Prometheus may be horizontally scaled by installing additional Prometheus instances and dividing the workload across them. However, managing a distributed setup adds complexity, and you must guarantee that the data collecting and querying duty is evenly spread.
- Federation: Federation is supported by Prometheus, allowing you to combine data from various Prometheus servers into a single one. Distributing the monitoring workload across many areas, teams, or services, can aid in scalability.
- Sharding: In some circumstances, sharding the monitoring workload based on various labels or dimensions might enhance scalability. This entails dividing the metrics data into numerous Prometheus instances according to specific parameters, which might lessen the strain on individual instances.
- Remote Storage Backends: Prometheus supports several remote storage backends, such as Thanos and Cortex, to solve the restrictions of long-term storage. These technologies enable you to offload historical data to more appropriate storage systems while still querying and visualising the data.
While Prometheus presents diverse scalability choices, they may prove insufficient for exceptionally extensive environments with numerous targets and metrics. The complexities of scaling become evident in these situations, as existing solutions might not be suitably equipped to tackle the intricate challenges posed by such elaborate and sprawling ecosystems.
Top 6 Scaling Tools for Prometheus
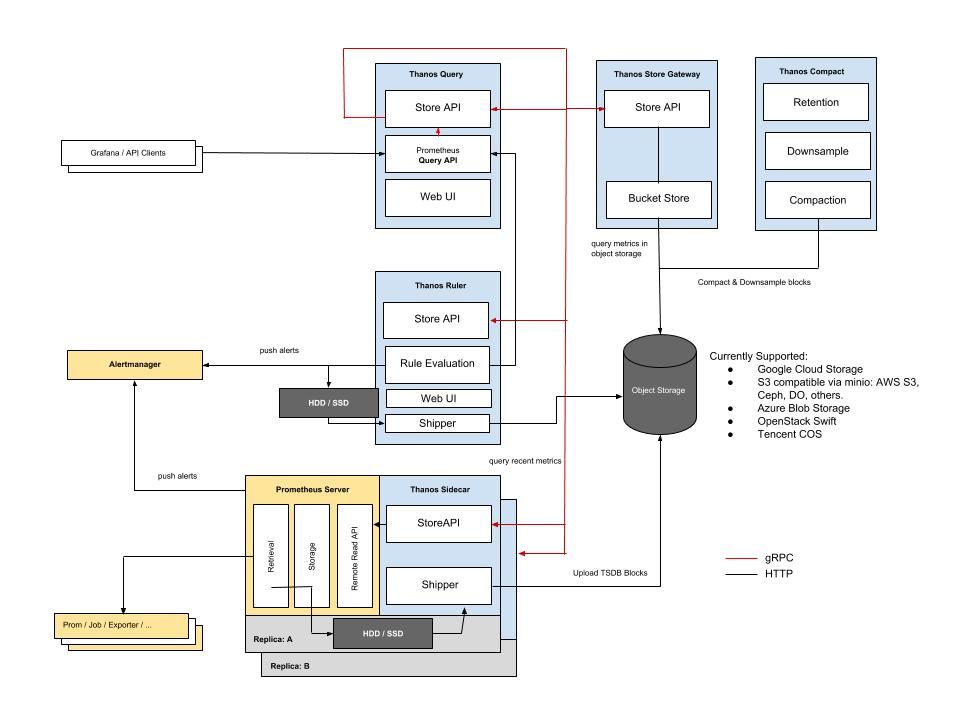
1. Thanos
Thanos is an open-source project that adds long-term storage and high availability to Prometheus. It enables the storing of historical data in object storage systems such as Amazon S3 or Google Cloud storage. Thanos has a query federation functionality that allows you to query multiple Prometheus instances and remote storage systems.
Pros:
- Store historical data beyond Prometheus' limits using S3 or GCS.
- Achieve high availability with federated queries across multiple instances.
- Optimize query performance by distributing workloads.
- Overcome Prometheus' limitations, handling high-cardinality cases.
- Maintain data for compliance, analysis, and auditing.
Cons:
- Configuring multiple components adds complexity.
- Extra components require careful resource planning.
- Requires understanding Thanos components and configurations.
- Continuous management for data consistency and reliability.
- Historical data storage may result in added expenses.
- Workflow and alerting changes may be necessary.
- Some features or integrations may not be supported.
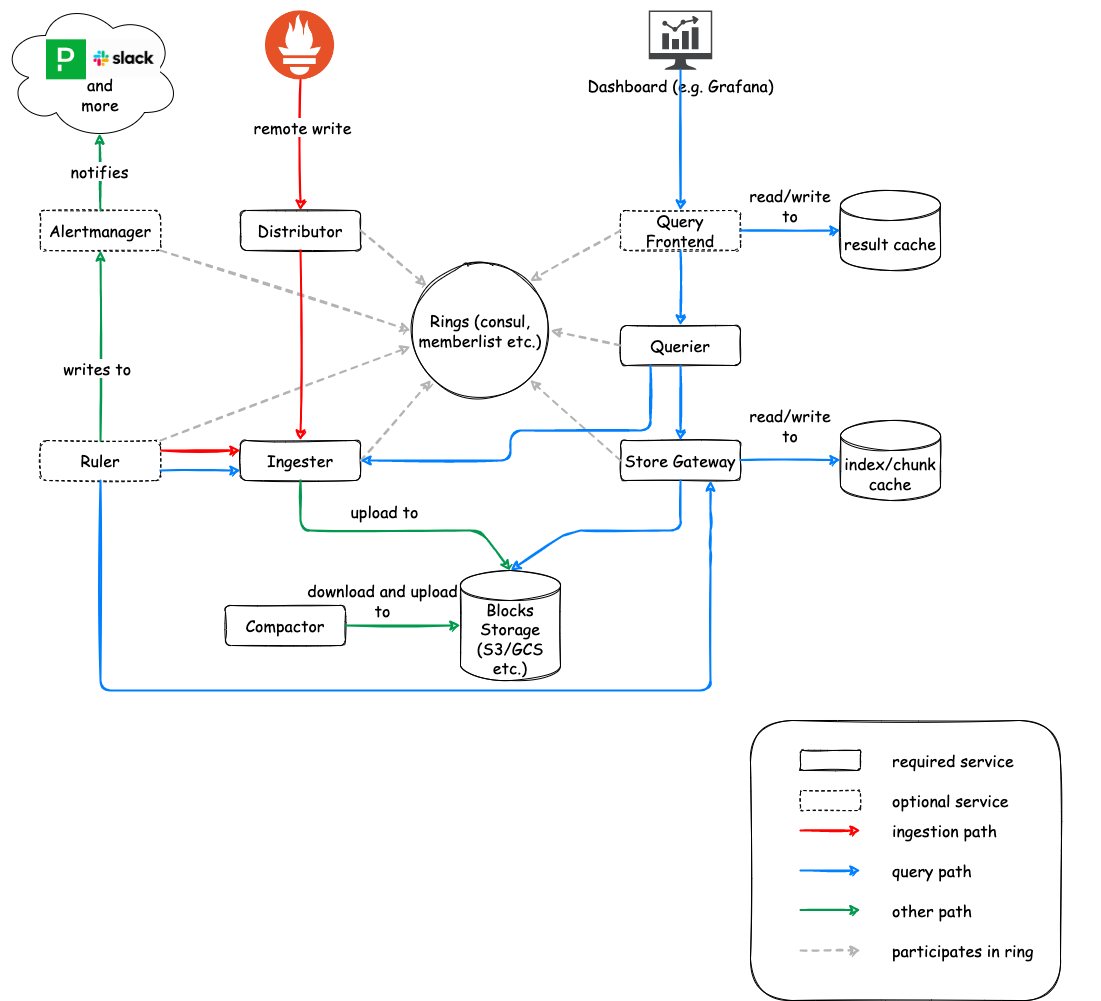
2. Cortex
Cortex is a multi-tenant, horizontally scalable Prometheus-as-a-Service solution. It enables you to distribute metrics collection and querying effort over numerous Cortex instances. It is intended for high cardinality scenarios and provides efficient long-term storage through the use of several backend storage systems.
Pros:
- Distributes workloads across multiple instances for handling extensive metrics and targets.
- Allows multiple teams or projects to share one cluster, simplifying resource management.
- Efficiently manages metrics with numerous labels or dimensions, excelling in high-cardinality scenarios.
- Integrates seamlessly with object storage for long-term historical data storage.
- Utilizes query optimization and caching for faster user query responses.
Cons:
- Coordinating multiple components and configurations can be intricate.
- Operating multiple Cortex components may require resource optimization.
- Teams may need time to learn effective Cortex configuration and management.
- Ongoing attention is vital for consistent performance and availability.
- Integrating Cortex may require workflow and alerting adjustments.
- Minor differences in behavior or feature support might occur.
- Tailoring Cortex to specific needs may involve development and customization work.
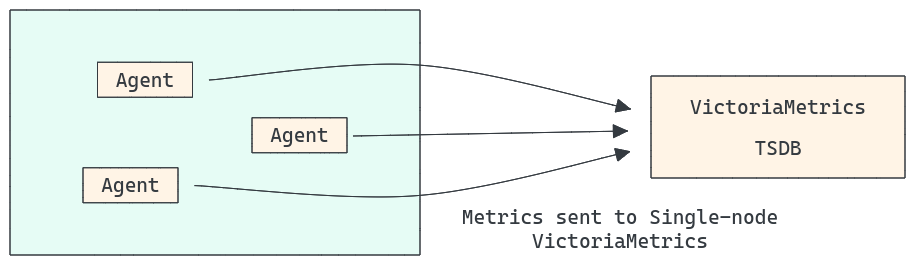
3. VictoriaMetrics
VictoriaMetrics is a Prometheus-compatible time-series database that is fast, cost-effective, and scalable. It is intended for long-term storage and fast querying of time-series data. It supports many storage backends, including local and remote object storage.
Pros:
- Optimized for fast performance and minimal resource usage.
- Horizontally scales to accommodate growing workloads.
- Supports extended historical data retention.
- Smooth integration with existing Prometheus systems.
- Efficiently manages high-cardinality metrics.
Cons:
- May require learning for Prometheus users due to setup differences.
- Some Prometheus features may vary or need adaptation.
- Customization efforts for specific needs can be intricate.
- Ongoing upkeep is crucial for performance and scalability.
- Proper resource allocation is key for optimal performance.
- Integrating into an existing Prometheus ecosystem may require workflow and tool adjustments.
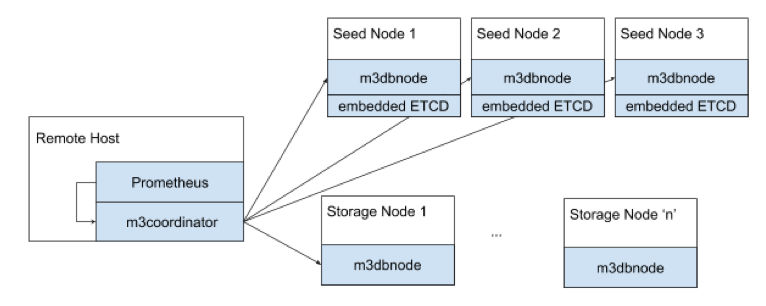
4. M3DB
M3DB is a time-series database that may be used as a backend for Prometheus. It is distributed, scalable, and dependable. It has automatic sharding, replication, and a global namespace for storing metrics.
Pros of M3DB:
- Effectively handles substantial metric volumes and targets by distributing workloads.
- Automatically divides data into clusters for consistent performance at scale.
- Simplifies metric management across teams, services, or projects with a global namespace.
- Efficient time-series storage enables extensive historical data retention without slowing queries.
- Swift retrieval of metric data is enabled by efficient querying capabilities.
Cons of M3DB:
- Setup and configuration can be intricate, involving multiple components.
- Teams accustomed to Prometheus may require additional learning for M3DB's distributed architecture.
- Steady performance and availability necessitate continuous upkeep.
- Adapting monitoring workflows and alerting systems may be needed when integrating with an existing Prometheus environment.
- Managing M3DB's distributed system requires careful resource management.
- While aligned with Prometheus, differences or limitations may require attention.
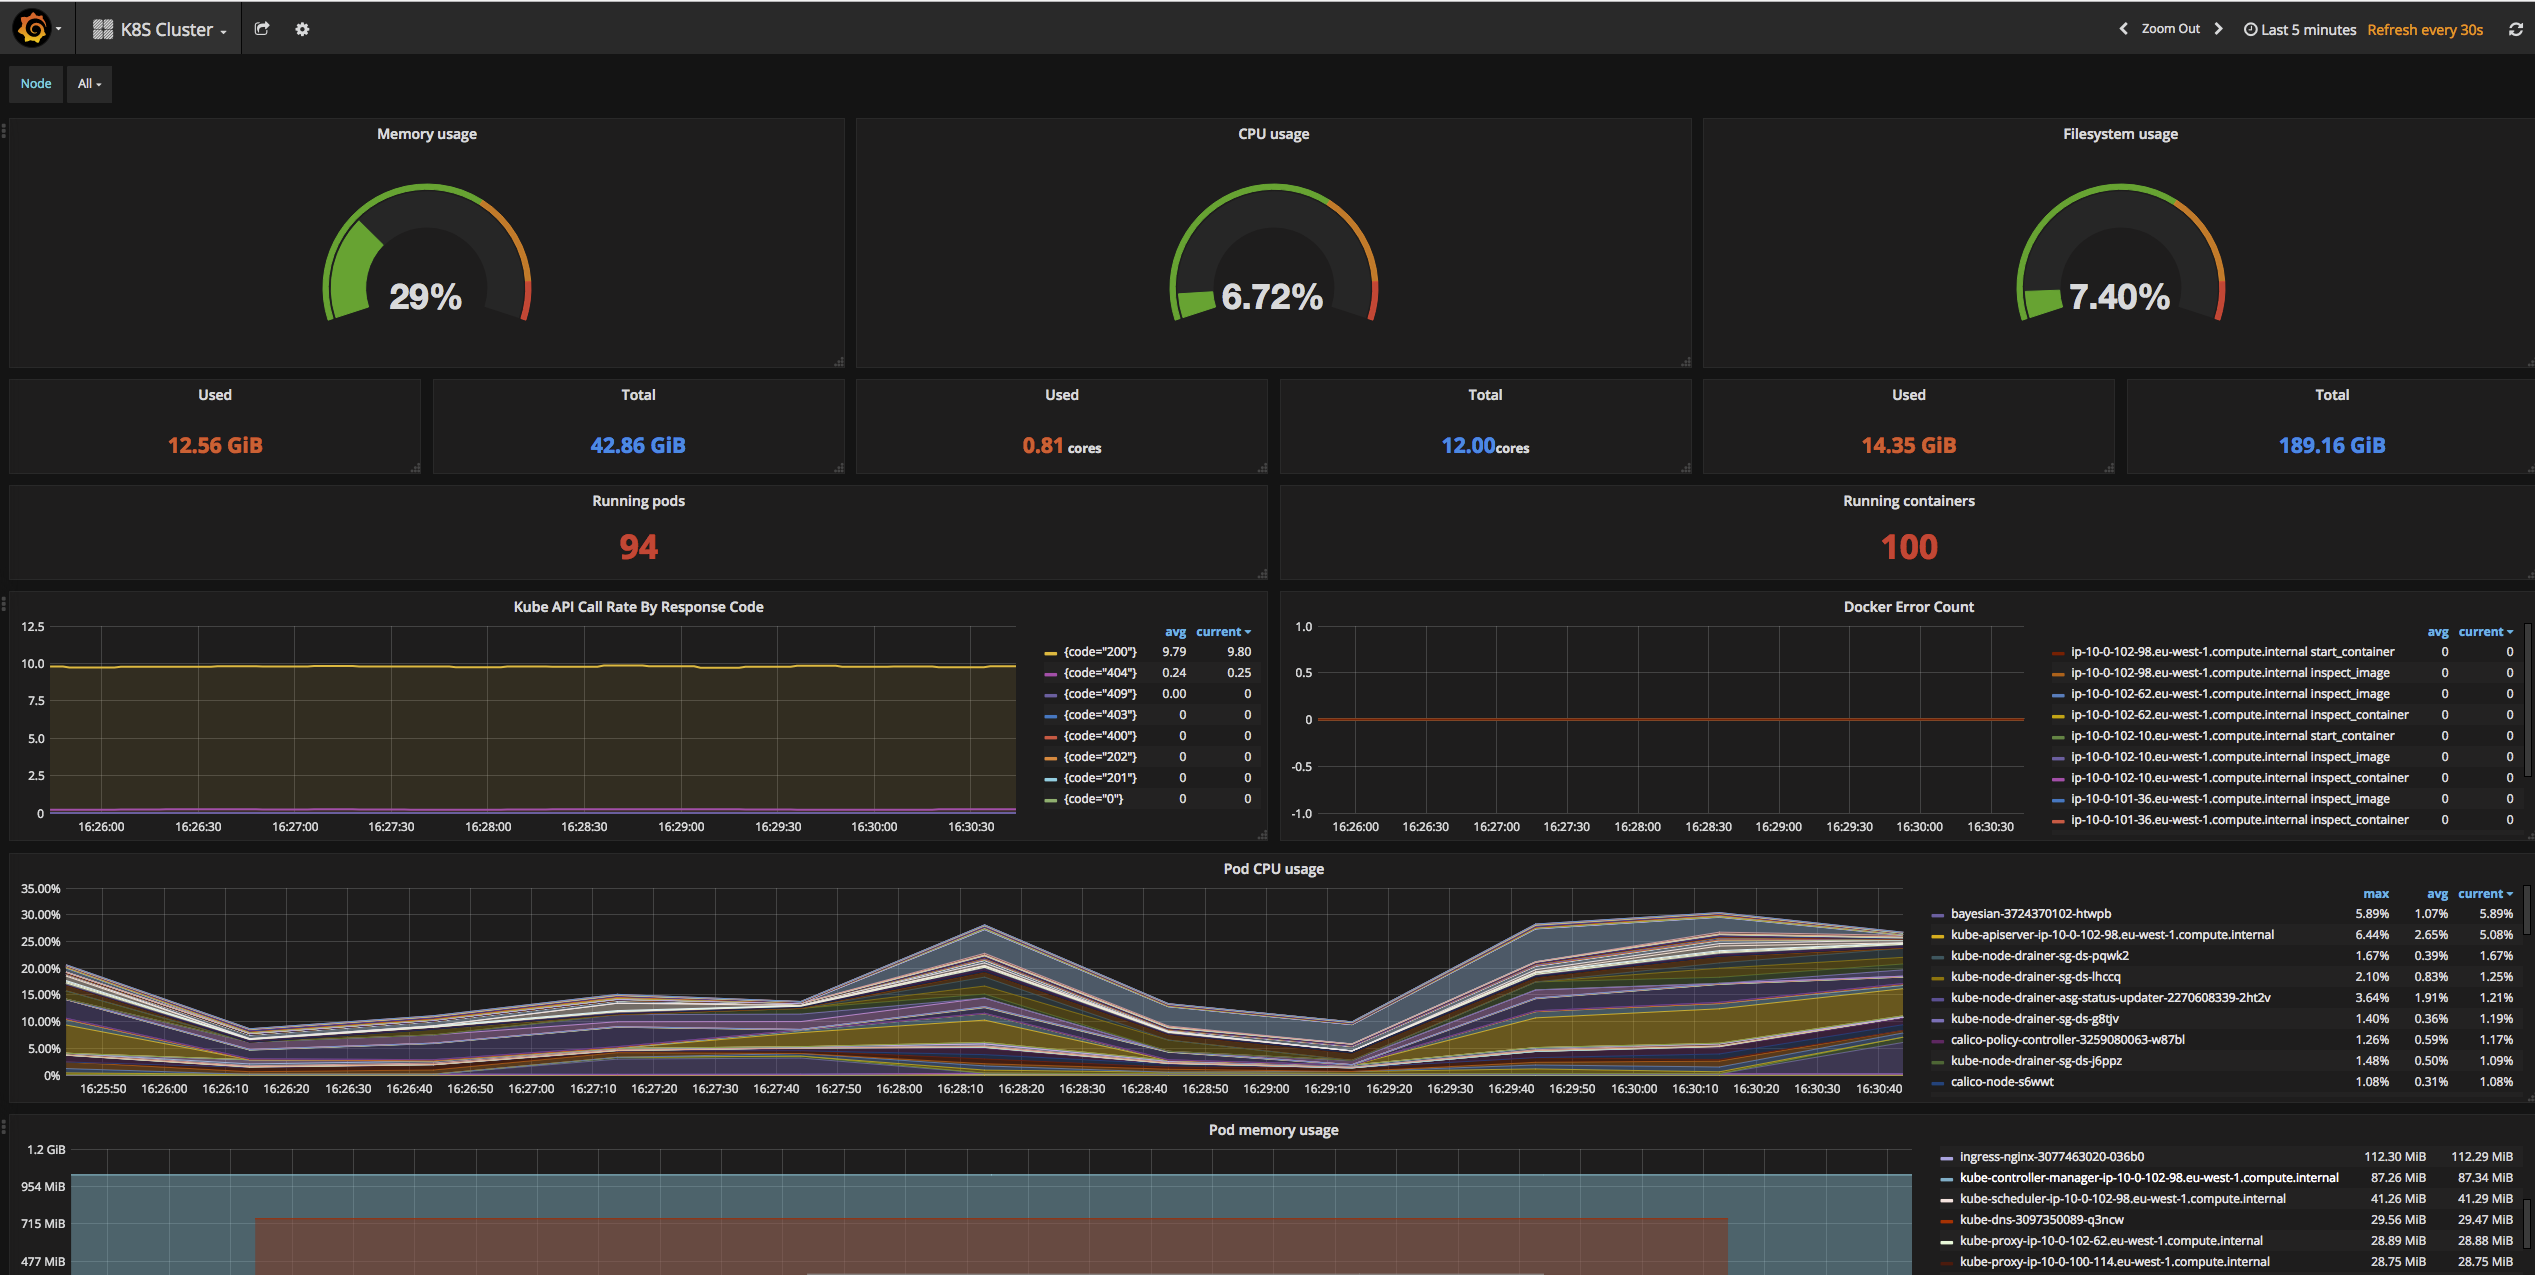
5. Kube-Prometheus
Kube-Prometheus is a collection of Kubernetes manifests, Grafana dashboards, and Prometheus rules for setting up and managing Prometheus and related components in a Kubernetes environment. It simplifies the deployment and management of Prometheus at scale within Kubernetes clusters.
Pros of Kube-Prometheus:
- Seamlessly integrates with Kubernetes, simplifying deployment and management in containerized environments.
- Enjoys a strong community and ecosystem support, making it well-maintained and up-to-date.
- Provides preconfigured Grafana dashboards and Prometheus rules tailored for monitoring Kubernetes clusters.
- Can be scaled horizontally to handle large Kubernetes clusters and diverse workloads.
- Incorporates best practices for Kubernetes monitoring out of the box.
Cons of Kube-Prometheus:
- Primarily designed for Kubernetes monitoring, which may not be suitable for non-Kubernetes environments.
- Relies on Prometheus for local storage, which might not be ideal for long-term retention of historical data.
- While it simplifies Kubernetes monitoring, it may still involve some complexity in configuration and setup.
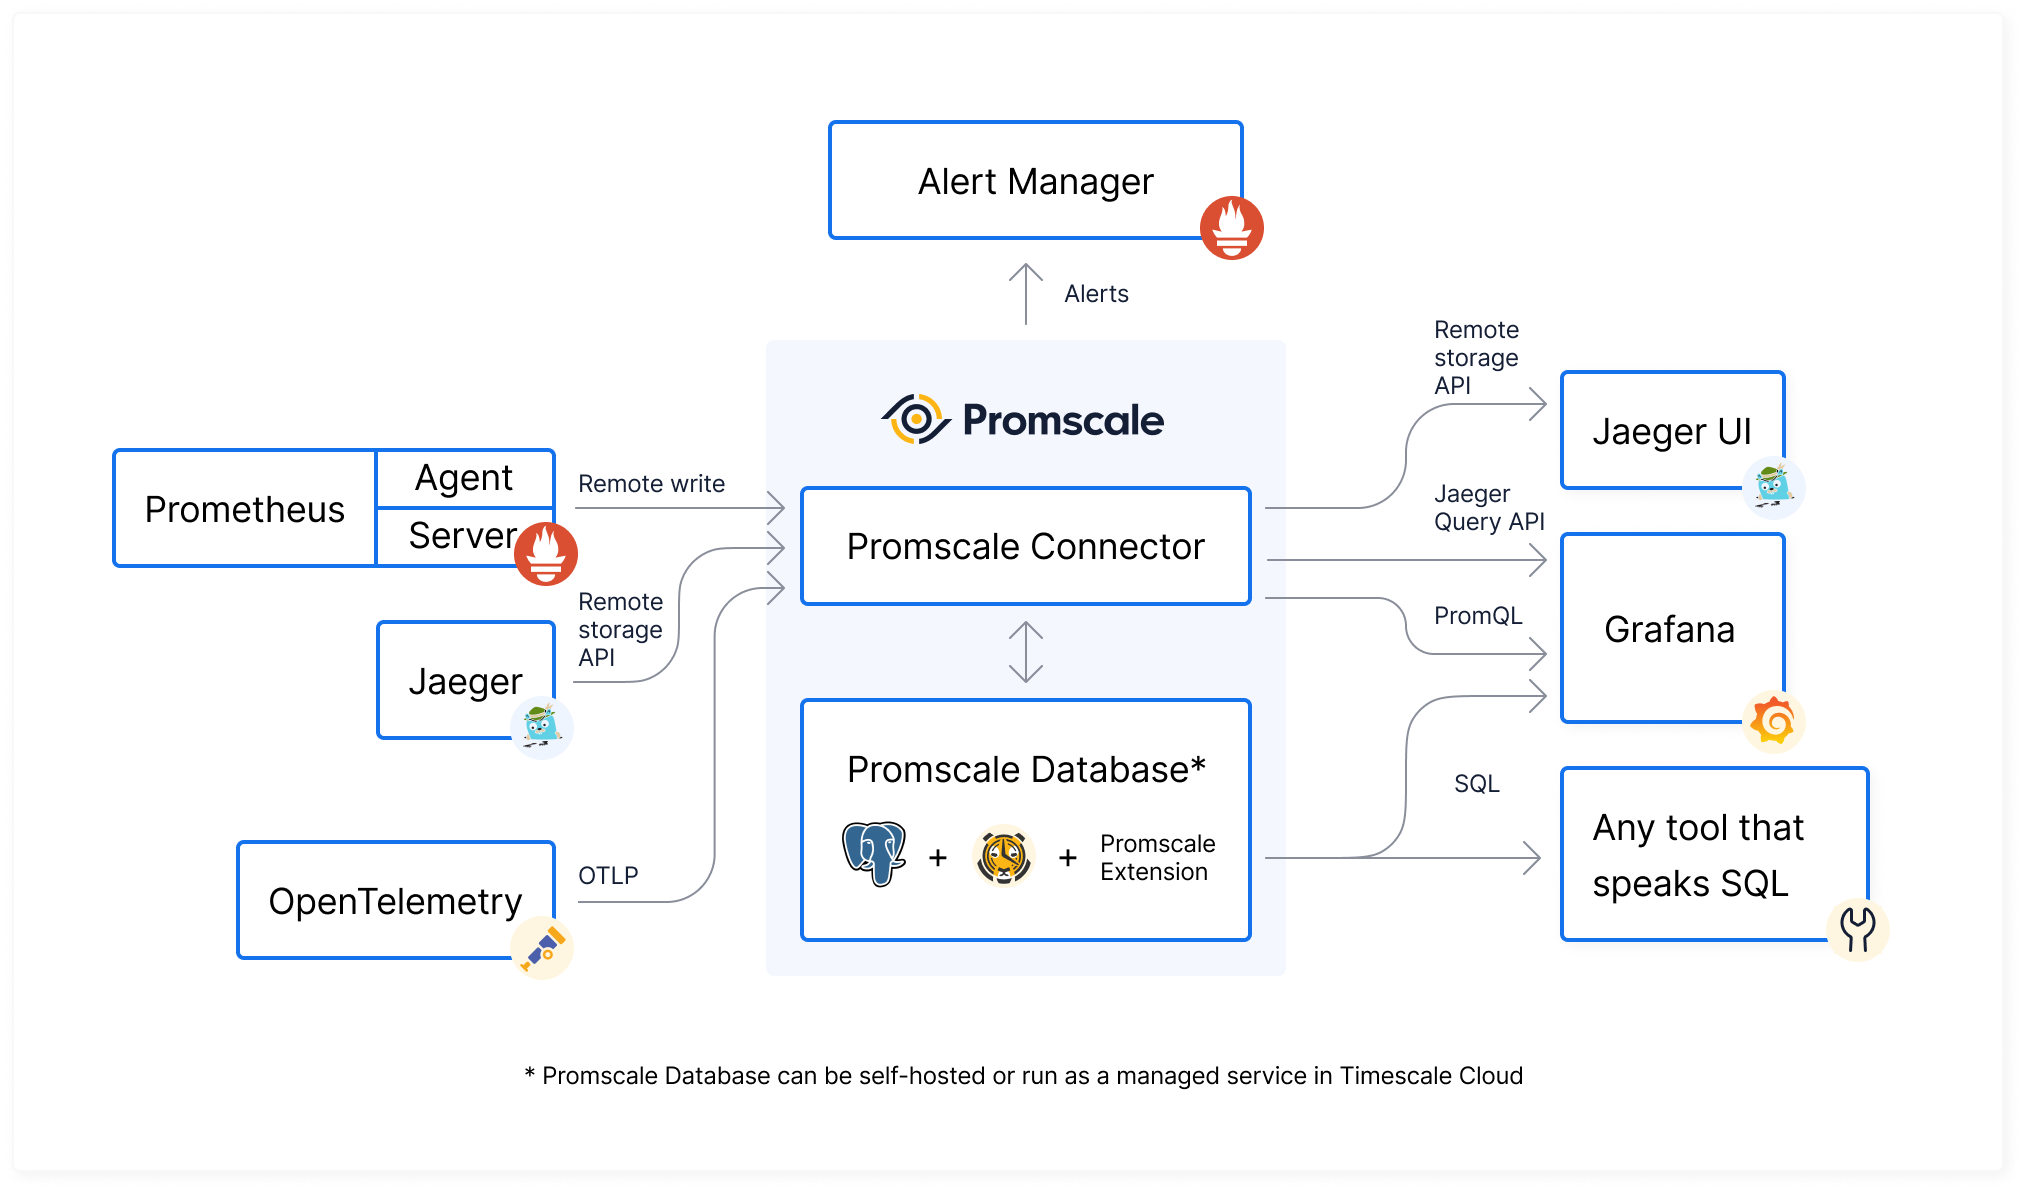
6. Promscale
Promscale is an open-source long-term storage solution for Prometheus. It integrates with TimescaleDB, a time-series database, to provide high-performance storage for Prometheus metrics. Promscale is designed to handle large amounts of data and complex queries efficiently.
Pros of Promscale:
- Offers high-performance long-term storage for Prometheus metrics through integration with TimescaleDB.
- Scales horizontally to handle large volumes of metrics data efficiently.
- Allows users to run SQL queries on stored metrics data, offering flexibility in data analysis.
- Leverages TimescaleDB's features, including data compression and retention policies.
- Promscale is open-source, providing transparency and community support.
Cons of Promscale:
- Requires additional setup and maintenance for TimescaleDB, adding complexity to the monitoring stack.
- Learning SQL queries and TimescaleDB might be necessary for some users.
- Not as widely adopted as some other Prometheus storage solutions, which may result in fewer community-contributed resources.
How Prometheus Scales in Real-Time?
Imagine you're an operations engineer responsible for monitoring a rapidly expanding microservices-based e-commerce platform. The platform experiences frequent traffic spikes, and you need to ensure that Prometheus can handle the increasing load seamlessly.
Step 1: Basic Prometheus Setup
You begin by setting up a basic Prometheus instance to monitor the essential components of your platform, such as web servers, databases, and application services.
# prometheus.yml
global:
  scrape_interval: 15s

scrape_configs:
  - job_name: 'web-servers'
    static_configs:
      - targets: ['web-server-1:9090', 'web-server-2:9090']

  - job_name: 'databases'
    static_configs:
      - targets: ['db-server-1:9090', 'db-server-2:9090']

  # ... other jobs for application services ...
Step 2: Horizontal Scaling
As your platform grows, you realize that a single Prometheus server is no longer sufficient. To handle the increased number of targets, you horizontally scale Prometheus by deploying multiple Prometheus instances across your infrastructure.
# Updated prometheus.yml with multiple Prometheus instances
global:
  scrape_interval: 15s

scrape_configs:
  - job_name: 'web-servers'
    static_configs:
      - targets: ['web-server-1:9090', 'web-server-2:9090']
    metric_relabel_configs:
      - source_labels: [__address__]
        target_label: instance
        regex: '(.*):9090'
        replacement: 'web-server'

  - job_name: 'databases'
    static_configs:
      - targets: ['db-server-1:9090', 'db-server-2:9090']
    metric_relabel_configs:
      - source_labels: [__address__]
        target_label: instance
        regex: '(.*):9090'
        replacement: 'db-server'

  # ... other jobs for application services ...
Now, Prometheus can efficiently scrape metrics from multiple instances running across your infrastructure.
Step 3: Implementing Thanos for Long-Term Storage
To address long-term storage needs and to prevent data loss after the default retention period, you integrate Thanos, a popular tool for Prometheus, to offload metrics data to a remote storage solution like AWS S3 or Google Cloud Storage.
# Thanos integration in prometheus.yml
remote_write:
  - url: "http://thanos-sidecar:10903/api/v1/write"

remote_read:
  - url: "http://thanos-query:10903/api/v1/read"
With Thanos, you can retain historical data and gain insights into trends and anomalies over extended periods.
Step 4: Monitoring and Alerting
You set up alerting rules within Prometheus to notify you of critical issues in real-time. For instance, you create an alert rule to trigger when the error rate from web servers exceeds a certain threshold.
# Alerting rules in prometheus.yml
alerting_rules:
  - alert: HighErrorRate
    expr: sum(rate(http_requests_total{job="web-servers", status="500+"}[5m])) / sum(rate(http_requests_total{job="web-servers"}[5m])) > 0.1
    for: 5m
    labels:
      severity: critical
    annotations:
      summary: High error rate detected
      description: The error rate from web servers has exceeded 10% for the last 5 minutes.
Prometheus continuously evaluates these rules and sends alerts to your chosen alerting mechanism, ensuring that critical issues are promptly addressed.
Step 5: Dashboard and Visualization
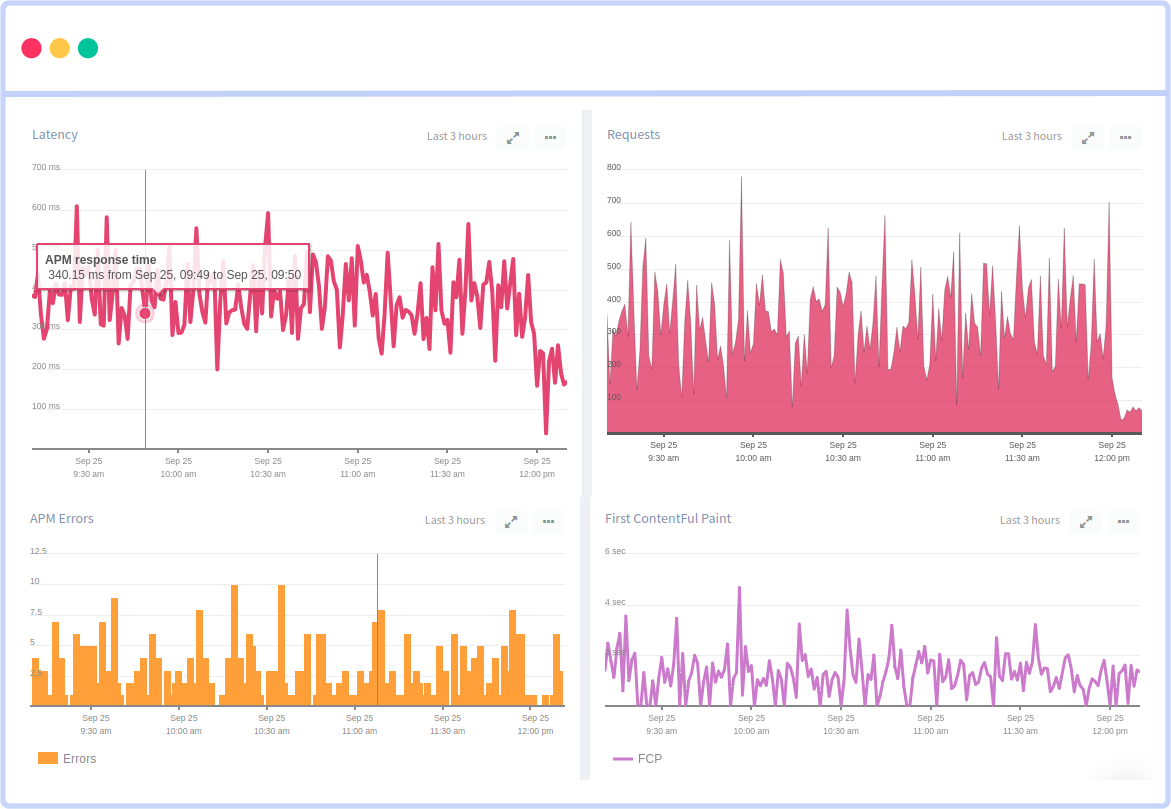
To gain insights into the health of your platform, you create informative dashboards using visualization tools like Atatus, Grafana, which can connect directly to Prometheus. This allows you to monitor real-time metrics, track historical trends, and make informed decisions to optimize your infrastructure.
By horizontally scaling Prometheus, integrating Thanos for long-term storage, setting up alerting, and creating dashboards, you've established a robust monitoring system capable of handling real-time challenges while providing valuable insights into your infrastructure's health and performance.
Conclusion
Prometheus has brought about a significant transformation in the monitoring realm for cloud-native applications, especially within the context of Kubernetes. It facilitates the straightforward ingestion of metrics for various components of your software stack.
Nonetheless, even sizable tech enterprises encounter difficulties when it comes to effectively managing and scaling Prometheus.
Regrettably, a basic Prometheus setup comes with constraints. As your operations expand and scalability becomes essential, Prometheus fails to provide a unified view encompassing all your metrics (not to mention traces and additional observability data), steadfast data retention, advanced analytical capabilities, intelligent and adaptable alerting, or an intrinsic configuration for high availability.
To streamline this intricate process, organizations should contemplate adopting a managed Prometheus solution. This solution offers ready-to-use features that facilitate Prometheus monitoring and scalability, all while maintaining compatibility with open-source standards such as Thanos, Cortex, Grafana and so on.
Prometheus Monitoring with Atatus
Atatus is an easy-to-use observability platform, using which you get a complete view of your applications' health. Atatus not only captures errors and performance data but also streamlines incident management, making it a seamless experience. This combination empowers you to quickly spot and resolve issues, ensuring your systems run smoothly and efficiently.
With Atatus, you can monitor your infrastructure's scalability and performance in real-time. It offers deep insights into your applications and intelligent alerting, ensuring that you catch problems before they impact your users.
This synergy enables you to efficiently identify and address issues, allowing your Prometheus Monitoring strategy to run seamlessly and enabling you to achieve operational excellence effortlessly.
#1 Solution for Logs, Traces & Metrics
![]() APM
APM
![]() Kubernetes
Kubernetes
![]() Logs
Logs
![]() Synthetics
Synthetics
![]() RUM
RUM
![]() Serverless
Serverless
![]() Security
Security
![]() More
More

![Splunk vs Prometheus: A Side-by-Side Comparison [2025 Guide]](/blog/content/images/size/w960/2024/08/Datadog-vs-sentry--13-.png)