AWS CloudWatch Alarms - A Startup Guide
While more businesses are moving their apps to the cloud, they must also ensure that cloud-based services such as Amazon Web Services (AWS) and other resources remain available.
So, how can you make sure these cloud services aren't turned off? You can accomplish this using a tool like Amazon CloudWatch, which monitors applications. What is AWS CloudWatch will be the subject of this article.
Table of Contents
- What is AWS?
- How does CloudWatch work?
- What are the steps for creating CloudWatch dashboards?
- What are the steps for creating and configuring CloudWatch Alarms?
- Benefits of CloudWatch
- Conclusion
What is AWS?
Amazon Web Services is simplified as AWS. Amazon Web Services (AWS) is the world’s most comprehensive and broadly adopted cloud platform, offering over 200 fully featured services from data centers globally.
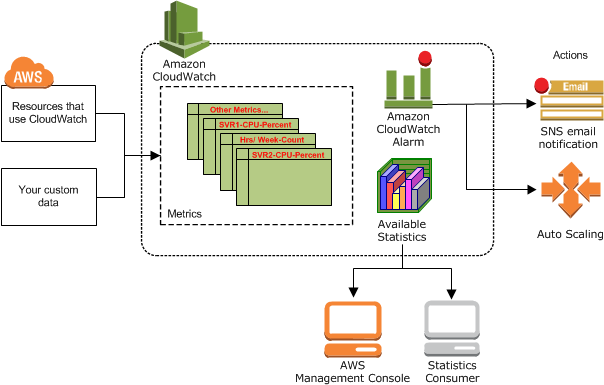
Amazon CloudWatch is an AWS component that enables cloud-based monitoring for AWS resources such as EC2 instances, elastic load balancers, and auto-scaling groups, as well as other Amazon services such as Amazon S3, SNS, SQS, and RDS.
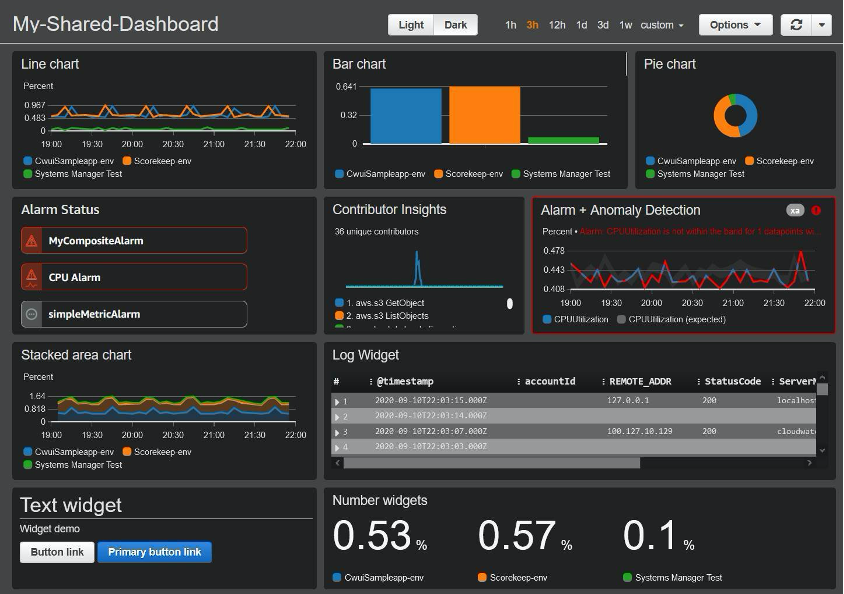
A consolidated dashboard allows Amazon administrators to effortlessly monitor various AWS instances and apps.
CloudWatch can also be used for the following tasks:
- Any irregularity in your cloud environment will be detected.
- Make your own dashboards with analytics from the AWS services you use.
- Create and configure alarms to track AWS metrics and trigger automatic actions.
- Gain total visibility into the performance of your applications, the use of AWS resources, and the overall health of your business.
How does CloudWatch work?
CloudWatch is largely responsible for the following four tasks:
1. Gather data and logs:
CloudWatch collects data and logs from all of your AWS services in the first stage (for example, AWS EC2 instances). These data are retrieved from the repository by CloudWatch. Custom metrics entered into the repository can also be included.
Amazon API Gateway, AppStream version 2.0, Amazon Athena, and Amazon CloudFront are some of the AWS services that publish CloudWatch metrics.
2. Data should be monitored and visualised:
Then, using CloudWatch dashboards, CloudWatch monitors and visualises this data, giving you a single unified view of all your AWS apps, resources, and services (running in premise or on the cloud).
You can also use your collected metrics and logs to create a visual representation of your resources' overall health and current performance.
3. Any changes will be met with an automated response.
CloudWatch now uses alerts to trigger an automated response to any operational changes. You can set up an alert to start or stop an EC2 instance if certain circumstances are met, for example. Alarms can also be used to start Amazon EC2 auto-scaling and Amazon SNS.
You can set up automated actions like auto-scaling when a defined alert is activated.
4. Examine your data.
The final stage is to evaluate and visualise the data you've collected in terms of metrics and logs, which can help you gain more insight and comprehension. CloudWatch Metric Math allows you to undertake real-time analysis, allowing you to delve deeper into your data.
What are the steps for creating CloudWatch dashboards?
Amazon CloudWatch dashboards offer configurable views of all your AWS resources, even those in multiple AWS regions. You can establish an infinite number of CloudWatch dashboards on your AWS account as an AWS administrator.
You may make the dashboard using the following tools:
- CloudWatch's dashboard.
- PutDashboard is an API for creating a dashboard.
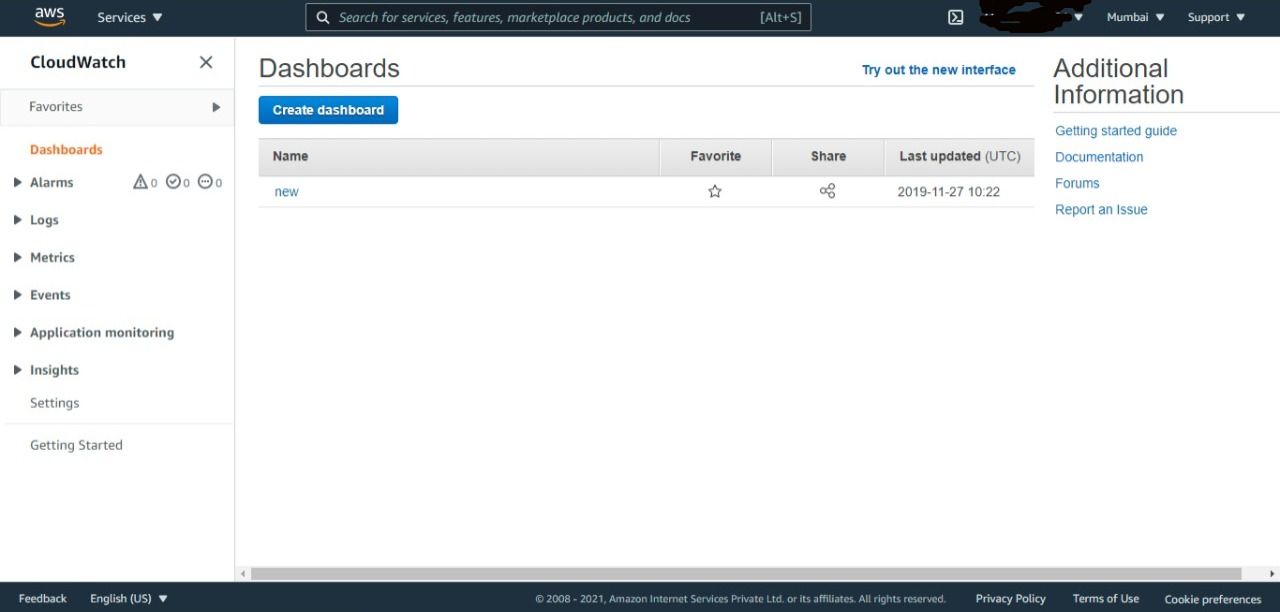
Using the CloudWatch console, you may establish a CloudWatch dashboard as follows:
- Log in to CloudWatch and open the console.
- Click Dashboards > Create dashboard from the navigation pane.
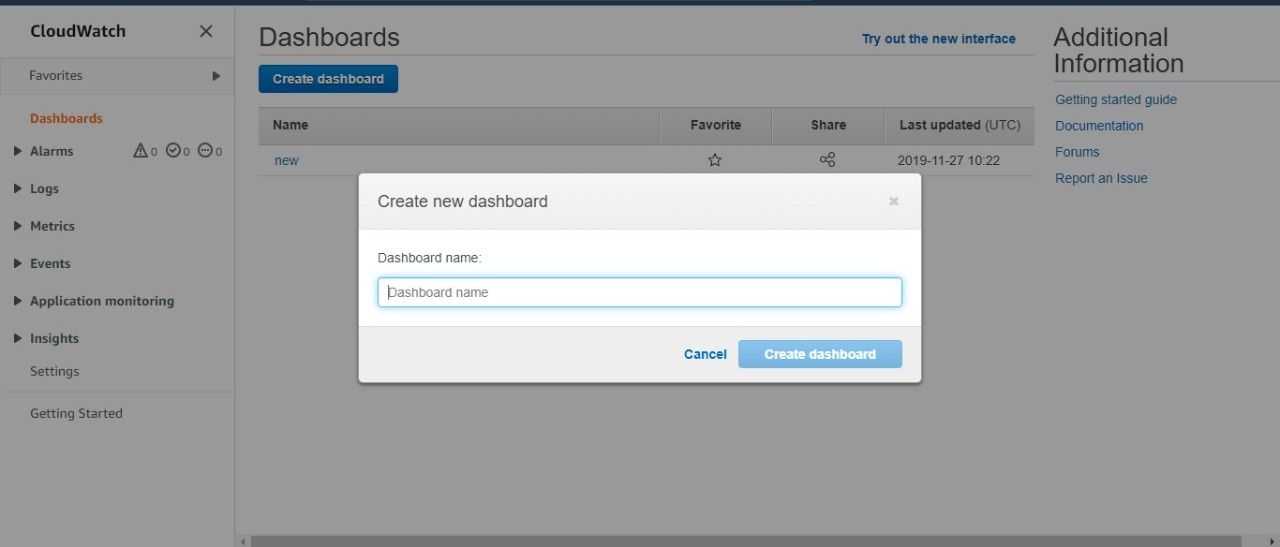
- Type your dashboard name into the "Create new dashboard" box that displays, then click "Create dashboard."
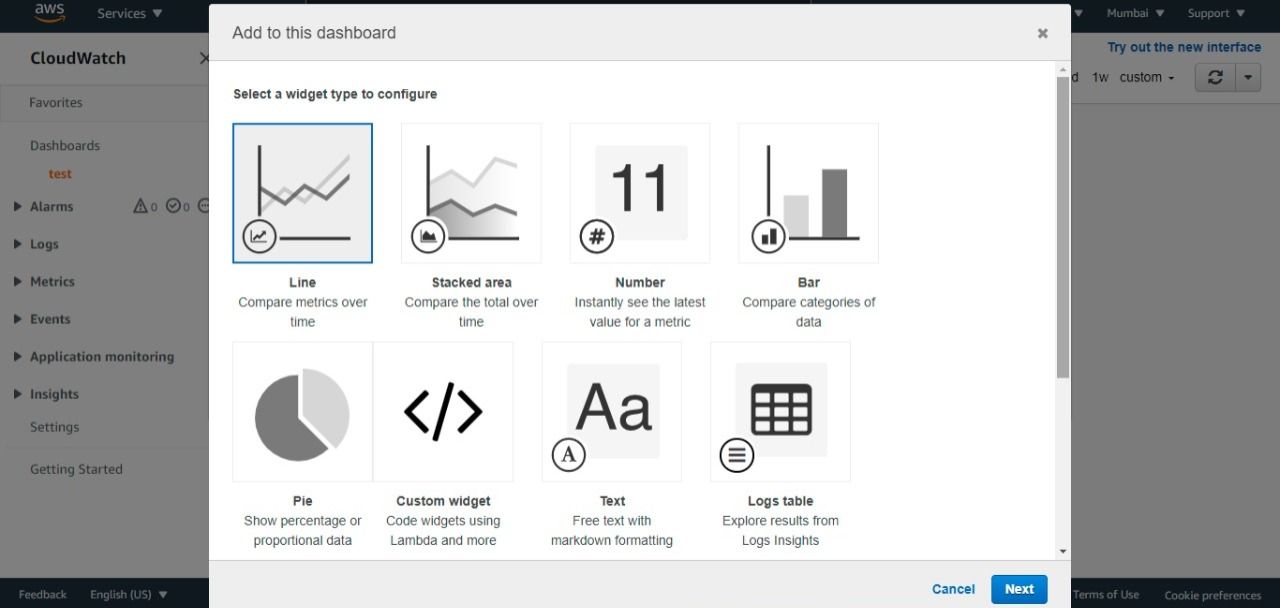
- In the "Add to this dashboard" box, Select the the type of widget you want: line, stacked area, number, and so on. Then select Next.
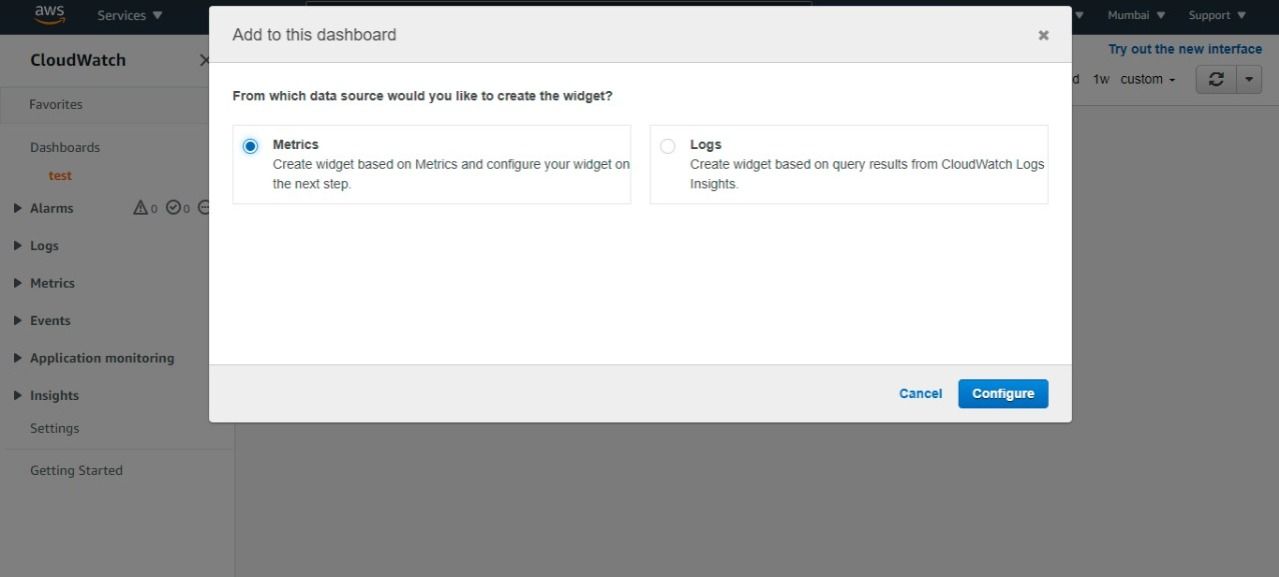
- To add a graph to your dashboard, select Line or Stacked area and then Configure. To create the widget, choose a Data source(Metrics or Logs). Then click Configure.
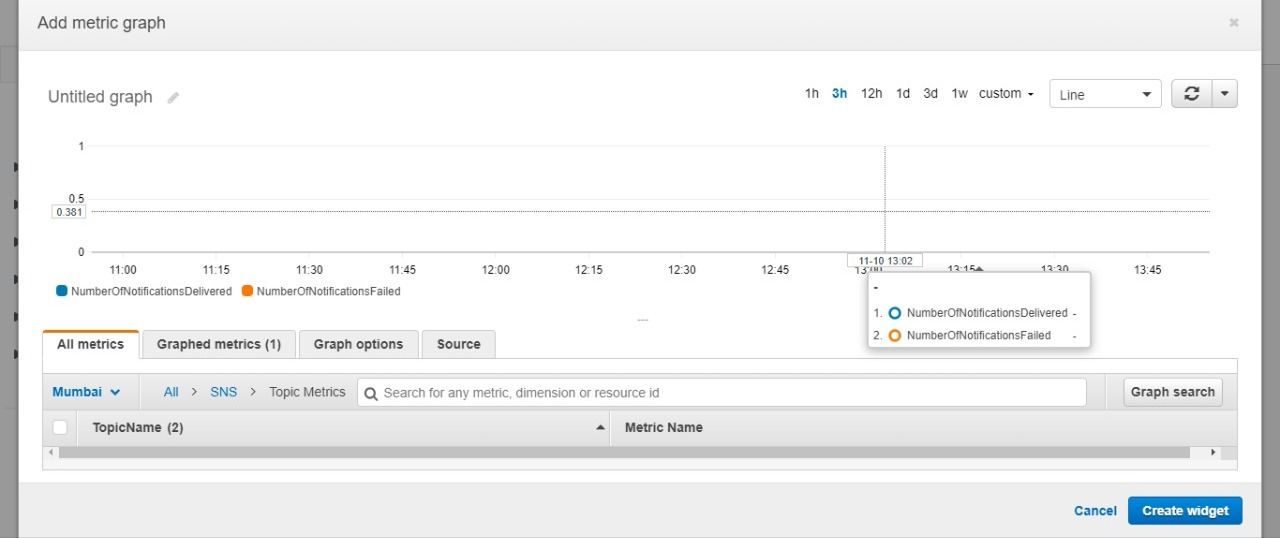
- From the Add metric graph dialogue box, select metrics to include in the graph, then click Create widget.
- To add a number displaying a metric to the dashboard, Select Number and then Configure. From the Add metric graph dialogue box, select metrics to include in the graph, then click Create widget.
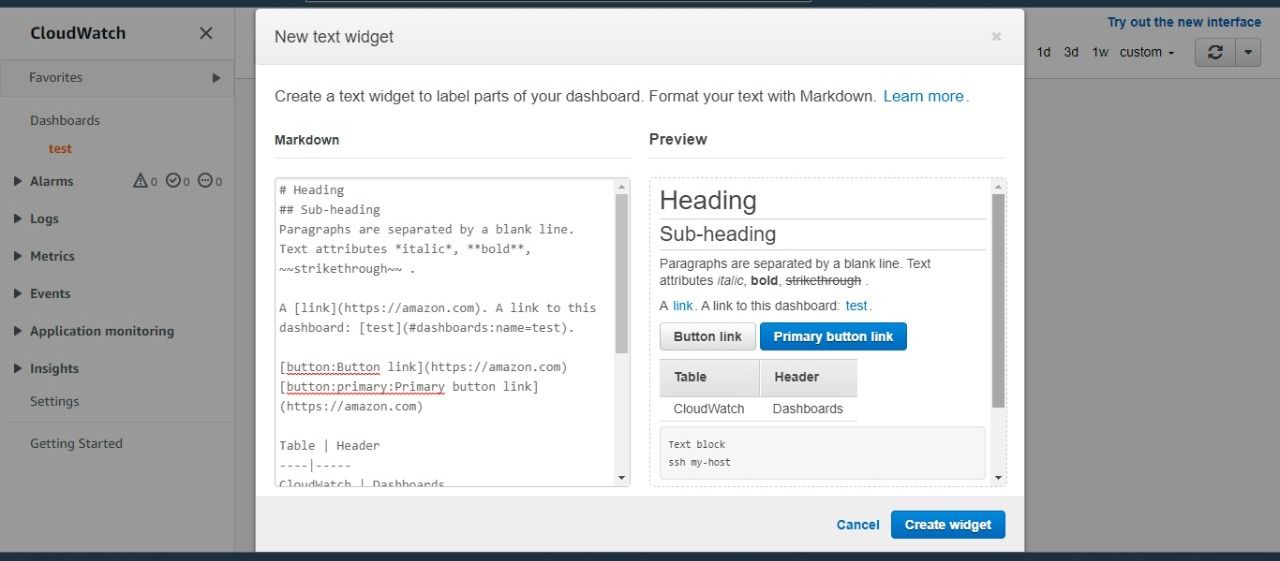
- To add a text block to your dashboard, Select Text and then Configure. Choose Markdown from the New text widget dialogue box, then add and format your text, then click Create widget.
- If necessary, repeat Step 4 to add more dashboard widgets.
- Save your dashboard.
The PutDashboard API call can also be used to create or change CloudWatch dashboards. Some of the most typical parameters used with this API are as follows:
- DashboardName (mandatory): defines the name of the dashboard in String format.
- DashboardBody (mandatory): contains all dashboard information, including the widgets that need to be included and where they should be placed on the dashboard.
What are the steps for creating and configuring CloudWatch Alarms?
You can generate both sorts of alarms using CloudWatch:
Metric alarms track a single metric or a math metric based on a formula.
Composite alarms that are only triggered if all other specified alarms are met.
You can also set an alarm for:
- A single metric's static threshold.
- Detection of anomalies.
- Math expressions in metric.
Here's how to use the CloudWatch console to generate a CloudWatch alarm based on a single metric:
- Go to the CloudWatch console and log in.
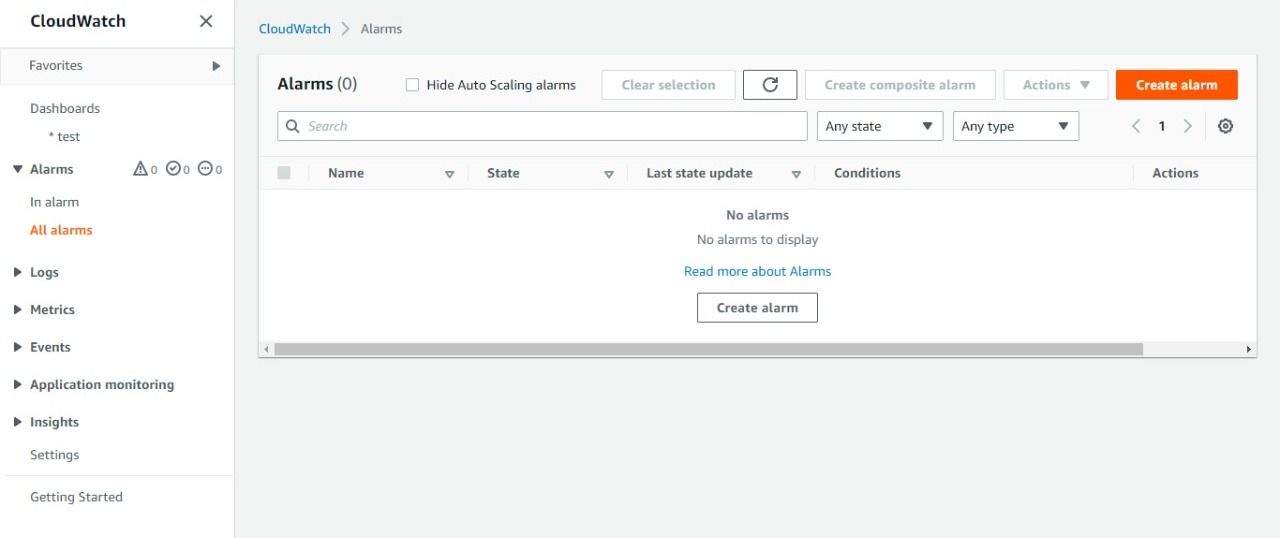
- Select Alarms > All Alarms > Create Alarm from the navigation window.
- Select Metric from the tab.
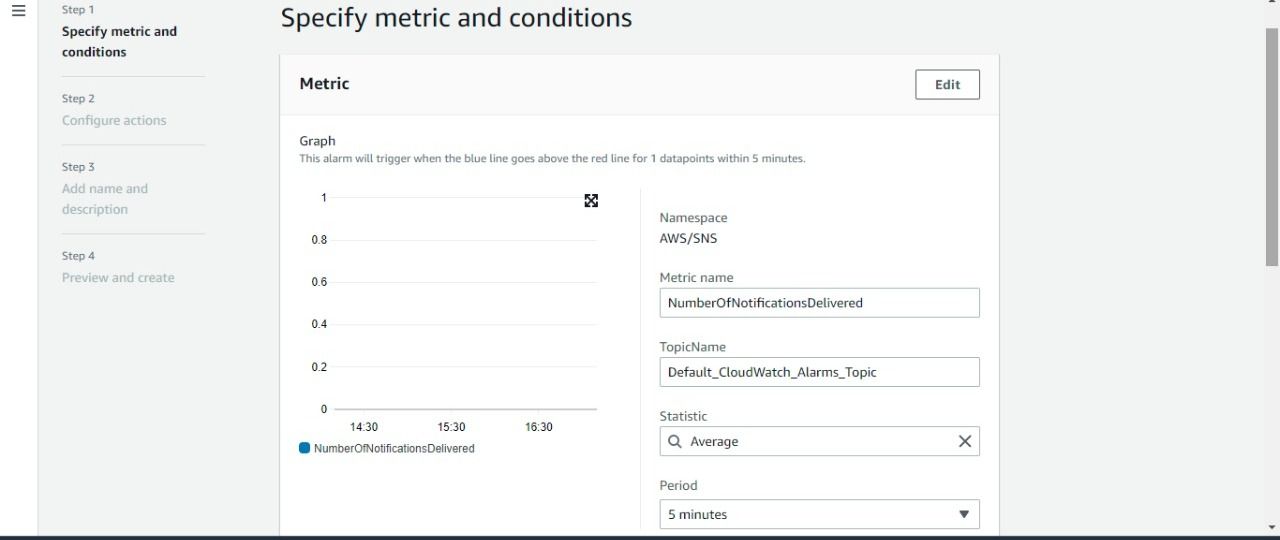
- Select the service namespace that holds the desired metric. Continue to select alternatives as they appear to reduce the number of options available. Select the check box next to the metric you want from the list of metrics that appears.
- Enter the name of a metric, dimension, or resource ID in the search box and click Enter. Then select one of the outcomes and keep going till you get a list of metrics. Check the box next to the metric you want to use.
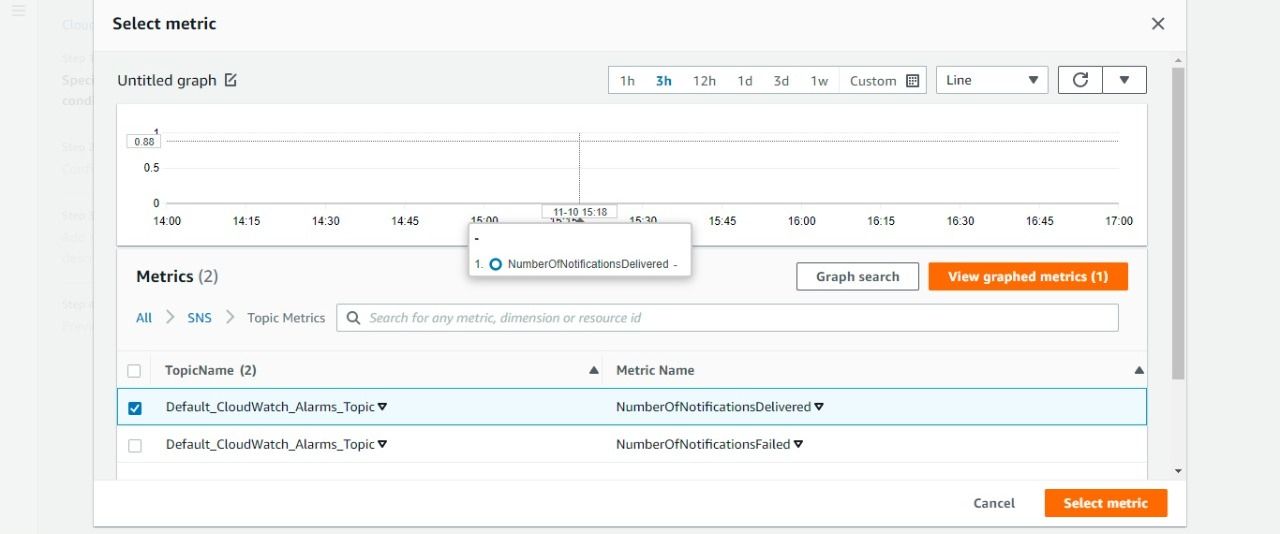
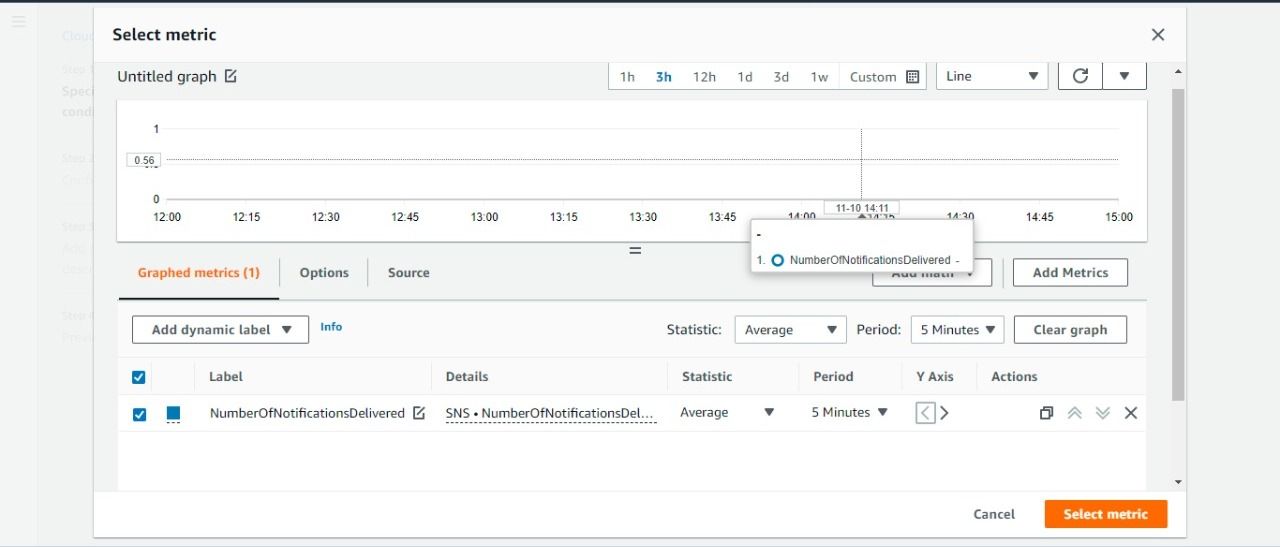
- In Graphed metrics, select any of the available Statistics or Predefined or Custom percentile(For example: Average, Sum, p90..) from Statistics.
- Select the alarm's evaluation period from Period.
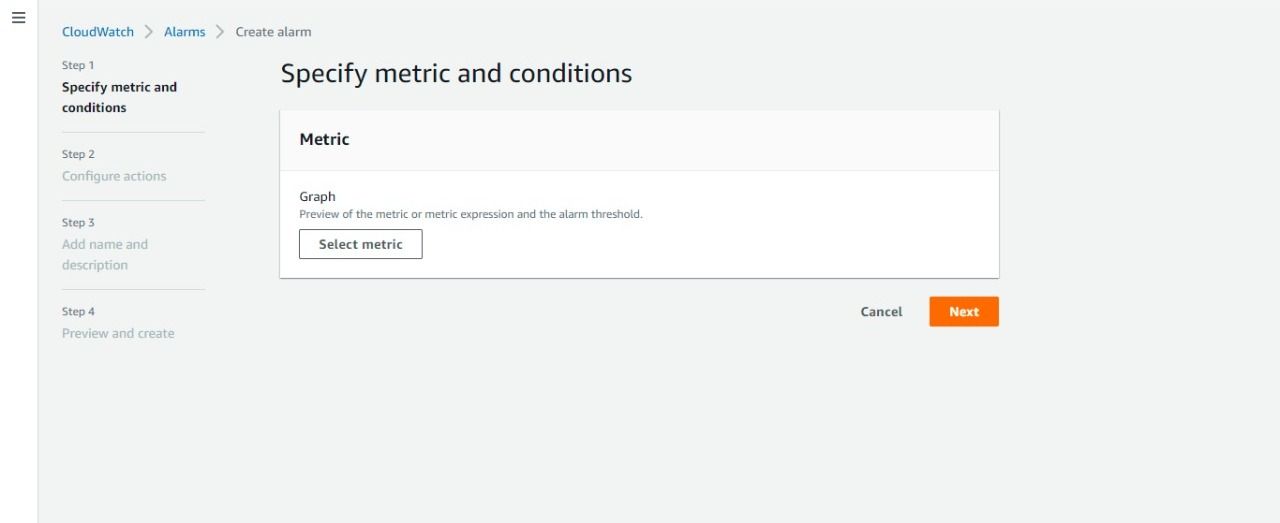
- Click Select metric to go to the Specify metric and conditions screen, which displays all of the information about the metric and statistics you've chosen.
- Then move to the Conditions tab, Select the threshold type and Specify whether the metric must be larger than, less than, or equal to the threshold for Whenever metric is. Set the threshold value.
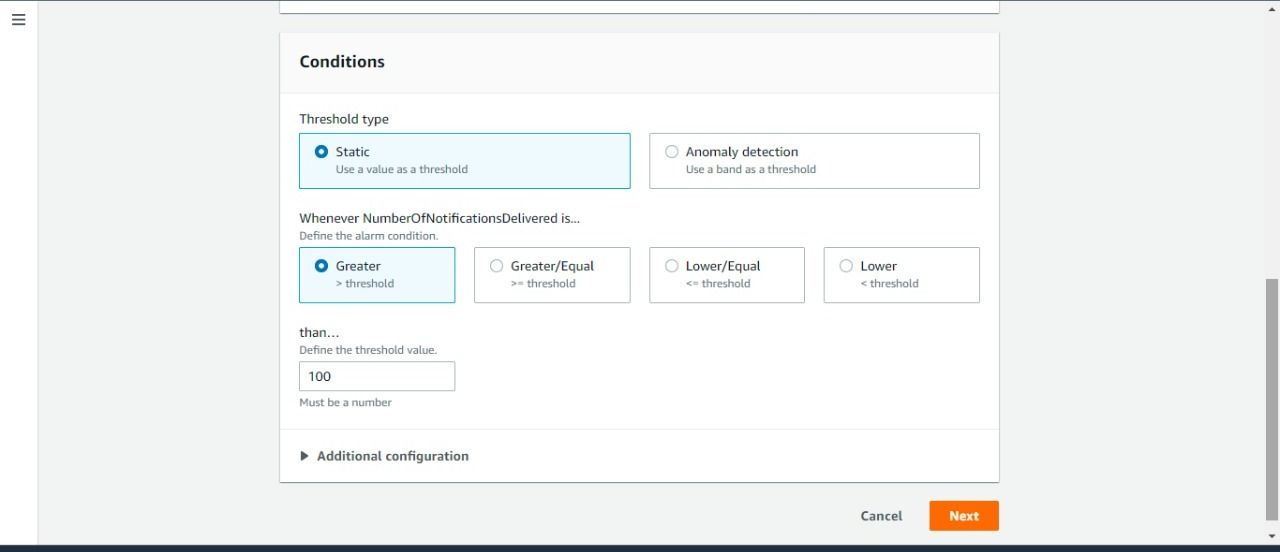
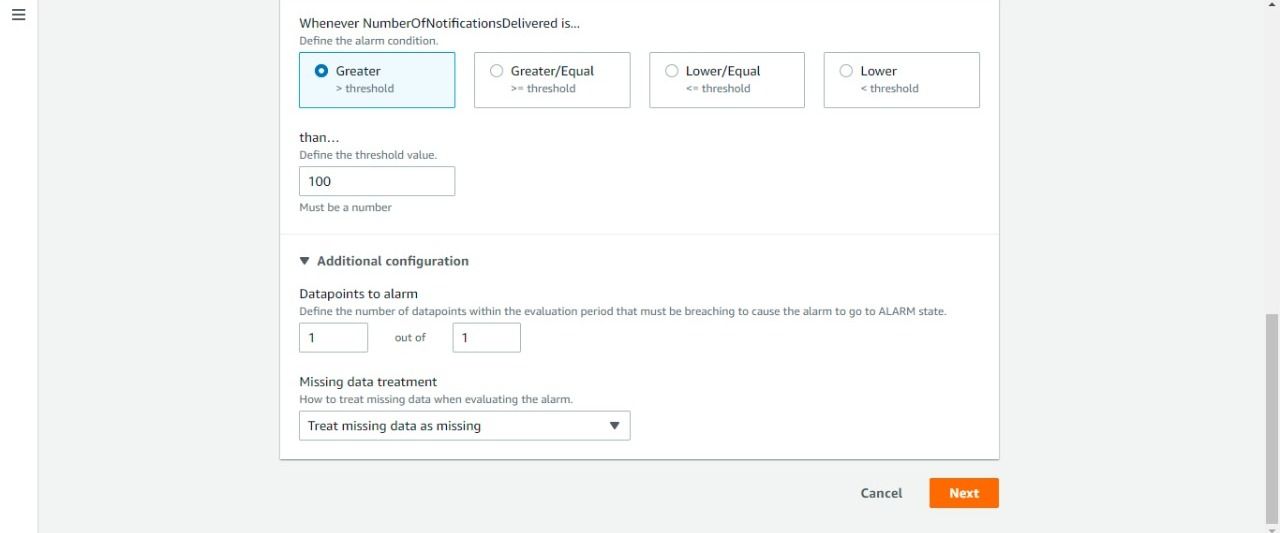
- Select Additional configuration tab, Set the number of assessment periods (or data points) required to trigger the alarm in the Datapoints to Alarm field.
- If the two values here match, you'll get an alarm that goes into ALARM mode if that many periods are breached in a row.
- To make a M out of N alarm, enter a smaller number for the first value than you do for the second.
- Configure the alarm settings for any missing data points from Missing data treatment.
- Next should be selected.
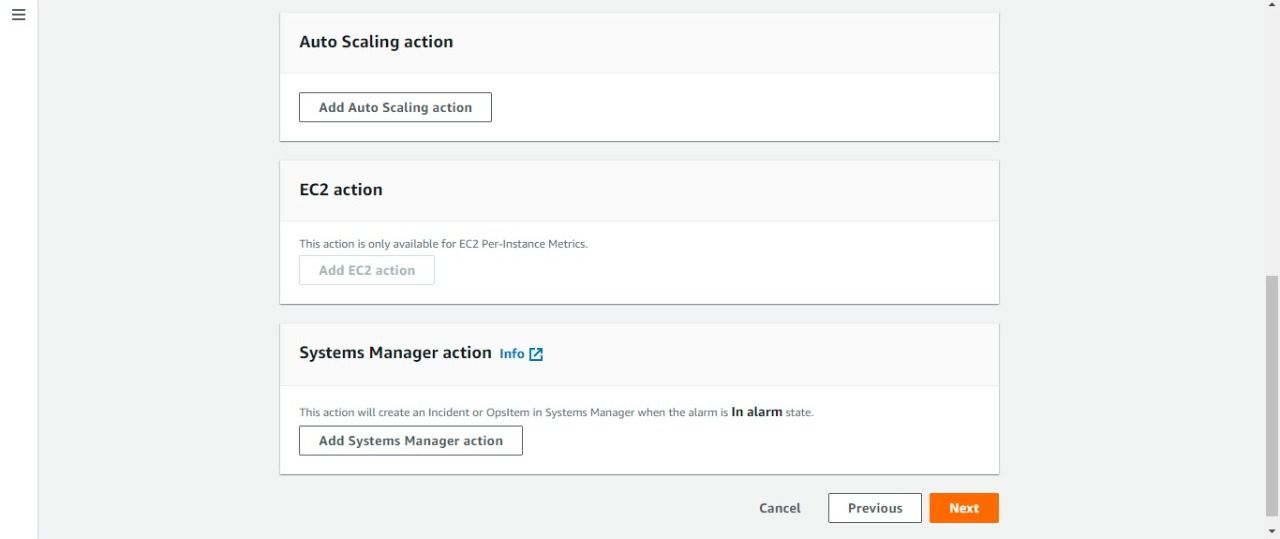
- In Configure actions, Select the SNS subject that should be notified when the alarm is activated from the Notification tab. Choose Add notification to make the alarm deliver several alerts for the same or various alarm conditions.
- Select Remove if you don't want the alarm to give you any notifications.
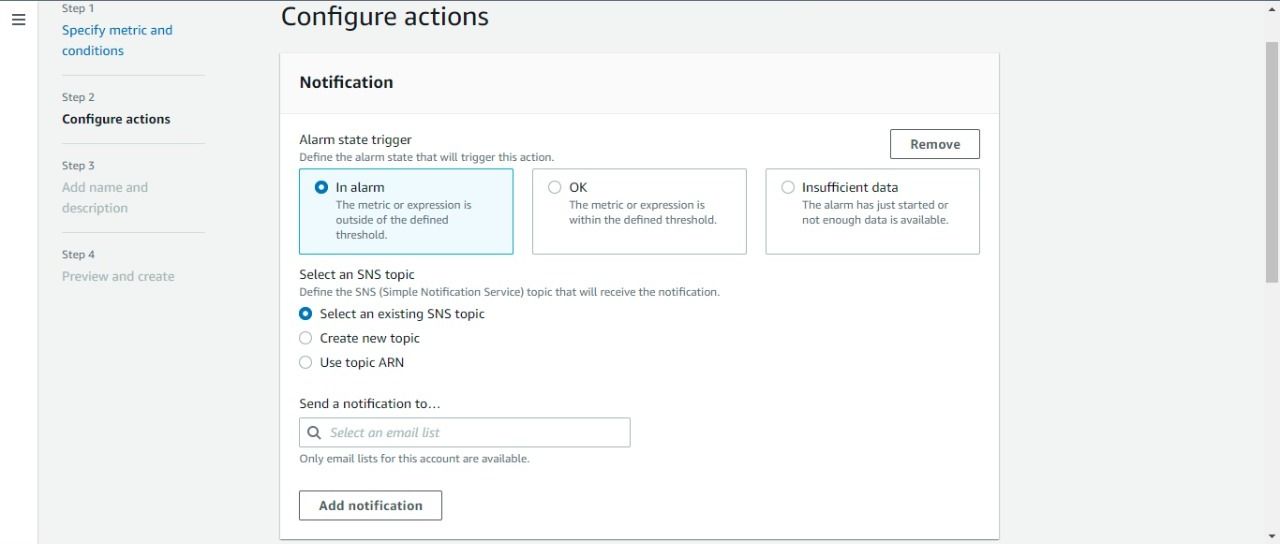
- If you want the alarm to execute auto-scaling or any other EC2 activities, select the appropriate parameters.
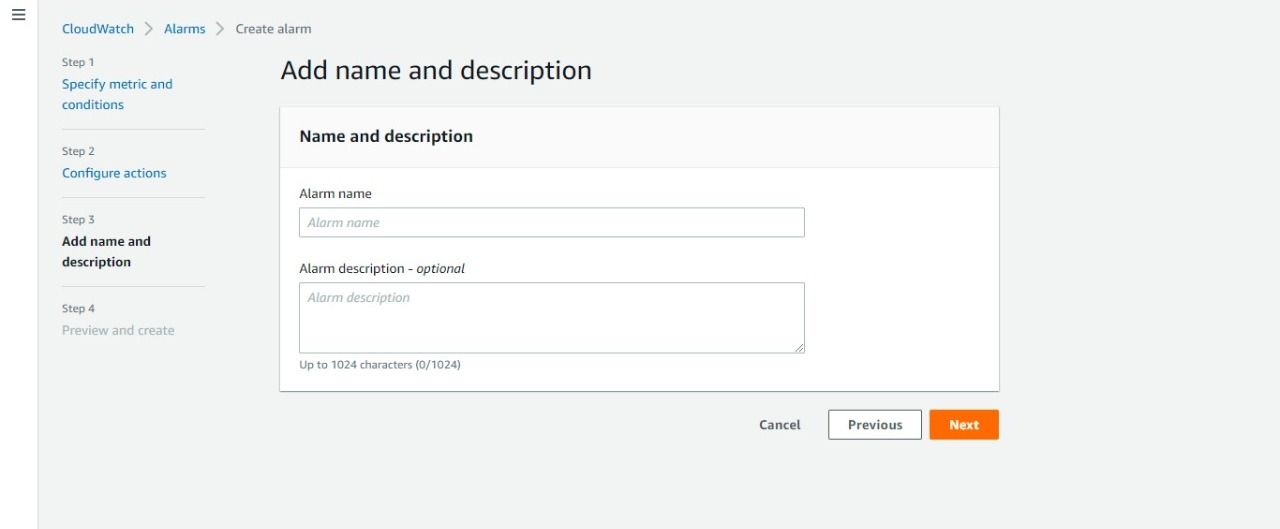
- Enter a Name and description for the alarm. The name must contain only ASCII characters. Then Click Next.
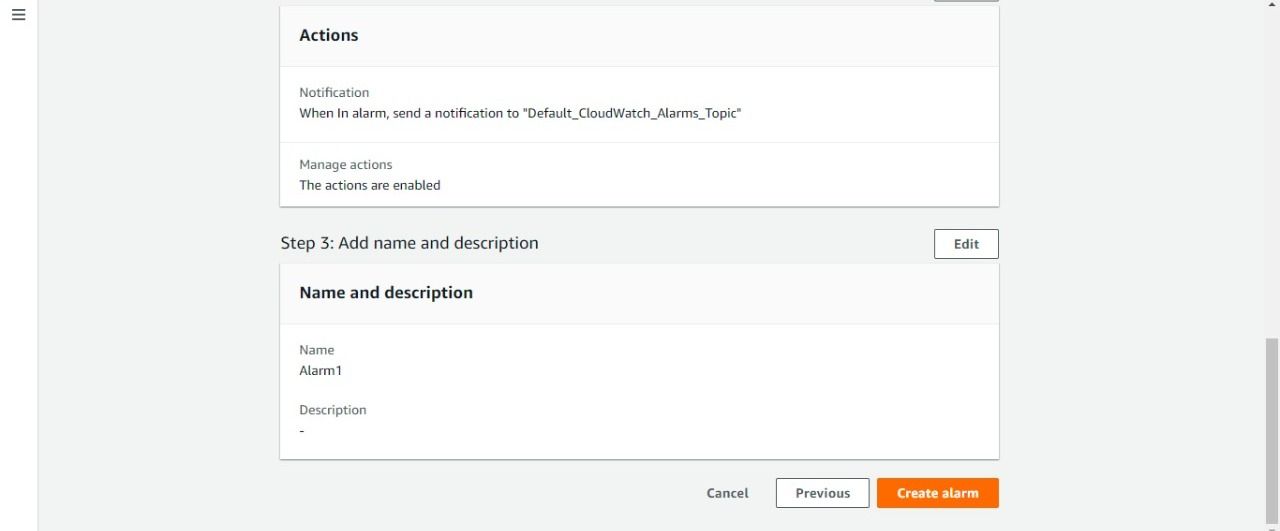
- Click Create alarm after previewing the alarm settings in the Preview and create tab.
Here's how to use the CloudWatch console to create a CloudWatch alarm based on anomaly detection:
- Complete the Steps from Create Alarm to Specify metric and conditions as directed above.
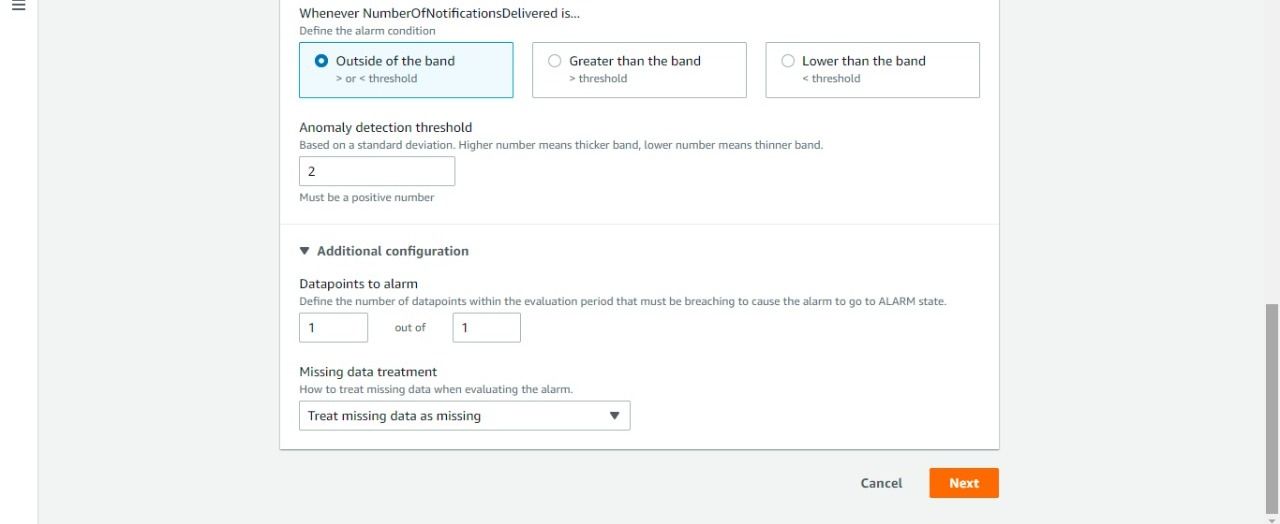
- In Conditions tab, Select Anomaly detection, Specify the range of metric values that can trigger the alarm in the Whenever metric column.
- Enter the number of anomalies to detect.
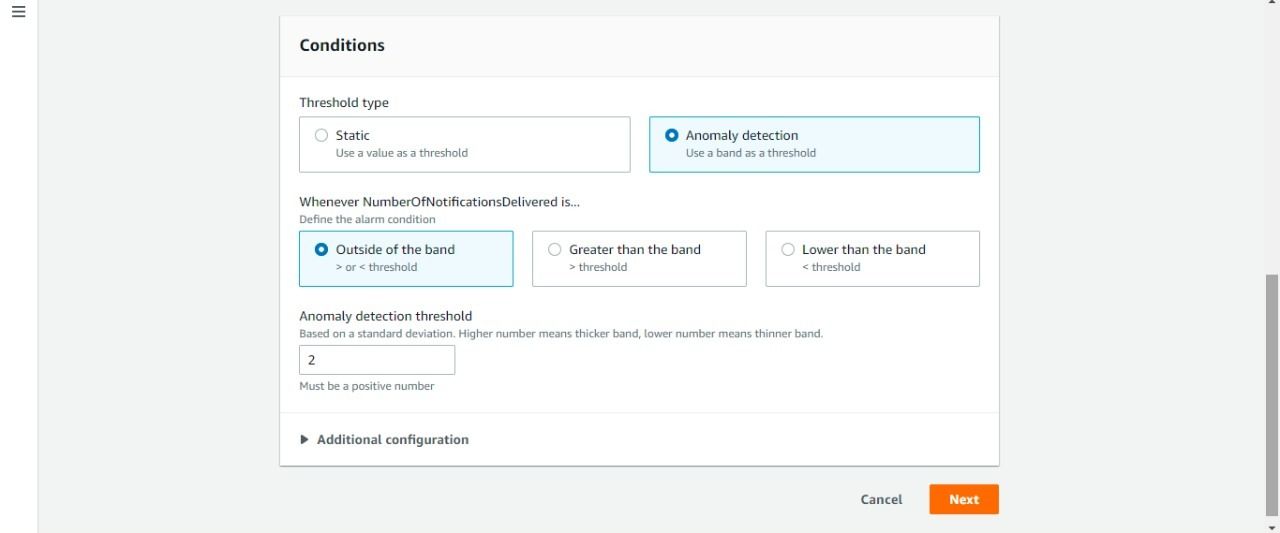
- Select Additional configuration, Set the number of assessment periods (or data points) required to trigger the alarm in the Datapoints to Alarm field.
- Configure the alarm settings for any missing data points from Missing data treatment.
- Next should be selected.
- Create alarm by using remaining steps as outlined above(from Configure actions).
Finally, here's how to use the CloudWatch console to create a CloudWatch alarm based on a metric math expression:
- Complete the Steps from Create Alarm to Specify metric and conditions as directed above.
- To add a new row for the expression, click Add a math expression.
- In the new row's Details column, write a math expression.
- Under the "Id" column, enter a metric or another mathematical expression.
- If necessary, add more math expressions.
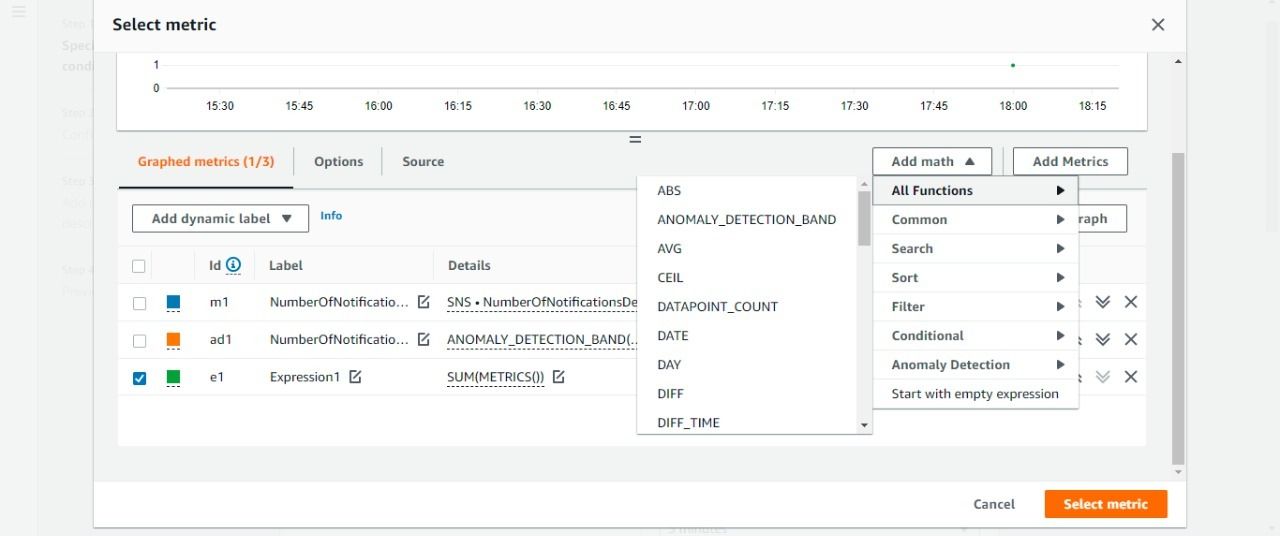
- Click Select metric to go to the Specify metric and conditions screen, which displays all of the information about the metric math expression you entered.
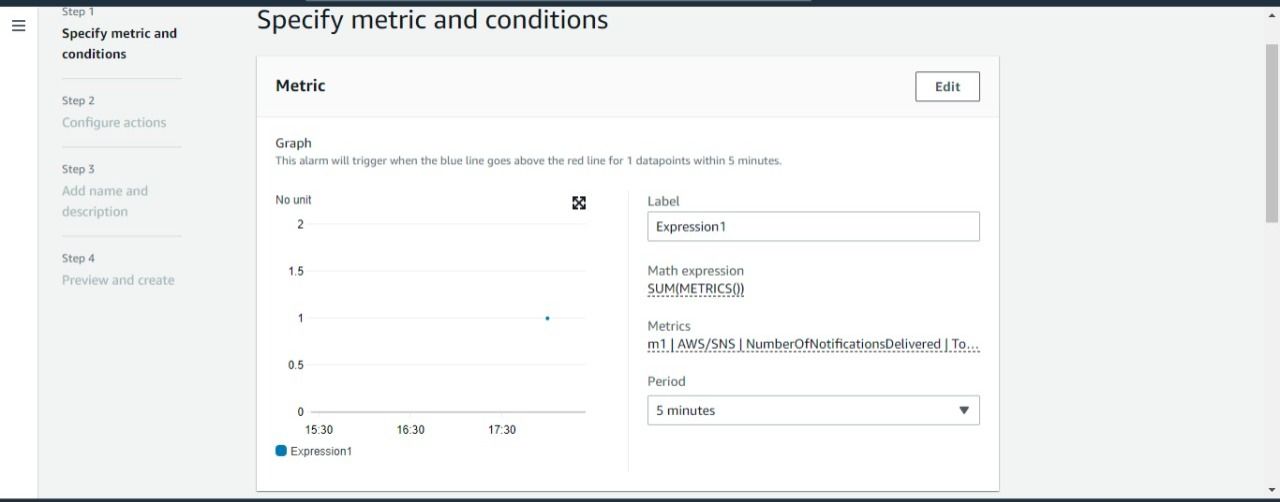
- Create alarm by using remaining steps as outlined above(from Conditions tab).
Benefits of CloudWatch
Many companies use AWS resources and apps, and as a result, they benefit from CloudWatch in a variety of ways. Some of the advantages of adopting CloudWatch are stated below:
- The ease with which CloudWatch log data may be sent to Amazon Elasticsearch and processed in real time.
- Utilization of all available resourcesAWS EC2 instances allow for simple system integration.
- Stability and dependability are two terms that are often used interchangeably.
- Usability is a term that refers to how easy something is to use.
- Monitoring AWS resources effectivelyAllows for the notification of anomalies discovered using Amazon SNS.
Conclusion
You can monitor cloud-based applications and other AWS services using the Amazon CloudWatch service, as well as troubleshoot any performance concerns. AWS administrators now have total visibility over apps and services running in the same or separate AWS regions thanks to a single, unified dashboard.
With Atatus, you can keep track of your entire application.
Atatus delivers a suite of real-time performance monitoring and improvement tools for your frontend, backends, logs, and infrastructure applications. Our technology can collect millions of performance data points from your apps, allowing you to quickly rectify problems and provide excellent digital user experiences.

Atatus delivers a full view of your application, including how it works, where performance bottlenecks exist, which users are the most impacted, and which faults break your code for your frontend, backend, and infrastructure.
#1 Solution for Logs, Traces & Metrics
![]() APM
APM
![]() Kubernetes
Kubernetes
![]() Logs
Logs
![]() Synthetics
Synthetics
![]() RUM
RUM
![]() Serverless
Serverless
![]() Security
Security
![]() More
More