Top 8 Datadog Alternatives & Competitors in 2026: An Honest Comparison
Datadog was founded in 2010 by Olivier Pomel and Alexis Lê-Quoc. The company was built to reduce the friction between system administration and development teams.
In 2019, Datadog raised about $648 million at a valuation of about $7.2 billion. Its success has been driven by its real-time observability platform for complex cloud environments. As the market has matured, it has faced growing competition from other observability vendors
The company's success can be attributed to its commitment to providing comprehensive, real-time observability across complex, dynamic environments.
However, as the tech landscape continually evolves, several contenders have emerged, vying for a share of the market that Datadog has dominated.
What's in this article?
- Why Engineering Teams Are Looking for Datadog Alternatives?
- What to Evaluate When Choosing a Datadog Alternative?
- Detailed Top 8 Datadog Competitor Reviews
- Why Atatus is the Best Datadog Alternative in 2026?
Why Engineering Teams Are Looking for Datadog Alternatives?
Datadog is a powerful platform but powerful doesn't always mean the right fit. It enables you to monitor, troubleshoot, and optimize cloud-based application performance all the way down to a single line of code or unique customer requests. The platform provides a condition of data in built-in dashboards that are visually appealing to the wealth of the application, including a flame chart for trace views.
For unique requests, it can be difficult for the normal user to create customized dashboards from scratch as it is built for heavy users. New user onboarding may take a while for those who new to use the entire concept and who are not advanced as some of their peers.
Customer Reviews
- G2 – 4.2/5 stars
- Crozdesk – 4.2/5 stars
- Capterra – 4.6/5 stars
It lacks in the speed of monitoring agents and security that’s why it has heavy competitors in the market. In this article, we delve into the top seven Datadog competitors to keep an eye on.
Here are the most common reasons teams start evaluating alternatives:
- Unpredictable Billing: Datadog charges per host, per product module, per custom metric. A mid-size team can easily hit $50k–$200k/yr.
- Cost Creep at Scale: As you add services, containers, and log volume, bills compound fast with little warning.
- Steep Learning Curve: New engineers can take weeks to get productive. Onboarding docs are extensive but fragmented.
- Alert Fatigue: Default alerting is noisy. Teams report spending more time triaging false positives than fixing real issues.
- Support Response Times: Enterprise SLAs are costly add-ons. Community support is slow for complex integration issues.
- Vendor Lock-in: Custom agents and proprietary query languages (DQL) make migration painful after year two.
See how Atatus compares to Datadog on every dimension →
APM · Logs · RUM · Synthetics · Infrastructure · Kubernetes. One price. No surprises.
What to Evaluate When Choosing a Datadog Alternative?
Not every observability platform is built for every team. Before you commit to a migration, evaluate these criteria against your specific stack and team size:
- Coverage: Does it cover APM, RUM, logs, traces, synthetics, and infrastructure in a single agent?
- Pricing model: Per-host, per-GB, per-seat, or flat-rate? How does it scale with your infra?
- Ease of setup: Can an engineer instrument a service in <30 minutes without reading a 200-page doc?
- Kubernetes & container support: Native K8s metrics, pod-level traces, and namespace dashboards out of the box?
- AI & anomaly detection: Intelligent baselines, root-cause correlation, and AIOps capabilities?
- OpenTelemetry support: Vendor-neutral instrumentation to avoid lock-in?
- Support quality: SLA commitments, dedicated CSM, and active community?
- Migration effort: Can you bring existing dashboards, alerts, and integrations with you?
Detailed Datadog Competitor Reviews
Here is the competitor list:
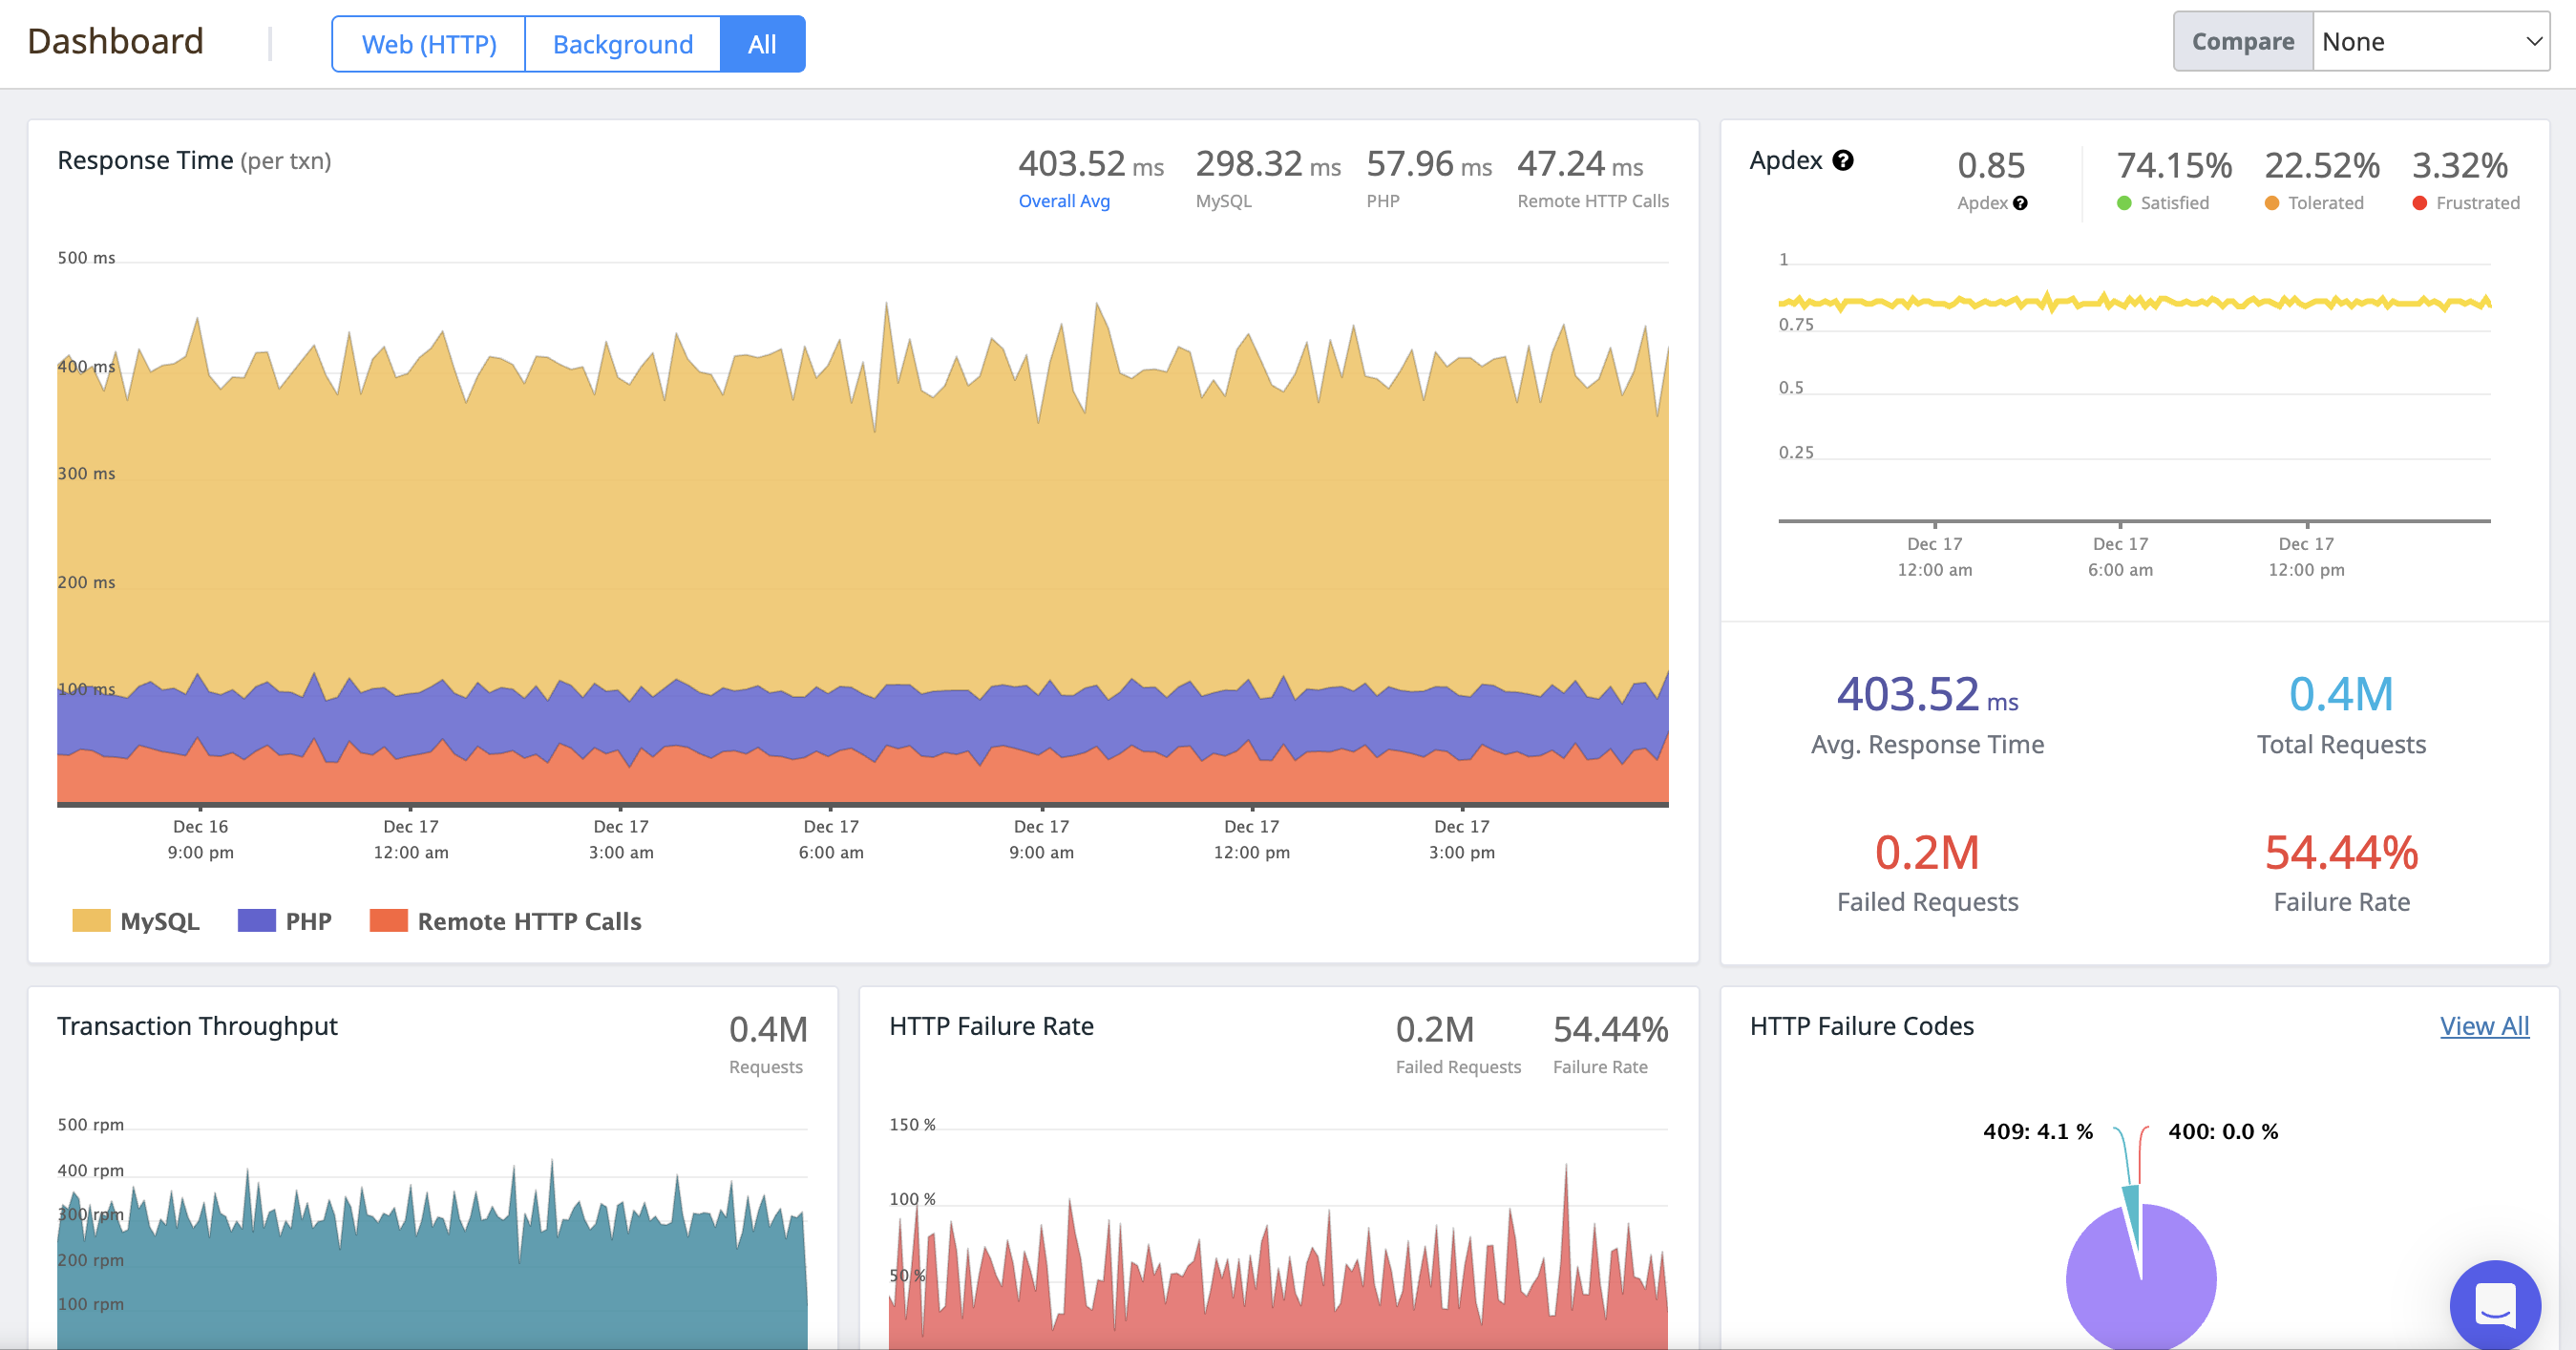
#1 Atatus - Best Overall Datadog Alternative
G2: 4.8/5 · Capterra: 4.8/5 · Crozdesk: 4.8/5
Atatus is a full-stack observability platform that covers APM, Real User Monitoring, Logs, Distributed Tracing, Synthetic Monitoring, Infrastructure Monitoring, and Kubernetes in a single unified platform with straightforward pricing. It is rated the #1 alternative to Datadog on G2 for ease of use and ROI.
Strengths
- Unified full-stack coverage (no product sprawl)
- Predictable all-in pricing
- 30-minute onboarding for most stacks
- Correlated APM + logs + RUM out of the box
- Outstanding G2 support ratings
- OpenTelemetry compatible
Limitations
- Smaller 3rd-party integration ecosystem vs Datadog (600+ vs 700+)
- Less mature AI/ML anomaly detection than Dynatrace Davis
- On-prem option less flexible than Splunk
Best For
- Teams migrating off Datadog or New Relic
- Startups and scale-ups that need enterprise-grade observability without enterprise pricing
- Engineering teams without a dedicated observability engineer
Ready to try Atatus? 14-day free trial. No credit card.
Full platform access from day one. Real support from day one.
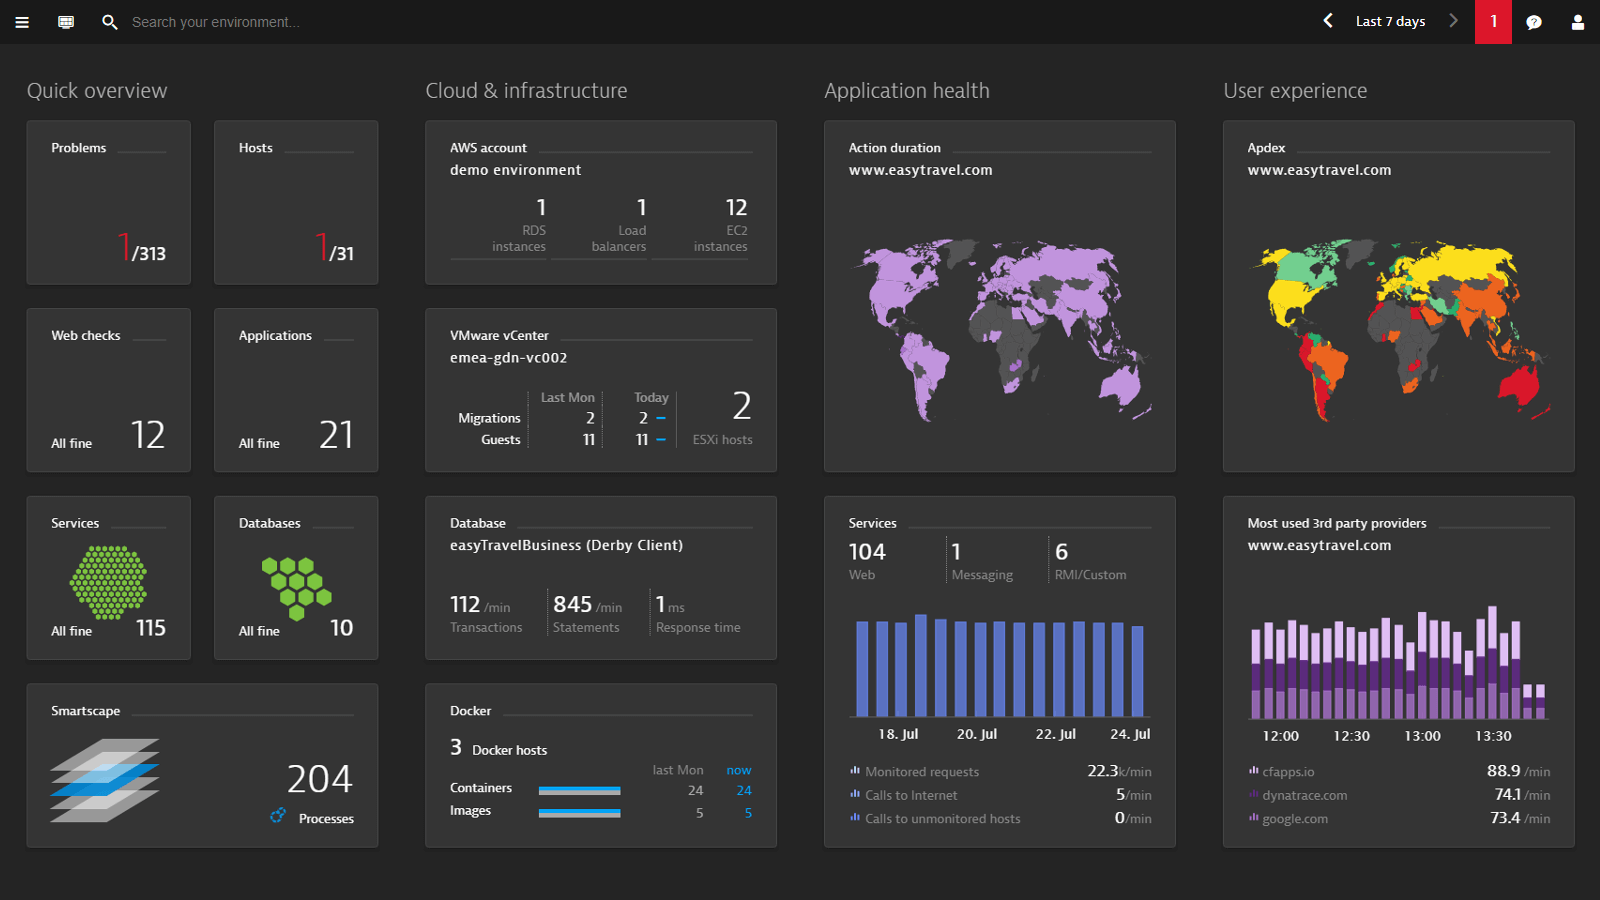
#2 Dynatrace - Best for Enterprise AIOps
G2: 4.5/5 · Capterra: 4.4/5
Dynatrace is a powerful enterprise-grade observability platform renowned for its Davis AI, which delivers automated root-cause analysis and anomaly detection. It covers full-stack observability with no blind spots but comes with significant cost and onboarding complexity.
Strengths
- Davis AI - best-in-class automated RCA
- Full-stack auto-discovery via OneAgent
- Enterprise compliance features (SOC 2, HIPAA, GDPR)
- Excellent Kubernetes and cloud-native coverage
Weaknesses
- High licensing costs which is comparable to or exceeding Datadog
- Complex setup; requires dedicated admin time
- Steep learning curve for DQL query language
- Less flexible for teams without enterprise budgets
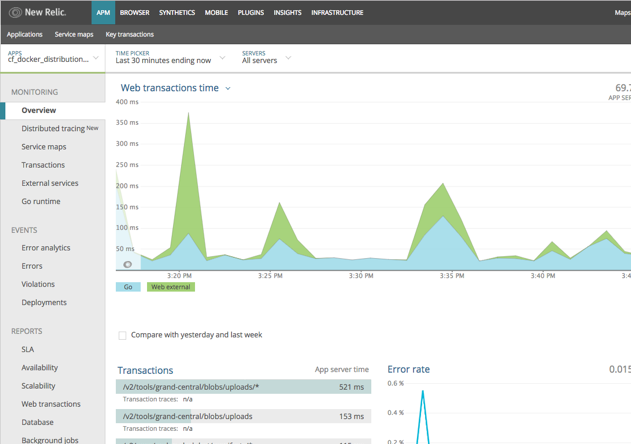
New Relic - Best for Data-Heavy Teams
G2: 4.2/5 · Capterra: 4.5/5
New Relic's consumption-based pricing model makes it attractive at low data volumes but can become expensive as telemetry data grows. It's an excellent full-platform option for teams already fluent in NRQL.
Strengths
- Generous free tier (100GB/mo ingest)
- Broad platform coverage (APM, browser, mobile, infra)
- NRQL is powerful for data-savvy teams
- Strong New Relic AI (NRAI) features
Weaknesses
- Ingest costs scale rapidly for high-volume logs/traces
- NRQL learning curve is steep for ops teams
- Historical billing/support complaints on G2
- Recent org restructuring created uncertainty
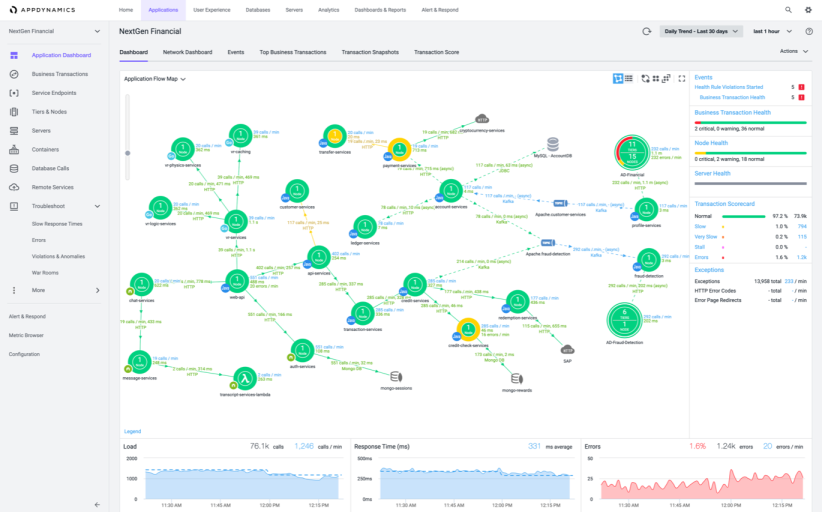
#4 AppDynamics - Best for Cisco-Stack Enterprises
G2: 4.2/5 · Capterra: 4.5/5
AppDynamics (now part of Cisco) offers strong APM and business transaction monitoring, particularly for large enterprises in finance, media, and government. It excels at tying application performance directly to business KPIs.
Strengths
- Business transaction monitoring - unique capability
- Deep .NET and Java APM maturity
- Strong Cisco ecosystem integration
- On-premise and SaaS deployment options
Weaknesses
- Very high pricing - enterprise-only in practice
- Complex onboarding and agent configuration
- Synthetic monitoring and RUM are limited vs peers
- Cisco acquisition has slowed product innovation
#5 LogicMonitor - Best for MSPs
G2: 4.5/5 · Capterra: 4.7/5
LogicMonitor is a cloud-based infrastructure monitoring platform purpose-built for managed service providers (MSPs) and enterprise IT. It delivers automated discovery with 2,000+ pre-built integrations.
Strengths
- Purpose-built for MSPs with multi-tenant support
- Extensive integration library (2,000+)
- Strong network and infrastructure monitoring
- Customizable dashboards and RBAC
Weaknesses
- Limited APM depth vs Datadog or Atatus
- No native RUM or distributed tracing
- Pricing opaque for non-MSP teams
#6 Sumo Logic - Best for Log Analytics
G2: 4.3/5 · Capterra: 4.1/5
Sumo Logic focuses on log management, SIEM, and continuous intelligence. It's a solid choice for security and compliance-focused teams that need cloud-scale log aggregation and ML-powered anomaly detection.
Strengths
- Best-in-class log search and analytics
- Strong SIEM / security analytics capabilities
- Multi-cloud support (AWS, GCP, Azure)
- ML-based anomaly detection
Weaknesses
- Not a full APM solution - narrow focus
- RUM and synthetics not natively available
- Pricing model can surprise at log volume
#7 Instana
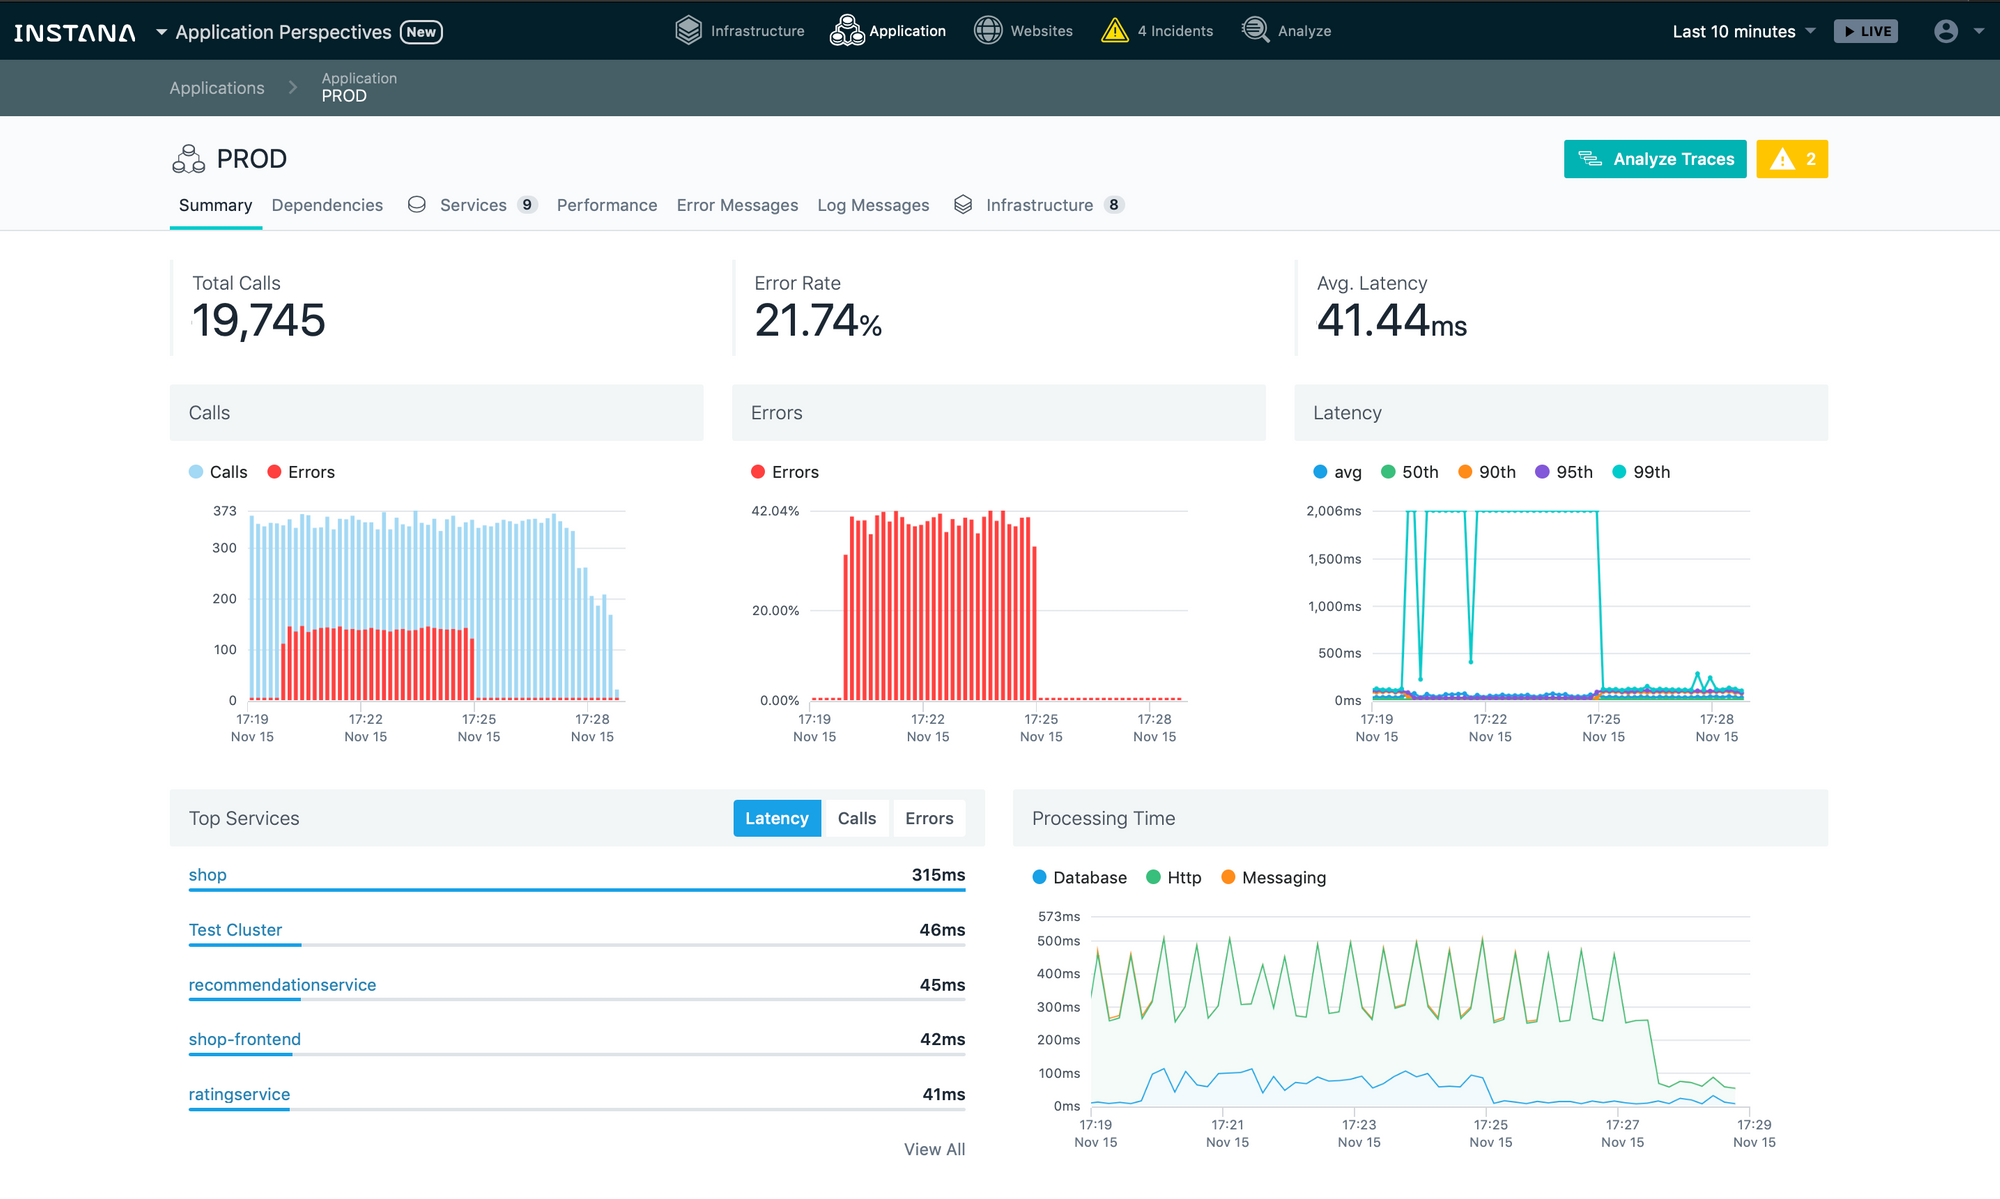
IBM Instana offers automated, continuous APM with no-configuration auto-discovery of services and infrastructure. It's strong for dynamic microservices environments and CI/CD pipelines.
Strengths
- Zero-config auto-discovery - agents self-configure
- 1-second granularity metrics
- Strong microservices and CI/CD pipeline support
- IBM ecosystem integration
Weaknesses
- IBM ownership can slow product release cadence
- Less mature RUM vs Atatus or Datadog
- Mixed Capterra reviews on support quality
- Limited synthetic monitoring
#8 Sentry - Best for Error Tracking
G2: 4.5/5 · Capterra: 4.4/5
Sentry is a developer-first error and performance monitoring tool. It's excellent for catching frontend JavaScript errors and backend exceptions, but it's not a full observability platform.
Strengths
- Best-in-class error tracking with stack traces
- Developer-friendly UX
- Generous free tier
- Strong session replay features
Weaknesses
- Not a replacement for full APM or infrastructure monitoring
- No log management, synthetics, or K8s monitoring
- Limited for DevOps/SRE use cases beyond errors
Why Atatus is the Best Datadog Alternative in 2026?
Atatus is a full-stack observability platform built for modern engineering teams. Unlike Datadog which bundles complexity with cost, Atatus delivers unified visibility across APM, RUM, logs, traces, synthetics, and Kubernetes in a single, transparent plan.
- Faster Setup: Instrument your first service in under 15 minutes. No YAML configs, no custom agents, no DevOps tickets required.
- Predictable Pricing: All-in pricing. No per-metric surcharges. No surprise bills at the end of the month as your team scales.
- Unified Observability: Frontend, backend, logs, and infra in one pane of glass. No tab-switching between 5 Datadog products.
- Faster Root Cause Analysis: Correlated traces, logs, and metrics out of the box. Find the issue in seconds, not minutes of manual correlation.
- Lower Learning Curve: Designed for the full team, not just observability specialists. New engineers are productive in hours, not weeks.
- Dedicated Support: Every plan gets real human support. No upsell required for an SLA. G2 reviewers consistently rate Atatus support #1.
- Kubernetes-Native: Pod-level metrics, namespace dashboards, auto-discovery of services without a Helm values.yaml that's 300 lines long.
- No Vendor Lock-in: Full OpenTelemetry support. Bring your own instrumentation and migrate away cleanly at any time.
The best time to leave Datadog was before the last invoice. The second best time is now.
Start your free 14-day Atatus trial with full stack, full features, no credit card.
Frequently Asked Questions About Datadog Alternatives
1) Is Atatus cheaper than Datadog?
Yes. Atatus bundles APM, RUM, logs, synthetics, and infrastructure monitoring into a single plan starting at a fraction of Datadog's per-module pricing. Teams switching from Datadog typically report 50–70% cost savings while retaining full observability coverage.
2) Which Datadog competitor is best for Kubernetes monitoring?
Atatus and Dynatrace both offer deep Kubernetes monitoring. Atatus is preferred for easier setup and transparent pricing. Dynatrace is better for enterprises needing automated AI-driven discovery.
3) Does Atatus support OpenTelemetry?
Yes. Atatus supports OpenTelemetry for traces and metrics ingestion, ensuring you can migrate from Datadog without rewriting your instrumentation layer.
4) How long does it take to migrate from Datadog to Atatus?
Most engineering teams instrument their first service in under 30 minutes. A full migration of dashboards, alerts, and integrations typically takes 1–2 weeks, with Atatus onboarding support included.
5) Is Dynatrace or New Relic a better Datadog alternative?
Dynatrace is better for enterprises needing AI-powered automation and compliance. New Relic is better for data-heavy teams already comfortable with NRQL. For most teams evaluating Datadog alternatives, Atatus offers the best balance of coverage, cost, and ease of use.
#1 Solution for Logs, Traces & Metrics
![]() APM
APM
![]() Kubernetes
Kubernetes
![]() Logs
Logs
![]() Synthetics
Synthetics
![]() RUM
RUM
![]() Serverless
Serverless
![]() Security
Security
![]() More
More


