Distributed Tracing for Microservices: 10 Essential Best Practices for 2026

Distributed tracing tracks how a single request moves across multiple microservices, helping teams see the entire execution path end to end. In modern architectures where dozens of services interact, it becomes difficult to understand where latency starts, why bottlenecks appear, and which component breaks under load. Traditional monitoring only shows isolated metrics. Distributed tracing connects those dots.
Microservices bring flexibility and scalability but also introduce complexity. Requests can hop across several components, communicate asynchronously, and depend on ephemeral infrastructure that changes constantly. Distributed tracing addresses these realities by giving developers and SRE teams the context needed to diagnose issues quickly.
This guide covers the challenges of monitoring microservices, key benefits of distributed tracing, essential best practices, common mistakes to avoid, and how tracing works in real-time. It is designed to help teams build reliable, observable microservice systems without introducing unnecessary overhead.
What's in this guide?
- What Makes Monitoring Microservices So Hard?
- Why Distributed Tracing Matters in Microservices
- How Distributed Tracing Works in Real-Time
- Best Practices for Distributed Tracing in Microservices
- Common Mistakes Teams Make with Distributed Tracing
- Distributed Tracing with Atatus
What Makes Monitoring Microservices So Hard?
Monitoring a traditional monolithic application is straightforward because everything runs in a single environment. Microservices break these boundaries, which brings several challenges.
- Multiple Latency Paths: A single user request often travels through many services. For example, a checkout request in an e-commerce system may call authentication, inventory, pricing, payment, fraud detection, logging, and a notification service. Developers must understand delays at each step, not just the overall response time.
- Independent Deployments: Teams deploy microservices independently. When one service updates, it may change its behavior, latency, or API signature. This increases the difficulty of correlating incidents or regressions to specific deployments unless the system has strong trace visibility.
- Asynchronous Communication: Queues, event streams, scheduled jobs, and background processors disconnect the linear flow of requests. Async communication improves performance but hides bottlenecks unless traced properly.
- Ephemeral Components: Containers, functions, and pods scale up or down based on demand. By the time developers investigate an issue, the problematic container might no longer exist. Monitoring needs to capture data from short-lived components in real time.
Real-world Scenerio:
- Consider a ride-hailing platform where a single “Book Ride” request touches location services, pricing, driver-matching, surge-calculation, payments, and notifications. If surge-calculation slows due to a heavy Redis call, total response time can jump from 300ms to 2 seconds.
- In a streaming app, a request may hop across 12+ services. When one recommendation dependency spikes from 20ms to 400ms, users see buffering. Without tracing, teams only see “startup latency increased” with no insight into which hop caused it.
- A fintech workflow may pass through identity checks, scoring engines, document extraction, and multiple async consumers. If a scoring consumer stalls due to a thread pool issue, workflow timing becomes unpredictable and the problematic container may already disappear before investigation.
Want Better Stability Across Your Services? Start with This APM Breakdown
Why Distributed Tracing Matters in Microservices?
Microservices don’t fail in isolation. Distributed tracing reveals how systems behave across service boundaries and makes debugging faster and more predictable.
- Faster Root Cause Isolation: When a request takes longer than expected, tracing shows exactly where time vanished. Instead of comparing logs from five teams, engineers can immediately see which span consumed the majority of the latency.
- Context Across Services: Traces stitch together every service call using a shared trace ID. Developers can follow the exact path a request took including upstream calls, downstream calls, queues, and background jobs.
- Visualising Latency Impact: Trace diagrams make slow hops obvious. If authentication adds 250ms to every request or a pricing service regularly spikes, teams notice immediately.
- Debugging Async Workflows: Distributed tracing exposes queue delays, slow consumers, dropped events, and retry loops in event-driven systems. This is essential for workloads using Kafka, RabbitMQ, or cloud messaging.
- Improving Engineering Velocity: Faster debugging directly improves delivery speed. Teams avoid cross-department guesswork and can correlate issues with recent releases or infrastructure changes.
Real-world Developer Scenarios
- Slow database query exposed instantly: An inventory service issues a heavy ORM query. Spans reveal a 1.2-second DB call, leading straight to the culprit.
- Load-dependent 5xx errors: API gateway failures appear during peak traffic. Traces highlight a hidden dependency that slows only under high concurrency.
- Backlogged Kafka/RabbitMQ consumer: Notification messages pile up. Traces show enqueue time, consumer processing time, and downstream delays.
- Latency regression after deployment: Checkout jumps from 250ms to 650ms after a rollout. Traces pinpoint a new validation function added in the payment service.
- Serverless cold starts revealed: Certain paths show 500ms delays. Tracing exposes cold starts in specific functions, guiding pre-warm strategies.
How Distributed Tracing Works in Real-Time?
Distributed tracing follows a request as it moves through multiple services and records each operation in a structured timeline. Every trace is made up of spans, small units of work that represent actions like database calls, API requests, queue operations, or background tasks.
Here’s how it works step-by-step in a real environment:
Step 1: A request enters the system
A user action hits an entry point such as an API gateway or frontend service. A unique trace ID is created and attached to the request.
Step 2: The trace context is passed downstream
As the request travels across microservices, each service receives the trace context and forwards it in outgoing calls whether HTTP, gRPC, or event-driven. This keeps all spans connected to the same trace.
Step 3: Each service creates spans for its work
Instrumentation records each key operation in a request including logic execution, database calls, external APIs, messaging, cache access, and queue delays, and timestamps every span while linking it to its parent.
Step 4: Async workflows are captured too
If the request moves through events or queues, the producer records a span when the message is added and the consumer records another during processing. Both use the same trace context, making queue wait time, processing time, and workflow gaps easy to see.
Step 5: The trace is sent to the backend
Each service sends span data to the tracing backend in near real-time. The backend assembles spans into a full timeline from entry to exit.
Step 6: Engineers view the complete journey
The assembled trace shows where a request slowed, which service caused delays, how async steps added latency, and how failures cascaded across services. This clarity helps teams resolve issues faster and understand overall performance.
Common Mistakes Teams Make with Distributed Tracing
- Instrumenting Everything at Once: Teams often try to instrument the entire fleet immediately, leading to inconsistent data and confusion. Progressive rollout works better.
- Not Propagating Context: Missing or overwritten trace context breaks entire trace chains. This is the most common failure.
- Missing Async Spans: Async flows must be traced to get the full picture. Ignoring queues or event consumers creates blind spots.
- Trace Sampling Misconfiguration: Too low sampling hides issues. Too high sampling increases storage costs. Balanced dynamic sampling is ideal.
- No Standard Naming: Inconsistent span names make traces hard to query or search.
- Relying Only on Logs: Logs alone lack the end-to-end story. Without traces, correlation becomes guesswork.
Best Practices for Distributed Tracing in Microservices
Distributed tracing works best when teams follow a consistent approach. Below is a streamlined, practical set of best practices written for real engineering teams building or scaling microservices.
#1 Choosing the Right Sampling Strategy
Sampling decides how much trace data you store. A balanced approach keeps the system lean without losing critical insights.
What works well:
- Use adaptive sampling so slow or error traces are always collected.
- Keep a baseline sample rate (5–10%) for stable traffic.
- Increase sampling for critical flows such as checkout or payments.
- Tune sampling during traffic surges, version rollouts, or major infra changes.
- A good sampling strategy keeps data useful without overwhelming your backend.
#2 Ensuring Consistent Trace Context Propagation
Trace context must flow across every service, or the trace becomes fragmented.
Make it consistent:
- Use W3C Trace Context across all languages and frameworks.
- Forward context through HTTP, gRPC, and messaging systems.
- Ensure proxies, gateways, and service meshes preserve headers.
- Validate propagation during CI/CD by testing service hops.
- Strong propagation is the backbone of reliable distributed traces.
#3 Starting Instrumentation in the Right Order
Good tracing doesn’t start with instrumenting everything. It starts with prioritization.
Start here:
- API Gateway or Ingress
- High-volume services
- Core business workflows
- Unstable or frequently escalated services
- Queues and async pipelines
This approach gives fast visibility with minimal engineering effort.
#4 Using Auto-Instrumentation for Fast Coverage
Auto-instrumentation delivers immediate value by capturing most technical spans.
It typically covers:
- Web frameworks
- Database clients
- External calls
- Caches
- Message queues
After that, add manual spans for:
- Key business logic
- Custom workflows
- Unusual async paths
This combination ensures you capture both technical and domain-specific performance.
#5 Standardizing Span Names and Metadata
Clear naming prevents confusion when browsing flame graphs or service maps.
Keep it simple:
- Use stable, deployment-aligned service names.
- Name spans by action (e.g., POST /checkout) rather than internal method names.
- Add uniform tags like region, tenant_id, user_type, version.
- Use the same conventions across all teams.
- Standardization helps teams search, compare, and analyze traces faster.
#6 Capturing Async and Event-Driven Workflows Properly
Async paths are common in microservices, and they often hide the toughest issues.
To trace them effectively:
- Embed trace context in message headers or payloads.
- Create separate spans for enqueue and processing stages.
- Instrument producers and consumers equally.
- Track retries and dead-letter events with spans.
Async clarity helps teams identify queue latency, consumer stalls, and downstream bottlenecks.
#7 Reducing Trace Noise Without Losing Critical Detail
Not all spans are useful. Too many can overwhelm developers.
Trim noise intelligently:
- Exclude static asset requests and health checks.
- Collapse repetitive operations into logical spans.
- Suppress extremely short, low-value internal calls.
- Focus on spans that influence user latency or correctness.
- Noise reduction makes traces easier to understand at a glance.
#8 Using Trace Insights to Improve Architecture and Performance
Distributed traces aren’t just diagnostic data. They expose systemic issues you normally wouldn’t see.
Insights teams commonly extract:
- Slow but unnoticed service hops
- Dependency chains affecting scalability
- Overloaded downstream components
- Redundant calls that should be cached
- Patterns that point to better service boundaries
Traces often reveal architectural improvements before they become production incidents.
Distributed Tracing with Atatus
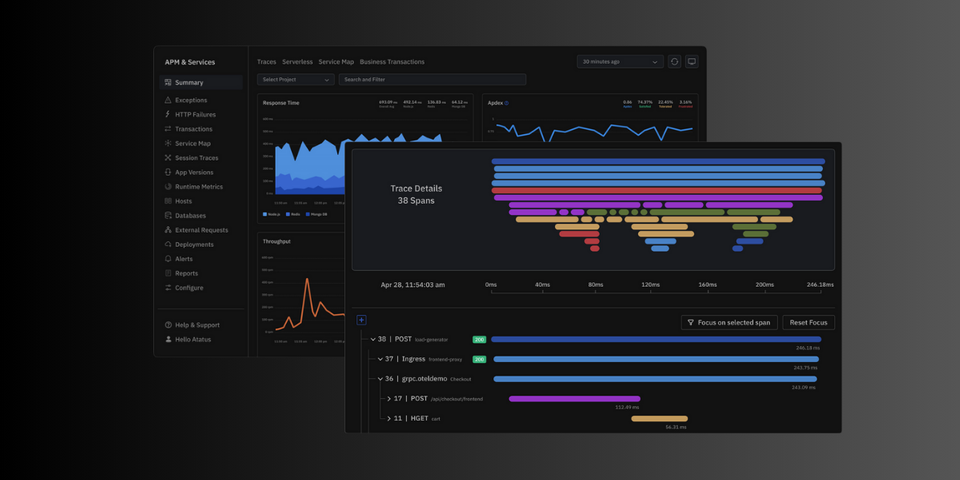
Atatus captures distributed traces across services through auto-instrumentation and optional manual spans. Each request is recorded as a full timeline, showing service hops, downstream calls, and latency breakdowns.
Traces are displayed in clear waterfall views and service maps, making it easier to identify slow endpoints, dependency delays, or failures. Engineers can inspect span details, see error events, and correlate traces with logs and metrics for deeper context.
To get started, install the language agent, enable tracing in the configuration, deploy progressively, and validate that trace context flows correctly across your services.
⚡ Cut Debug Time by 50% This Week
Start Your Free Atatus Trial and Trace Every Microservice Call
Get Started NowFAQs
1) What is distributed tracing?
Distributed tracing is a technique for tracking a request as it flows through multiple microservices. It records each operation as a span and stitches them together to show the full execution path across the system.
2) How does distributed tracing help microservices?
It provides visibility across services, exposes bottlenecks, accelerates debugging, and reveals how components interact. Teams use traces to identify latency sources, fix errors quicker, and improve system reliability.
3) Is distributed tracing expensive?
It depends on sampling strategy, data volume, and storage. With balanced sampling and clear trace metadata rules, teams can manage costs effectively while maintaining high visibility.
4) What should you instrument first?
Start with user-facing services and gateway layers. These provide the broadest coverage early. After that, instrument high-risk services that often contribute to incidents or slowdowns.
5) What’s the difference between logs vs traces vs metrics?
Logs capture events, metrics track numerical trends, and traces show end-to-end request flows. All three complement each other. Traces provide context that logs alone cannot.
#1 Solution for Logs, Traces & Metrics
![]() APM
APM
![]() Kubernetes
Kubernetes
![]() Logs
Logs
![]() Synthetics
Synthetics
![]() RUM
RUM
![]() Serverless
Serverless
![]() Security
Security
![]() More
More