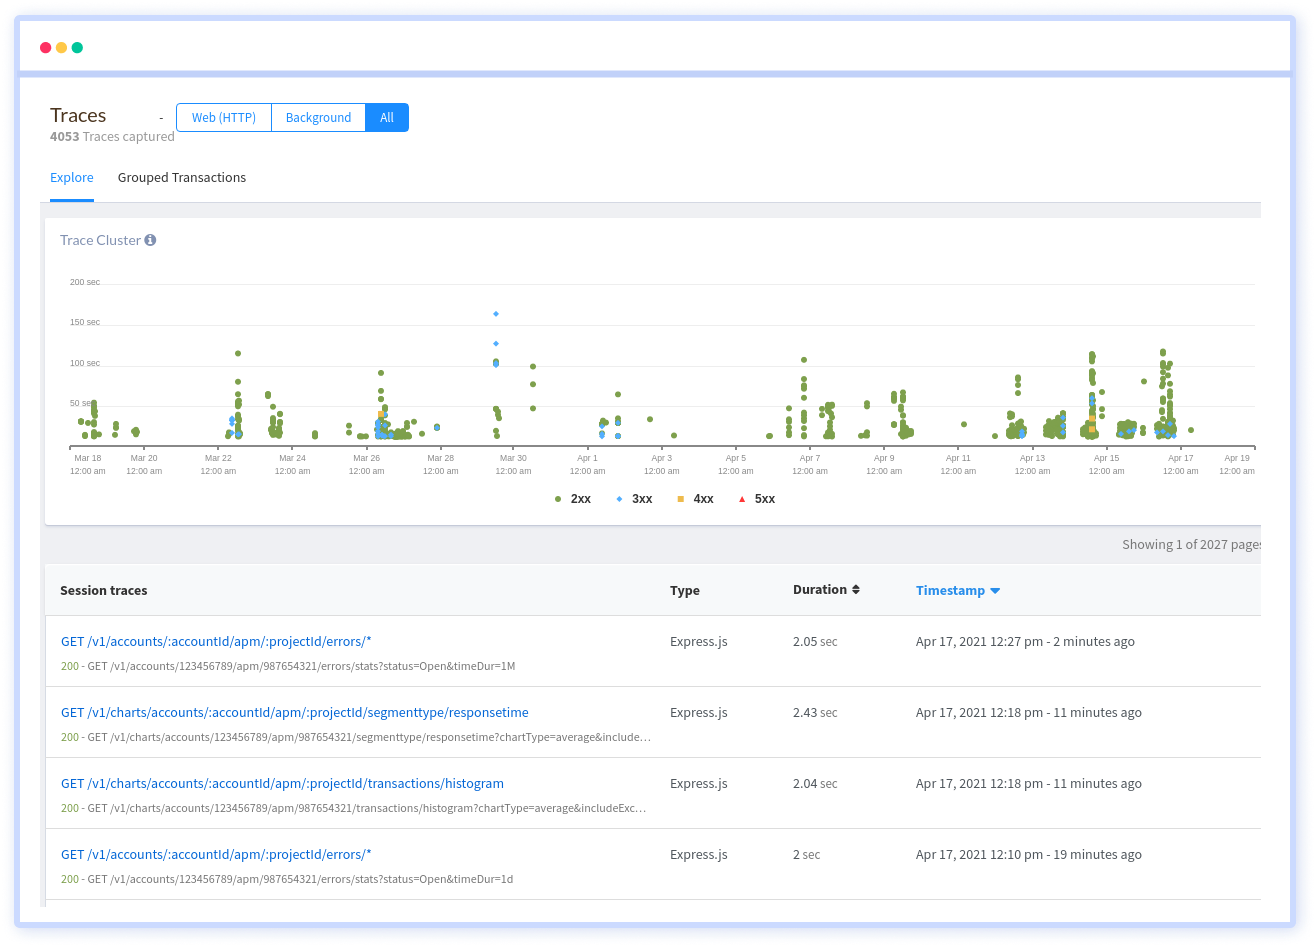
Slow Request Traces
Visualize where each of your end points is spending most of its time, which functions were executed, for how long and where you need to debug further to speed up your application. Get in depth overview of the individual operations, raw queries and calls that the slow end point made.
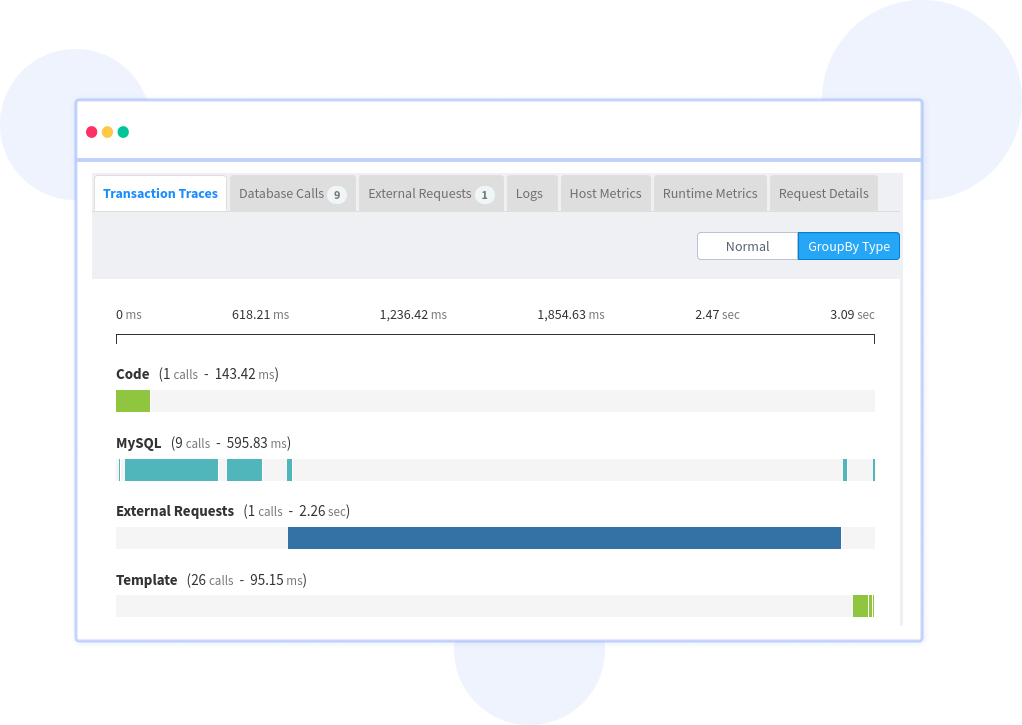
Find exactly what is slowing your application
See each function call that is executed, from where it originated, how much time it consumed and its impact on your transaction performance. Get a visual overview of it along with the breakdown of the database queries, external requests and request parameters.
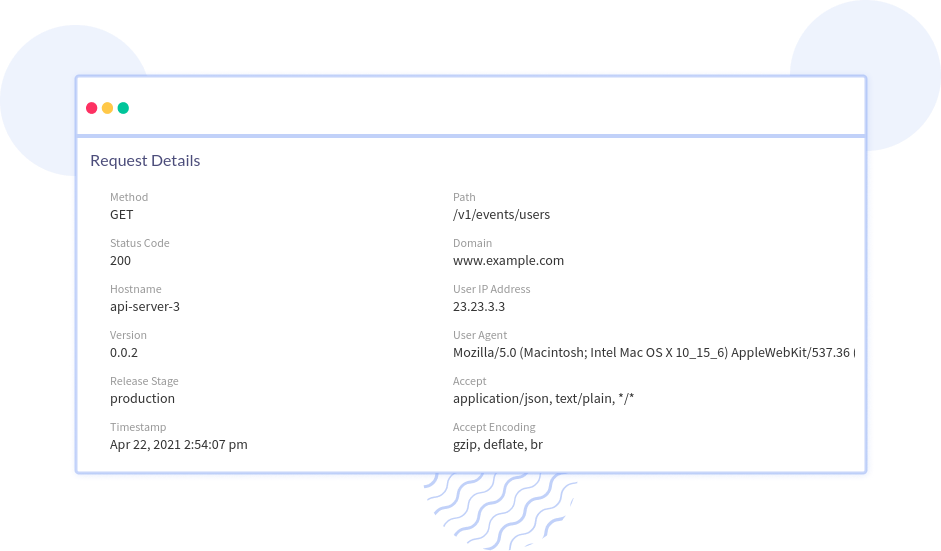
See the context of the slowest request
Get the context which started this slow request, along with the request parameters, user information and custom data that you can pass along with the original request, which can show you the request and response body.
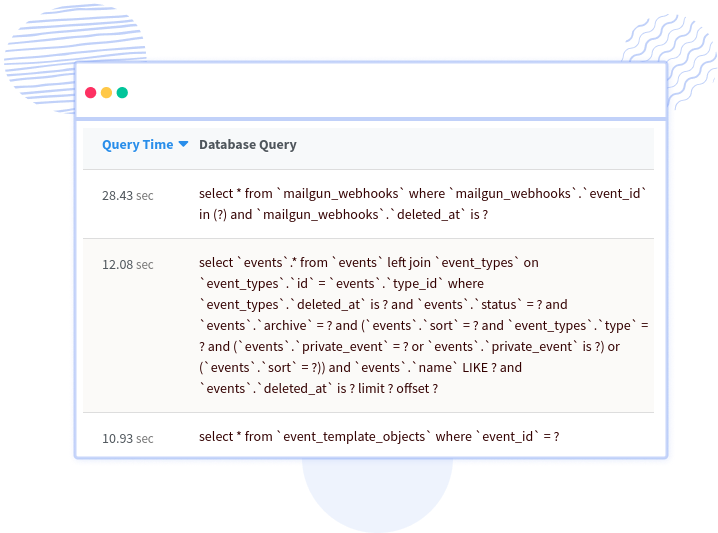
Identify which DB query is slowing down your request
With a separate list of all database queries called from this trace with the normalized query, understand which table and operation were called, it’s impact and what you can do to improve its performance.
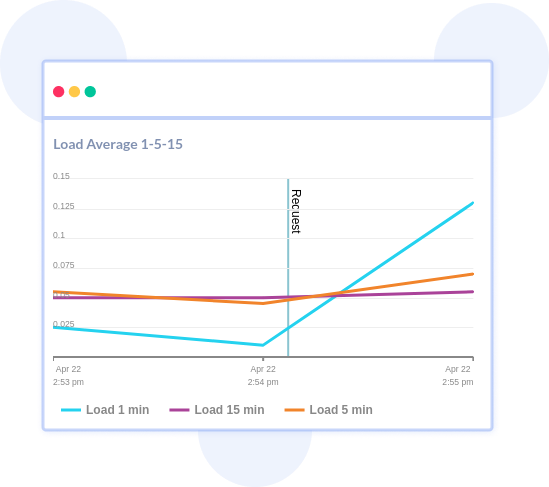
Correlate the transaction with logs, host and runtime metrics
See what is happening around your application when the slow transaction happens. Connect the traces to the host metrics, log data and the run time metrics that gives you an overview of impact outside your application


 +1-760-465-2330


