A Beginner's Guide for Grafana Loki (Open-source Log Aggregation by Prometheus)

Many logging solutions are available on the market to deal with log data, each focusing on a different part of the logging issue including log aggregation. These solutions are open-source and proprietary software and tools incorporated into cloud provider platforms, as well as a variety of capabilities to fulfill your requirements. Grafana Loki is a new industry solution, so let's take a closer look at what it is, where it originated from, and whether it can suit your logging requirements.
Here's how it’s done:
- What is Grafana Loki?
- Grafana Loki Purpose
- The Architecture of Grafana Loki
- How does Grafana Loki Work?
- Features of Grafana Loki
- Use Cases for Loki
- How can We Install the PLG (Promtail-Loki-Grafana) Stack?
- Benefits of Grafana Loki
What is Grafana Loki?
Loki is a horizontally scalable, highly available, multi-tenant log aggregation solution. It's designed to be both affordable and simple to use. Rather than indexing the contents of the logs, it uses a set of labels for each log stream.
Grafana Loki was inspired by Prometheus' architecture, which uses labels to index data. This allows Loki to store indexes in less amount of space. Furthermore, Loki's design is fully compatible with Prometheus, allowing developers to apply the same label criteria across the two platforms.
Prometheus is an open-source time-series metrics monitoring solution that has become the de-facto standard. Developers primarily utilize Prometheus while building software with Kubernetes or other cloud-native solutions because it is a cloud-native solution.
Prometheus is unique in that it can collect multi-dimensional data from numerous sources, making it an appealing choice for enterprises using cloud microservices. It contains a metric alerting system, but developers frequently supplement it with alternative logging methods.
Other logging techniques tend to make software systems more observable and include a graphical component in the logs.
Prometheus developed a new query language (PromQL), which makes visualizing logging for troubleshooting and monitoring difficult. Many of the logging solutions available were created before Prometheus was on the market in 2012 and did not support connection to Prometheus.
Loki project is similar to the ELK/EFK stack, but it's quicker to set up and use, and it has more features. Loki indexes timestamps and a set of labels for a log stream rather than the content of the log. It reduces the index size, which simplifies processes and, in turn, cuts costs.

Grafana Loki Purpose
Grafana Loki was created in response to a request for an open-source tool that could easily choose and examine time-series logs that were kept stably. Log visualization technologies with querying capabilities, log aggregation, and distributed log tracing can all help identify system issues.
Existing open-source troubleshooting tools do not easily integrate with Prometheus. They didn't let developers search for Prometheus' metadata over a certain period, instead limiting them to the most recent logs. Furthermore, since log storage was inefficient, developers quickly reached their logging limits and had to decide which logs they could live without. Crashing some tools could result in logs being lost forever.
It's worth noting that there are proprietary solutions on the market that don't have these limits and offer features much beyond what open-source tools can offer. Instead of employing a different open-source tool for each purpose, these technologies can combine time-bound searches, log aggregation, and distributed tracing into a single tool.
The Architecture of Grafana Loki
#1 Components
Loki's service was created using a set of components (or modules). Distributor, ingester, querier, and query frontend are the four components accessible for use.
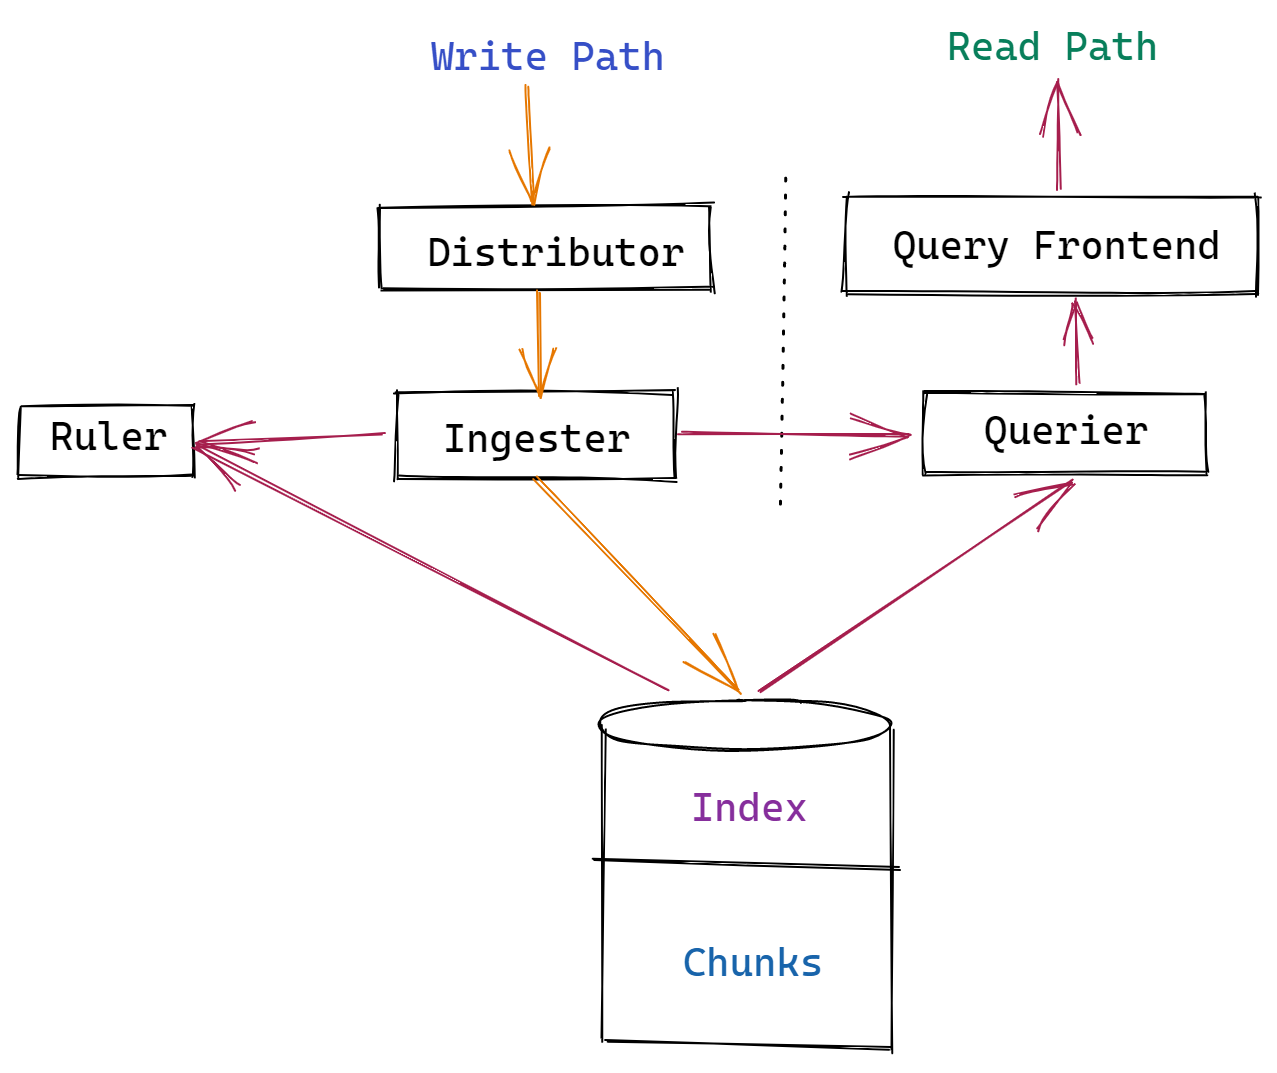
Distributor
Client data streams are handled and validated by the distributor module. Valid data is chunked and transmitted to several ingesters for processing in parallel.
To check log data in the distributor and process it in different downstream modules, the distributor uses Prometheus-like labels. Grafana Loki cannot construct the index it needs for searching without labels.
Let's say you don't have the right labels on your logs. In that situation, if you're loading logs from sources other than Prometheus, the Loki architecture might not be the best option.
Ingester
The data is written to long-term storage via the ingester module. Loki indexes metadata rather than storing the log data it ingests. AWS S3, Apache Cassandra, or local file systems are examples of flexible object storage.
For in-memory searches, the ingester also returns data. Unflushed data is lost when Ingester crashes. With poor user setup assuring redundancy, Loki can irreversibly lose logs from ingesters.
Querier
The querier module is used by the Loki project to handle user queries on the ingester and object storage. Queries are conducted against local storage first, followed by long-term storage.
Since it queries many areas, the querier must deal with duplicate data, and the ingesters do not discover duplicate logs during the writing process. Because of an internal mechanism, the querier only returns data with the same timestamp, label data, and log data once.
Query Frontend
The query frontend module can optionally provide API endpoints for queries, allowing huge queries to be parallelized. The query frontend still employs queries, but it divides large searches into smaller ones and performs log reads in parallel. This feature is useful if you're just getting started with Loki and don't want to set up a querier in detail just now.
#2 Object Stores
Loki requires long-term data storage to keep track of queryable logs. It needs an object store to store both the compressed chunks written by the ingester and the chunk data's key-value pairs. Data from long-term storage can take longer to retrieve than data from local storage.
The file system is the only free choice for storing chunked logs, with managed object stores being the only alternative option. The file system has drawbacks in that it is not scalable, durable, or highly available. The file system storage should only be used for testing or development, not for troubleshooting in production systems.
There are numerous scalable, durable, and highly available log storage alternatives available. Reading and writing data, as well as data storage, incur expenses with these storage methods.
How does Grafana Loki Work?
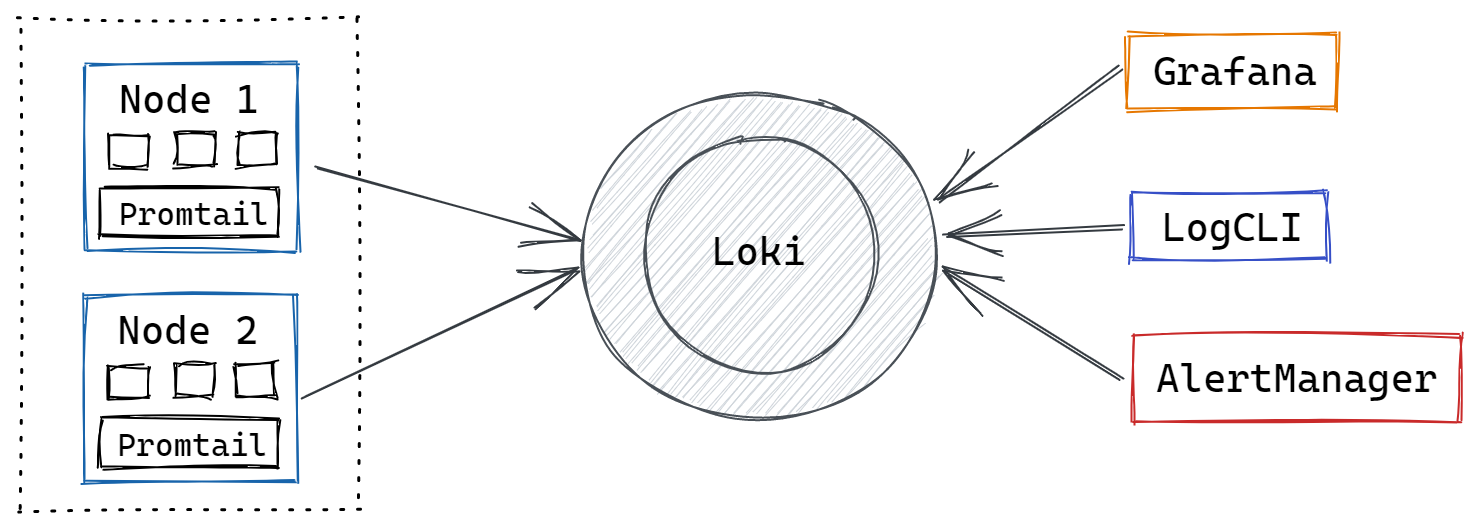
- Pull Logs with Promtail
Promtail is a log collector made just for Loki. It uses the same Prometheus service discovery and has similar features for tagging, converting, and filtering logs before ingestion into Loki. - Store Logs in Loki
The text of logs is not indexed by Loki. Instead, entries are categorized into streams and labeled. This not only saves money but also means that log lines can be queried within milliseconds of being received by Loki. - Use LogQL to Explore
To explore your logs, use Loki's advanced query language, LogQL. Run LogQL queries from within Grafana to see your logs alongside other data sources, or use LogCLI if you prefer the command line. - Alert Logs
Set up alerting rules for Loki to use while it evaluates your Loki Syslog data. Loki configuration is a must to transmit the warnings generated to a Prometheus Alertmanager, where they will be routed to the appropriate team.
Features of Grafana Loki
Grafana Loki promotes a data-driven culture by assisting in the creation, exploration, and sharing of dashboards. These are the major features of Grafana Loki as follows:
Open-source
Grafana Loki and other open-source solutions are not without flaws. The Loki team is enthusiastic about their product and is working hard to resolve the challenges with the new platform. Grafana Loki is reliant on the community for documentation and features. Because of the community's dependency, setting up and improving a log analytics platform with Loki can require a lot of time and effort.
Users must join up for Enterprise services, which come at a cost similar to other proprietary systems, to assure quick responses. If you're thinking about using these Enterprise services, make sure you've looked into other proprietary options to guarantee you get the most out of your log analytics platform.
Horizontally Scalable
Depending on the intended value, developers can run the Loki project in one of two modes. Loki runs components in monolith mode on a single server when the target is set to all. When you set the target to one of the possible component names, Loki runs in a horizontally scalable or microservices mode, where each component has its server.
To handle the number of their stored logs and the pace of responses, users can scale distributors, ingestors, and querier components as needed.
Quick Querying
Ingesters separate labels from log data when logs are imported into Grafana Loki using Promtail. Since labels are used to choose logs to be searched during queries, they should be as simple as possible. Concise and limited labels are implicit conditions of getting fast queries using Loki.
Loki divides data by time range and then shards it by index when you query. The available queries are then used to read the whole contents of the shard in search of the provided search parameters. The query response will be faster if there are more queries accessible and the index is smaller.
To speed up querying, Grafana Loki employs brute force and parallelized components. For a brute force method, the speed attained with Grafana Loki is impressive. Loki prefers this brute-force strategy to completely indexed solutions since it is more simple. Fully indexed systems, on the other hand, can search logs more thoroughly.
Inexpensive Log Storage and Querying
Grafana Loki is a low-cost log analytics solution because it is open source. The expense of using the free-tier cloud solution or the source code deployed via Tanka or Docker is the cost of storing the label and log data.
To keep querying speedy, Loki advocates keeping labels as minimal as possible. As a result, label storage can be modest in comparison to the total amount of log data. Complete Loki logs are compressed before being stored with the tool of your choosing, making storage even more efficient.
When it comes to compression technologies, the tradeoff between storage capacity and read speed is common, thus developers will have to weigh the cost vs. speed when building up their Loki system.
Grafana makes advantage of cloud storage services such as AWS S3 and Google's GCS. The cost of Loki is determined by the size of logs required for log analysis as well as the frequency of read/write operations. AWS S3, for example, charges for each GB of storage and each request made to the S3 bucket.
Use Cases for Loki
The following are some of the most common scenarios for using a logging system like Loki.
- Business Intelligence
Creating meaningful insight from log data is always useful, and this is an evergreen use case. Loki can assist you in deciphering log data and enabling you to devise new business growth plans. For example, log data from an organization can assist you in determining the conversion rates from a particular advertising channel. - Cybersecurity
Cybersecurity attacks on e-commerce portals have escalated dramatically in recent years. You can check the logs using Loki to see if there's any threat, issue, or malicious behavior going on in your organization's system. If the attack was successful, Loki could still be useful to the forensics team in determining exactly what happened in the system. It will assist them in locating the hackers. - Debugging and Troubleshooting
Loki can provide the DevOps team with rapid answers like when the application crashed, why it crashed, what it was doing before it crashed, and so on. - Monitoring
In the industry, Prometheus is often used for monitoring. However, using tools like Loki to monitor your logs might provide a lot of information. It can help you keep track of your website's error rates by scanning through the logs and sending warnings when a certain threshold is reached.
How can We Install the PLG (Promtail-Loki-Grafana) Stack?
We'll utilize the appropriate Helm charts to install the PLG stack, and we'll alter their values to meet our needs. We'll start by installing Prometheus-Operator (since it includes Prometheus, Alert-Manager, and Grafana). After that, we'll set up Loki-stack (which contains Promtail) and Nginx.

Install Loki Grafana
Let's make a loki-stack-values.yaml file and fill it with the values for Loki installation.
# Loki Stack Values
promtail:
    serviceMonitor:
      enabled: true
      additionalLabels:
        app: prometheus-operator
        release: prometheus

    pipelineStages:
    - docker: {}
    - match:
        selector: '{app="nginx"}'
        stages:
        - regex:
            expression: '.*(?P<hits>GET /.*)'
        - metrics:
            nginx_hits:
              type: Counter
              description: "Total nginx requests"
              source: hits
              config:
                action: inc
For the Promtail, we enable the service to monitor and provide relevant labels so that it can easily sync with Prometheus. Loki uses the many phases organized in a pipeline as shown here to alter a logline, change its labels, and change the format of the timestamp.
There is a match step in the snippet above that only executes if the scraped config has key=app and value=nginx. With the use of a regular expression, the following stage filters out the logline that contains the words hits and GET.
The nginx_hits measure is defined in the metrics stage. The /metrics endpoint in Promtail exposes this custom measure. When hits (source) are filtered out of the regex stage, the metric type is defined as a counter that will be incremented.
For Prometheus to reflect this measure, Prometheus should scrape Promtail. We can generate a custom measure from the container logs in this method. Furthermore, as shown in this post, we can scale deployments depending on specific KPIs.
Run the following commands to install Loki:
helm3 repo add loki https://grafana.github.io/loki/charts
helm3 repo update
helm3 upgrade --install loki loki/loki-stack --values=loki-stack-values.yaml
Install Prometheus-Operator
Create a prom-oper-values.yaml file and fill it with the following values:
grafana:
    additionalDataSources:
      - name: loki
        access: proxy
        orgId: 1
        type: loki
        url: http://loki:3100
        version: 1

additionalPrometheusRules:
  - name: loki-alert
    groups:
      - name: test_nginx_logs
        rules:
        - alert: nginx_hits
          expr: sum(increase(promtail_custom_nginx_hits[1m])) > 2
          for: 2m

alertmanager:
  config:
    global:
      resolve_timeout: 1m
    route:
      group_by: ['alertname']
      group_wait: 3s
      group_interval: 5s
      repeat_interval: 1m
      receiver: slack-notifications
      routes:
      - match:
          alertname: nginx_hits
        receiver: slack-notifications
    receivers:
    - name: 'slack-notifications'
      slack_configs:
      - api_url: 'https://hooks.slack.com/services/ABCD1234/ABCD567'
        channel: '#test'
In this, we've provided Grafana setup to include Loki as a data source. After that, we set up the rule to send an alert with the name nginx hits. These rules are grouped evaluation some timeslack notification so that they can be executed in a logical order at regular intervals.
In the expr, the threshold for triggering an alert is set. The rule defined in this manner aids in the precompilation of expressions, allowing for speedier expression execution.
At this moment, the PromQL expression (expr) is defined as threshold evaluation. It saves the result as a new set of time series with the metric name specified. The increase function is included in the expression we used.
Over some time, it calculates the difference between the counter values (1 min). sum adds together all of the nginx_hits from all of the counters. When the condition in the expr persists for a certain amount of time, an alert is triggered.
Prometheus uses the for-clause to check whether the alert is active at each evaluation period and fires the alert accordingly. Before entering the Firing state, alerts remain in the Pending state.
Last but not least, we set up Alertmanager to send the notification over Slack. When it comes to routing incoming alerts, Alertmanager uses a tree structure. We can organize alerts based on alertname, jobs, clusters, and other factors. When a matching alert is found, a notification is delivered to the pre-defined receiver.
The receiver has been set to slack notifications in this situation. The relevant Slack channel and its webhook URL are configured in the receiver.
helm3 upgrade --install prometheus stable/prometheus-operator --values=prom-oper-values.yamlThe next step is to install Nginx, which may be found here in yaml format. NodePort is used to expose Nginx.
kubectl apply -f nginx.yamlWe'll check the status of all the Pods once they're up and running.
└─ $ ▶ kubectl get pods
alertmanager-prometheus-prometheus-oper-alertmanager-0   2/2     Running   0          3m14s
loki-0                                                   1/1     Running   0          82s
loki-promtail-n494s                                      1/1     Running   0          82s
nginx-deployment-55bcb6c8f7-f8mhg                        1/1     Running   0          42s
prometheus-grafana-c4bcbbd46-8npgt                       2/2     Running   0          3m44s
prometheus-kube-state-metrics-6d6fc7946-ts5z4            1/1     Running   0          3m44s
prometheus-prometheus-node-exporter-jwz64                1/1     Running   0          3m44s
prometheus-prometheus-oper-operator-f8df9fcf9-kc5wc      2/2     Running   0          3m44s
prometheus-prometheus-prometheus-oper-prometheus-0       3/3     Running   1          3m2s
Benefits of Grafana Loki
The following are some of the benefits of including Loki in your stack:

- Loki is particularly cost-effective because it merely indexes metadata. Running indices for full-text processing requires more expensive RAM instances. It's also cheaper to store logs on an object store like S3.
- Since it uses tenantID to facilitate multi-tenancy, tenants' data is saved independently.
- Loki may be used to execute small-scale processes locally or readily scaled horizontally for large-scale operations.
- For read and write operations, it leverages dynamo-style to achieve quorum consistency.
- It is set up with three log replicas by default to mitigate the possibility of process crashes and abrupt exits that cause the logs to be lost. Yes, there would be an additional cost, but it would not be significant; data integrity is more important.
- Popular tools such as Kubernetes, Prometheus, and Grafana visualization are simple to integrate.
Wrap Up!!!
Even a few microseconds of downtime in a production environment is unacceptable. Time is of the essence while debugging such difficulties. Debugging such problems is aided by proper infrastructure logging and monitoring. It also assists in proactive cost and resource optimization. It also aids in the anomaly detection of any imminent problems that may occur in the future. On the market, there are a variety of logging and monitoring solutions.
Grafana Loki is a brute-force log aggregation solution that is open source and horizontally scalable. Loki will need to be used in combination with a cloud account for log storing.
Loki is a low-barrier-to-entry tool that integrates seamlessly with Prometheus for metrics and Grafana for log viewing. The free version has some limitations, such as the fact that it is not always available. Loki can potentially lose logs if sufficient redundancy isn't built.
Atatus Logs Monitoring and Management
Atatus offers a Logs Monitoring solution which is delivered as a fully managed cloud service with minimal setup at any scale that requires no maintenance. It monitors logs from all of your systems and applications into a centralized and easy-to-navigate user interface, allowing you to troubleshoot faster.

We give a cost-effective, scalable method to centralized logging, so you can obtain total insight across your complex architecture. To cut through the noise and focus on the key events that matter, you can search the logs by hostname, service, source, messages, and more. When you can correlate log events with APM slow traces and errors, troubleshooting becomes easy.
#1 Solution for Logs, Traces & Metrics
![]() APM
APM
![]() Kubernetes
Kubernetes
![]() Logs
Logs
![]() Synthetics
Synthetics
![]() RUM
RUM
![]() Serverless
Serverless
![]() Security
Security
![]() More
More

![New Relic vs Splunk - In-depth Comparison [2026]](/blog/content/images/size/w960/2024/10/Datadog-vs-sentry--19-.png)