Java Memory Leak: Decoding Myths
Java undoubtedly is one of the most used programming languages today. Not surprising if you yourself were trained in it. Over the years, it has gained a reputation for being both powerful and efficient. However, like any other language, Java has its share of challenges.
And one of these is the problem of memory leaks, and fair enough, there are more myths surrounding it than ways to overcome it. But this blog is all about it. We are going to be taking out popular myths surrounding Java memory leaks and demystifying each one of them.
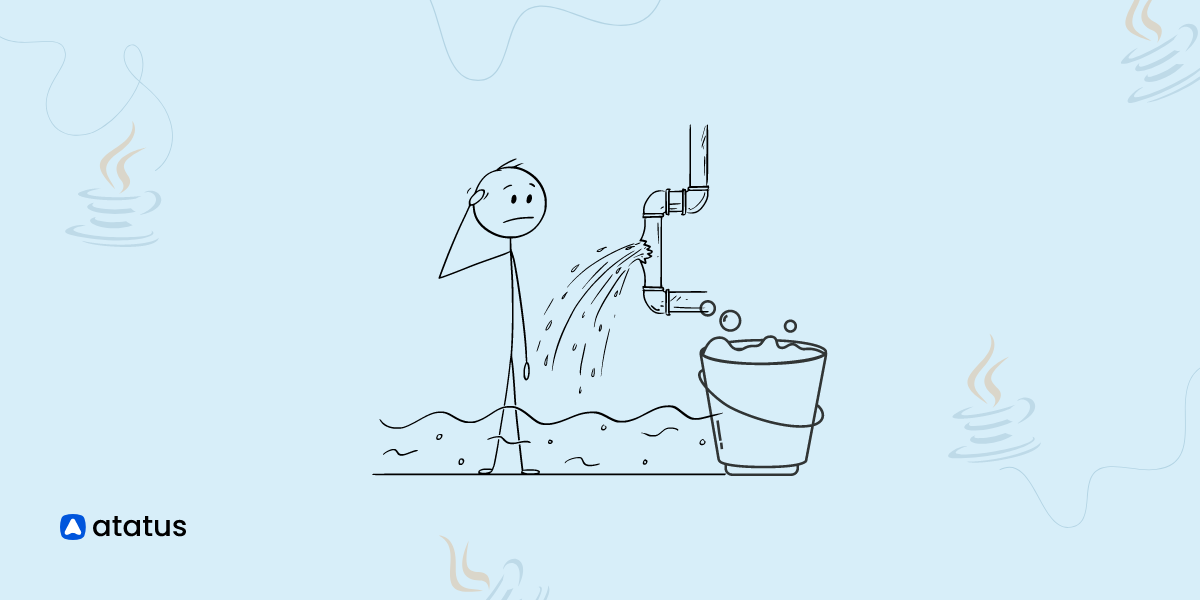
Memory leaks usually occurs when the program allocates a lot of memory but then never releases it once the program is deleted or no longer needed. This makes the program consume system resources unnecessarily and increases the overhead. This automatically results in a lag or a crashing of the overall application program.
Learn how to identify Memory Leaks here.
We will look at all these matters in a bit more detail here. Scroll down for more!
Table Of Contents
- Myth 1: Java's garbage collection eliminates all memory leaks.
- Myth 2: Memory leaks only happen in native code or when using JNI
- Myth 3: Memory leaks are only caused by the Java Runtime Environment
- Myth 4: Memory leaks are only caused by explicit memory allocation (new operator) and forgetting to deallocate (delete).
- Myth 5: Memory leaks can be fixed by increasing the heap size (Xmx).
- Myth 6: Using the finalize() method ensures that objects are correctly deallocated and prevents memory leaks.
- Myth 7: Memory leaks are easy to detect and fix with automated tools.
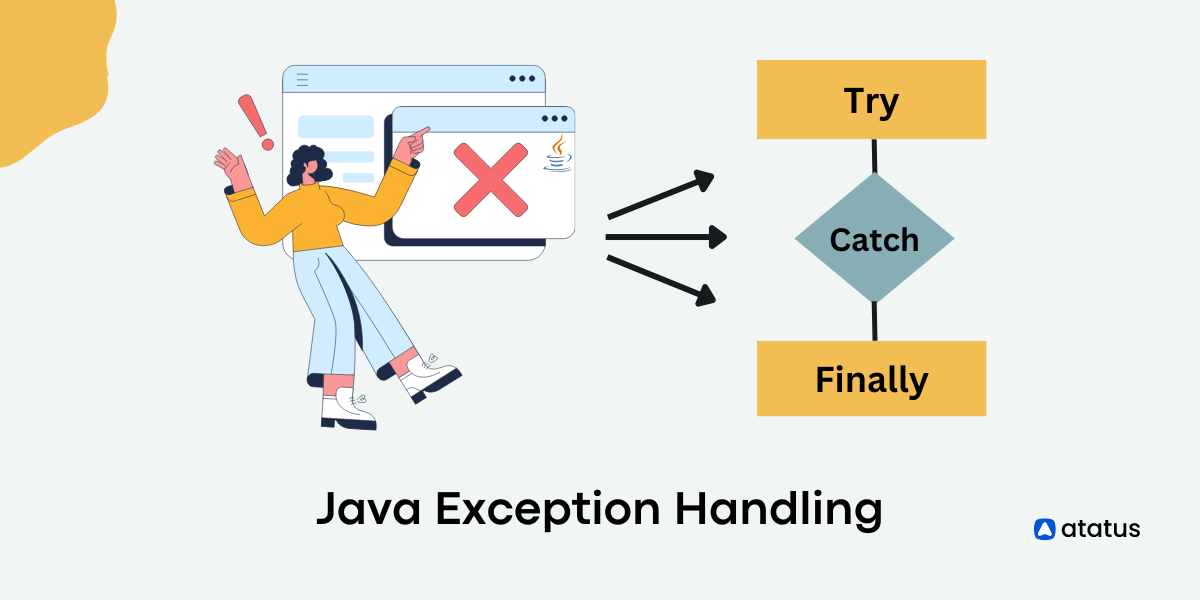
Myth 1: Java's garbage collection eliminates all memory leaks.
You might have heard that the garbage collection function eliminates all memory leaks in Java, but the reality is that Java's garbage collection is a mechanism that helps manage memory by automatically freeing up memory from unreachable objects.
However, it does not guarantee the elimination of all memory leaks. Memory leaks can still occur in Java applications due to references that are unintentionally kept longer than necessary, preventing objects from being garbage collected.
Memory leaks in Java are typically caused by retaining references to objects that are no longer needed, which prevents the garbage collector from reclaiming their memory. These leaks can accumulate over time and lead to increased memory consumption, potentially causing an application to run out of memory OutOfMemoryError.
To fix memory leaks in Java, you need to identify and address the root causes of the leaks. Here are some common approaches to fix memory leaks:
- Make sure that you remove references to objects when they are no longer needed. For example, if an object is removed from a collection or is no longer being used, set its reference to null so that it becomes eligible for garbage collection.
- In some cases, you may need to maintain references to objects but want them to be garbage collected when no other strong references are present. In such situations, consider using weak references or other reference types provided by Java's
java.lang.ref package. - As mentioned earlier, the
finalize()method is not a reliable way to deallocate resources and prevent memory leaks. It is generally recommended to avoid using this method and instead explicitly release resources when they are no longer needed. - Utilize Java memory profiling tools to analyze the memory usage of your application. These tools can help you identify memory-intensive areas and potential memory leaks, making it easier to pinpoint the source of the issue.
Myth 2: Memory leaks only happen in native code or when using JNI
The reality is that memory leaks can happen in any Java application, not just in native code or when using the Java Native Interface (JNI). While it is true that memory leaks can be more prevalent in applications that interact with native code through JNI, memory leaks in Java are primarily caused by issues related to object references and memory management within the Java application itself.
Here are some common scenarios within pure Java code that can lead to memory leaks:
- Mismanagement of collections: Storing objects in collections like lists, maps, or sets and failing to remove them when they are no longer needed can result in memory leaks.
- Caching: Caching data without proper eviction policies can lead to excessive memory usage, causing memory leaks if the cached data is never removed.
- Event listeners: Registering event listeners or callbacks without removing them when they are no longer required can lead to memory leaks, as the event source retains references to the listeners.
- Thread and Executor mismanagement: Creating threads or using ExecutorService without proper termination can cause memory leaks, as the thread objects and associated resources are not released.
- Resource handling: Not properly releasing resources such as file handles, database connections, or network connections can lead to memory leaks.
Myth 3: Memory leaks are only caused by the Java Runtime Environment
While bugs in the Java Runtime Environment (JRE) or the Java Virtual Machine (JVM) could potentially lead to memory leaks, the majority of memory leaks are caused by issues within the application code itself, not the JRE.
Memory leaks in Java applications are typically a result of improper memory management, such as retaining references to objects that are no longer needed or not releasing resources appropriately. These issues are directly related to how developers design, write, and maintain their code.
While the JRE and JVM are responsible for managing memory and performing garbage collection, they cannot fix memory leaks caused by application code. The garbage collector can only reclaim memory from objects that are no longer reachable from the application's root references.
If an object is still referenced (even indirectly) by some part of the application, it will not be garbage collected, resulting in a memory leak.
To address memory leaks in Java applications, developers must focus on writing efficient and clean code, managing object references correctly, and handling resources appropriately. Utilizing memory profiling tools can also help identify memory-intensive areas and potential memory leaks in the application code.
Myth 4: Memory leaks are only caused by explicit memory allocation (new operator) and forgetting to deallocate (delete)
The myth that memory leaks in Java are only caused by explicit memory allocation with the new operator and forgetting to deallocate with a delete operator is incorrect, primarily because there is no delete operator in Java.
This myth is likely derived from languages like C++ that require manual memory management, where developers must explicitly deallocate memory with the delete operator that was previously allocated with new.
In Java, memory management is largely handled by the JVM's garbage collector, which automatically deallocates memory from objects that are no longer in use. However, this does not mean that memory leaks cannot occur in Java.
Memory leaks in Java are generally caused by unintentionally keeping references to objects, which prevents the garbage collector from reclaiming their memory.
Long-lived references (like static fields) can be a common cause of memory leaks. If a static field holds a reference to an object, that object remains in memory for the duration of the application since static fields are associated with the class, not instances of the class.
Improper use of ThreadLocal variables can often lead to memory leaks, as the values stored in these variables are not automatically removed when the thread is finished.
Myth 5: Memory leaks can be fixed by increasing the heap size (Xmx)
The myth that memory leaks can be fixed by simply increasing the heap size (Xmx) is not accurate. While increasing the heap size can temporarily delay the impact of a memory leak, it does not address the root cause of the problem.
In fact, increasing the heap size without addressing the underlying memory leak can lead to more severe performance issues and might eventually result in running out of memory altogether, causing an OutOfMemoryError.
Here's why increasing the heap size is not a proper solution for memory leaks:
- Increasing the heap size doesn't fix the memory leak; it just delays the issue.
- Larger heap size leads to longer pauses, making the application slower.
- Allocating more memory than needed wastes resources and affects overall system performance.
- Increasing the heap size hides the real problem and prevents finding a permanent solution.
By addressing the root cause of memory leaks rather than merely increasing the heap size, you can ensure better application performance, stability, and efficient use of system resources.
Myth 6: Using the finalize() method ensures that objects are correctly deallocated and prevents memory leaks.
The myth that using the finalize() method ensures that objects are correctly deallocated and prevents memory leaks is not accurate. In reality, the finalize() method is not a reliable or recommended way to manage memory and prevent memory leaks in Java.
Here are the reasons why relying on the finalize() method to manage memory is not a good practice:
- The
finalize()method is unpredictable, and its timing depends on the garbage collector, leading to delayed resource cleanup or leaks. - Using
finalize()can negatively impact performance by slowing down garbage collection. - There's no guarantee
finalize()will execute promptly or at all, potentially causing resource leaks. - The
finalize()method cannot access the object's data or related objects, making resource cleanup challenging.
Given these drawbacks, the use of the finalize() method is considered a poor practice for memory management in Java.
Instead, the recommended approach to prevent memory leaks and manage resources is as follows:
- Explicit resource management: In Java, developers are responsible for explicitly releasing resources when they are no longer needed. This is typically done using the close() or dispose() methods, depending on the type of resource being used (e.g., files, database connections, network sockets, etc.).
- Try-with-resources: For resources that implement the java.lang.AutoCloseable interface, use try-with-resources to ensure resources are properly closed, even in the presence of exceptions.
- Manual memory management: Focus on managing object references properly. Set references to null when objects are no longer needed, allowing them to become eligible for garbage collection.
- Use memory profiling tools: Employ memory profiling tools to identify potential memory leaks and resource-intensive areas in the application. This can help detect and address memory-related issues early in the development process.
Myth 7: Memory leaks are easy to detect and fix with automated tools.
The myth that memory leaks are easy to detect and fix with automated tools is not entirely accurate. While there are memory profiling and analysis tools available that can help identify potential memory leaks, detecting and fixing memory leaks can be a complex and challenging task that often requires manual intervention and understanding of the application's behavior.
Here are some reasons why automated tools may not be sufficient for detecting and fixing memory leaks:
- Memory leaks are complex issues, making them hard to detect and fix in the code.
- Automated tools can generate false positives, leading to wasted time investigating non-existent problems.
- Memory profiling tools might not cover the entire application's logic, requiring manual analysis for detection.
- Developers need a deep understanding of the application's behavior and memory usage patterns to effectively fix memory leaks.
- Memory leaks can result from specific coding patterns or usage scenarios unique to the application, necessitating manual analysis for resolution.
While automated tools can be valuable aids in the memory leak detection process, they are most effective when combined with manual inspection and analysis by skilled developers.
Conclusion
In your role as an SRE, it is important that you educate non-technical stakeholders about JVMs and memory management.
It is crucial to raise awareness and address misconceptions so you can demonstrate your value to a budget as well as justify budgets and resources such as hardware, staffing, and good monitoring and diagnostic tools in the long term.
Setting up the right tools to diagnose and fix memory leaks accurately will minimize Mean Time To Resolution (MTTR) and prevent your business from risking its Service Level Agreements.
Remember that fixing memory leaks can be challenging, particularly in large and complex applications. It requires a good understanding of the application's behavior, careful analysis, and testing. Regular monitoring and proactive maintenance can help prevent memory leaks from becoming critical issues in production environments.
Monitor your Entire Java Application with Atatus
With Atatus Java performance monitoring, you can monitor the performance and availability of your Java application in real-time and receive alerts when issues arise. This allows you to quickly identify and troubleshoot problems, ensuring that your application is always running smoothly.
Monitor the performance of your Java application down to the individual request level. This allows you to see exactly how long each request is taking to process, as well as any errors or exceptions that may have occurred.
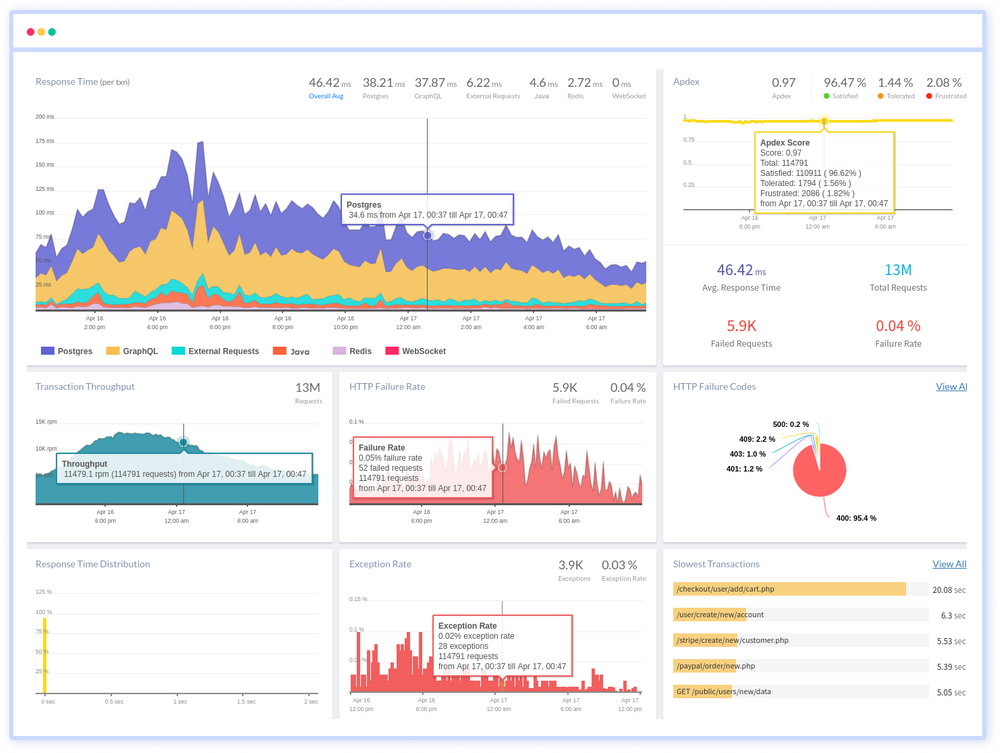
You can also see a breakdown of the different components of your application, such as the web server, database, and external services, to see how they are affecting performance.
Atatus also offers a range of tools and integrations that can help you to get the most out of your monitoring. For example, you can integrate Atatus with popular tools like Slack, PagerDuty, and Datadog to receive alerts and notifications in your preferred channels.
If you are not yet a Atatus customer, you can sign up for a 14-day free trial .
#1 Solution for Logs, Traces & Metrics
![]() APM
APM
![]() Kubernetes
Kubernetes
![]() Logs
Logs
![]() Synthetics
Synthetics
![]() RUM
RUM
![]() Serverless
Serverless
![]() Security
Security
![]() More
More