A Guide on How to Monitor GraphQL APIs
GraphQL has replaced REST since its debut in 2015 and has gained popularity. It provides the flexibility frontend developers have longed for.
The days of begging with backend developers for single-purpose endpoints are over. Now, a query can provide all the necessary data and request it at once, theoretically reducing latency by a significant amount.
Everything was much easier with REST, especially monitoring. The backend team could immediately determine what is going on by looking at the measurements of each endpoint.
This is no longer the case with GraphQL. Since there is frequently only one endpoint, measuring at each endpoint is not very helpful. Where are the new locations to connect to the system, then?
In this article, we will see what is GraphQL, how it works, GraphQL architecture, considerations for implementation, monitoring, and how to test GraphQL API.
We will cover the following:
- What is GraphQL?
- How Does GraphQL Works?
- GraphQL Architecture
- Considerations for Implementing GraphQL
- Monitoring GraphQL API
- How to Test GraphQL API?
What is GraphQL?
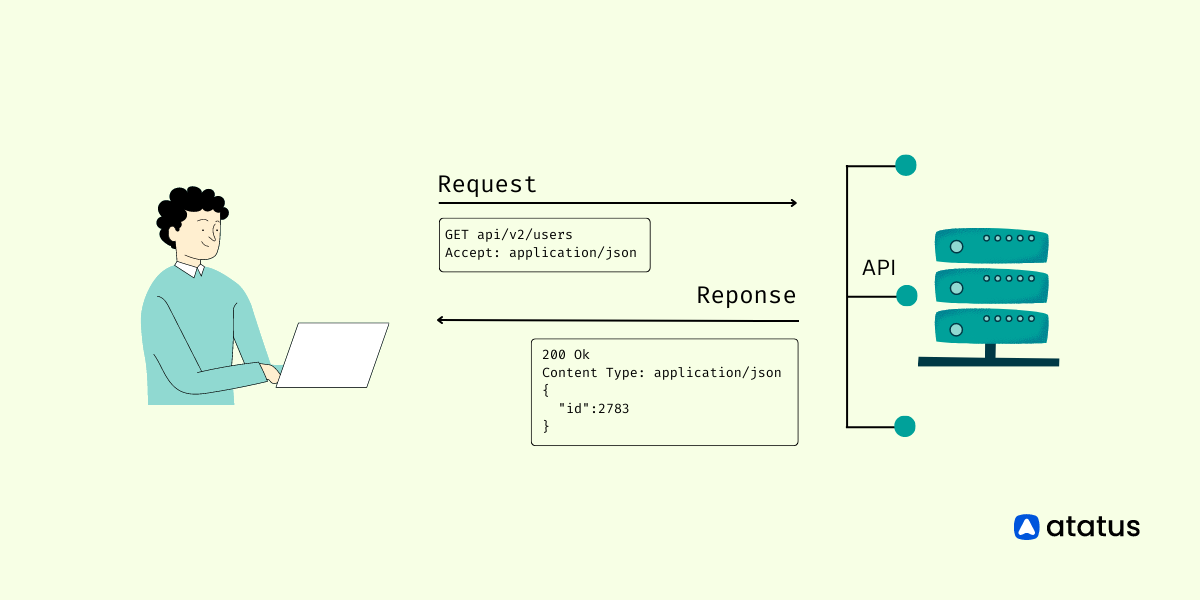
GraphQL is a query language for APIs and a runtime for answering those queries with already-existing data. GraphQL APIs use types and fields rather than specific URL endpoints with preset responses to get all the data the application needs in a single request, in contrast to REST APIs that need loading from various resources, or URLs.
Although GraphQL services can be developed in any language, the GraphQL schema language ensures that everything is consistent regardless of the language used. The majority of developers should be familiar with the format of object types found in schemas, which indicate a type of object that you may fetch and its related data.
type Character {
    name: String!
    appearsIn: [Episode]!
}
The creator of the GraphQL server provides a function known as the resolver that supports each field on each type. When a field is performed, the corresponding resolver is called to generate the subsequent value. The execution is finished when every field returns a scalar value, not an additional object.
The fact that backend developers don't have to worry about creating unique replies or versioning APIs is a major advantage of this strategy. As a result, frontend teams can work much more quickly without having to wait for backend changes to take effect.
The frontend only requests the data it requires, which reduces the number of queries that must be made and enhances both frontend and backend performance.
How Does GraphQL Work?
Users can choose the fields they want to include in a query by specifying which data sources and sources they want to use with GraphQL. It accomplishes this by specifying the output's form within the query itself. Due to this feature, GraphQL queries have a different look that closely resembles the responses to the queries.
To offer you access to all the data sources you might want for a specific application or page, GraphQL APIs typically have a single endpoint.
Client and server components both exist in GraphQL APIs. On the client-side, it's typical to utilize a library that supports your preferred programming language's GraphQL standard. A GraphQL API server parses GraphQL API requests on the server-side and retrieves the appropriate data from backend services and data stores for each request.
GraphQL Architecture
Let's examine the potential architectures to get a sense of where the interesting parts of our system are.
GraphQL systems typically comprise three components:
- A schema outlining each data type
- A GraphQL engine that routes each component of a query to a resolver by using the schema
- One or more resolvers, which are the functions that the GraphQL engine calls
The GraphQL backend begins by processing the schema to inform the server which type corresponds to which resolver. When we send a request to the GraphQL endpoint, the engine parses it and, for each requested type, runs our resolvers to fulfill the request.
As you may expect, this strategy only performs well when applied to simple queries.
In our data sources (database or third-party API), parts of the query can occasionally be related. As an example, we are loading a user account along with its address. There might only be one record in the data source, but there could be two types in the GraphQL schema. We wouldn't anticipate the server to make two requests to the data source if we made both queries at once.
People started using a pattern called data-loader to solve this issue.
Another layer in our GraphQL API called a data-loader stands between our resolvers and our data source.
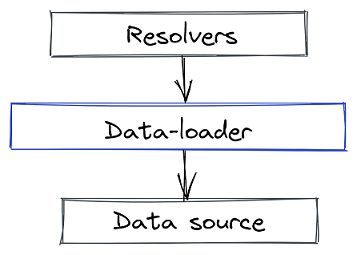
In the more complicated iteration, the resolvers would communicate their needs to a data-loader, who would then access the data source on their behalf. In the simpler setup, the resolvers would directly access the data source.
Why is this beneficial?
The data-loader can combine access to the data source after waiting until all resolvers have been called.
Did anyone wish to load the address and user account?
The data source has only received one request at this time.
The concept is that although each resolver is only aware of its requirements, the data-loader is aware of what each resolver needs and can therefore optimize access.
Considerations for Implementing GraphQL
Depending on whether you're developing a brand-new project or modifying an existing codebase, it makes sense to approach a GraphQL API implementation for your web or mobile application differently. Here are two methods of implementation you can use.
- Create New APIs
Businesses decide to begin their GraphQL journey with a brand-new, "greenfield" API. They frequently start with an internal, non-mission-critical API and work their way up to mission-critical use cases as they gain GraphQL proficiency. - Abstract Existing APIs
Organizations can also start using GraphQL by abstracting existing APIs. The benefits of GraphQL are delivered for a group of existing APIs by abstracting several endpoints into a single GraphQL API without having to migrate the APIs or start from scratch with the application.
Monitoring GraphQL API
As we can see, there are various locations where we can monitor our GraphQL API based on our architecture.
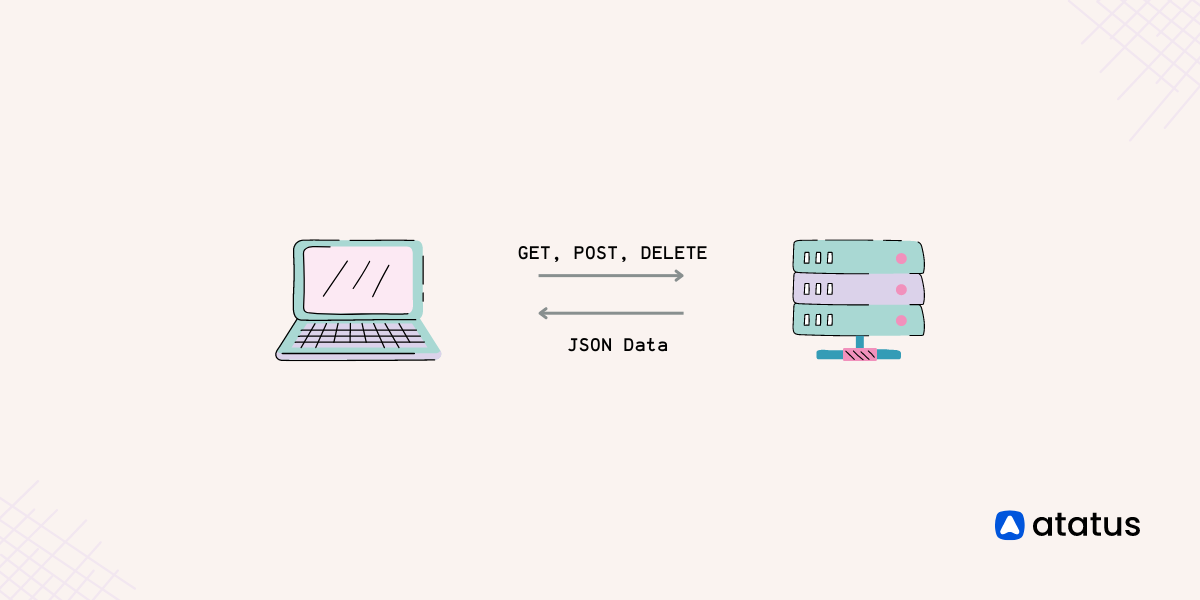
- HTTP Endpoint
For every single request that comes to our API - GraphQL Query
For each unique request - GraphQL Resolver and Data-loader
Each time you access the data source - Tracing
Following each query, they affect
#1 HTTP Endpoint
For a REST API, the HTTP endpoint was what we watched. Since there is frequently only one in the GraphQL world, monitoring at this level merely provides us with data on the overall health of our API.
Not awful at all. It provides us with a starting place, at least. We can save time and money by only looking at these metrics if everything is in order—there are no customer complaints, low latency, low error rates, and all the boxes are checked.
We must examine more if something seems odd.
#2 GraphQL Query
The next step would be to examine each query, which can be sufficient for APIs with largely consistent usage patterns. It is obvious that the requests won't change frequently if we use our API exclusively for our clients, but if we make our API open to multiple customers with varying requirements, things become more complicated.
All of a sudden, we might have hundreds of (somewhat) different queries that are all slow for a variety of reasons.

Checking for the most frequent queries and attempting to synthetically monitor them is one way to solve this problem. This implies that whenever we release a new version, we define a good amount of query and variable combinations and run them through test clients to see how long they take.
By doing this, we can lower the possibility that an update may result in significant performance regressions. Persisted queries may be useful here. They provide us with a way to cache the most popular requests.
If things start to get out of hand, we must move forward.
#3 GraphQL Resolver and Data-loader
Where the action happens is frequently the best spot to monitor what's going on. We can understand reality better if we take a closer look at the places in our backend that access the data source.
- Is the data source type we used just inappropriate for the access patterns?
- Do we require a different category of the database?
- Is our data source type okay, but do our queries to them need to be improved?
- If we haven't already used a data-loader, do we really need one?
- Do we send too-slow requests to external APIs?
- Are we able to recreate such information closer to our backend?
Now that we know what and how the data is retrieved in our backend, we can ask all of these queries.
We can also see another advantage of a data-loader here. The data-loader enables us to view what all resolvers do in a single request and also enables us to address inter-resolver issues as soon as we become aware of them, whereas the resolvers just allow us to monitor what one resolver does.
#4 Tracing
This is the highest form of monitoring discipline. Tagging a query with a tracing-ID as it is received and passing this ID to resolvers, data-loaders, and possibly even the data source when it is translated.
This enables us to log durations and errors with the tracing-ID so that we can subsequently combine them to get the wider picture.
The following is the concept:
The actual data loading is done later in the resolvers and/or data-loaders and not during parsing the query, though measuring a query may provide some statistics on how long it took to resolve.
Since one of the fundamental concepts of GraphQL is detaching the queries from the actual data loading, we don't work with queries anymore when loading the data, but it is still nice to monitor what happens in the background when someone sends a query.
How to Test GraphQL API?
The majority of functional GraphQL testing is created to make sure that the frontend schema, queries, and mutations function as expected. Depending on your language, platform, test infrastructure, and specialized testing needs, there is a growing ecosystem of tools available to execute these types of tests.
One of the most well-liked functional GraphQL testing tools for JavaScript developers is EasyGraphQL, for instance. You can quickly test assertions to confirm API replies as part of an automated test suite by integrating with a tool like Mocha.
You should employ a few different kinds of testing, including:
- Load Tests
Load testing makes ensures that an API maintains its performance even under heavy load. - Mutation Tests
Mutation tests make certain that a particular query effectively saves data in a database. - Security Tests
Security tests make sure that APIs don't return sensitive information without taking the proper security measures. - Query Tests
Query tests make sure a given query produces the correct response.
To prevent wasting resources and shorten test execution times, you might also want to simulate responses while testing external web services that use GraphQL, such as GitHub V4.
In some situations, mocks and fixtures can successfully simulate these services, but in others, it can be helpful to virtualize them to evaluate their use and other metrics.
Conclusion
Since its launch, GraphQL has experienced enormous growth in popularity. Knowing how a GraphQL API's backend is organized helps us come up with more practical suggestions for where to place system monitoring tools.
There is no doubt that things are a little more complicated than with REST APIs, but GraphQL APIs are simply pieces of code that can be used for various uses, such as monitoring. We can better understand the issues with caching and error handling if we have visibility into our production systems.
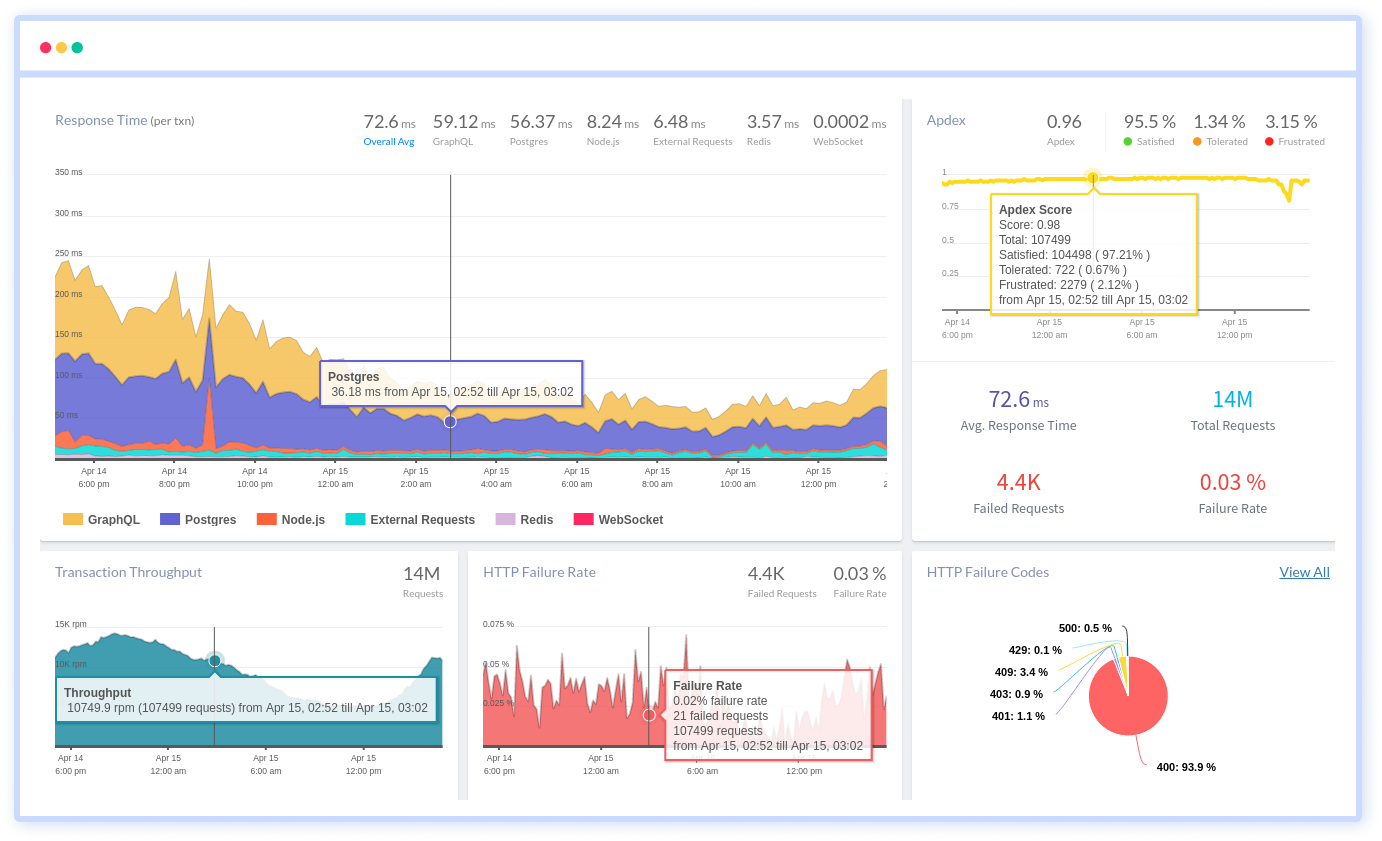
Atatus API Monitoring and Observability
Atatus provides Powerful API Observability to help you debug and prevent API issues. It monitors the consumer experience and be notified when abnormalities or issues arise. You can deeply understand who is using your APIs, how they are used, and the payloads they are sending.
Atatus's user-centric API observability tracks how your actual customers experience your APIs and applications. Customers may easily get metrics on their quota usage, SLAs, and more.
It monitors the functionality, availability, and performance data of your internal, external, and third-party APIs to see how your actual users interact with the API in your application. It also validates rest APIs and keeps track of metrics like latency, response time, and other performance indicators to ensure your application runs smoothly.
#1 Solution for Logs, Traces & Metrics
![]() APM
APM
![]() Kubernetes
Kubernetes
![]() Logs
Logs
![]() Synthetics
Synthetics
![]() RUM
RUM
![]() Serverless
Serverless
![]() Security
Security
![]() More
More