Kubernetes Logging
You will notice that monitoring and logging don't appear on the list of core Kubernetes features. However, this is not due to the fact that Kubernetes does not offer any sort of logging or monitoring functionality at all. It does, but it’s complicated.
Kubernetes’ kubectl tells us all about the status of the different objects in a cluster and creates logs for certain types of files. But ideally speaking, you won't find a native logging solution embedded in Kubernetes.
This is why logging becomes all the more important when it comes to Kubernetes. And we will discuss exactly that here!
This is only but a DIY approach to avail logging abilities on your Kubernetes clusters; if you are looking for a more pronged approach, I would suggest you try out Atatus Log monitoring instead.
Let's discuss the following:-
- Kubernetes: An Overview
- Kubernetes Logs
- Logging Architecture
- Kubernetes node logging
- Kubernetes system components logging
- Popular log aggregator tools for Kubernetes logs
Kubernetes: An Overview
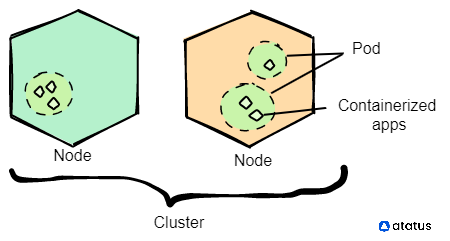
Kubernetes is an open-source system for scaling and managing containerized applications. It is an orchestration tool like docker swarm, which allows the working of several micro applications in the same frame.
Kubernetes manages several containers together. When you command the clusters appropriately, all the applications within them start working accordingly. Thus, Kubernetes eliminates the need to manage each and every application individually.
Three features that set Kubernetes apart are - deployment, development, and monitoring.
The server stack in Kubernetes comprises a central master node that controls all other connected worker nodes. When docker images are added to this server stack which is to be deployed, the Kubernetes engine connects all such servers or whole containers together.
Kubelet is a node agent that enables each microservices in worker nodes to run efficiently. Each node has one kubelet in it.
Although Kubernetes is a wonderful orchestration platform, its complex learning curve, inability to operate in small-scale applications and limited accuracy in case of transferred non-containerized applications to K8 machinery reduces the overall appeal of this platform.
Kubernetes Logs
Logs are the timestamped data of every event that occurs within each compartment of your application. Logging can be considered the first line of defense for finding bugs and other blockages. It is also the most simplest way of observing your system programs.
Kubernetes is a dynamic entity with multiple containers storing multitudes of applications on it. It has a default logging option. i.e., Kubernetes stores all the log data from all of its applications onto a separate file (while still intact). But once these pods crash or get deleted, Kubernetes automatically cleans all the associated logs. This part is what necessitates a central logging and application monitoring tool for kubernetes pods. You can choose from a plethora of options available on the market to go for an apt log monitor product.
The types of log data that you can collect from Kubernetes are:-
- Application logs - the applications running within K8 containers produce logs. These logs are written to stdout and stored within the containers.
- Cluster logs - kube-apiserver, kube-scheduler, etcd, kube-proxy and kubelet generate logs. These log files are generally stored under the /var/log directory of the server where the service runs.
- Kubernetes events - events are all the changes occurring to the clusters. I.e., changes happening as a result of creating or exhaustion, or deletion of a container.
- Audit logs - they record the transaction pathway of a request, like that of a request directed to the API server asking for a particular resource, the user who requested it, the number of times the request was accessed and so on.
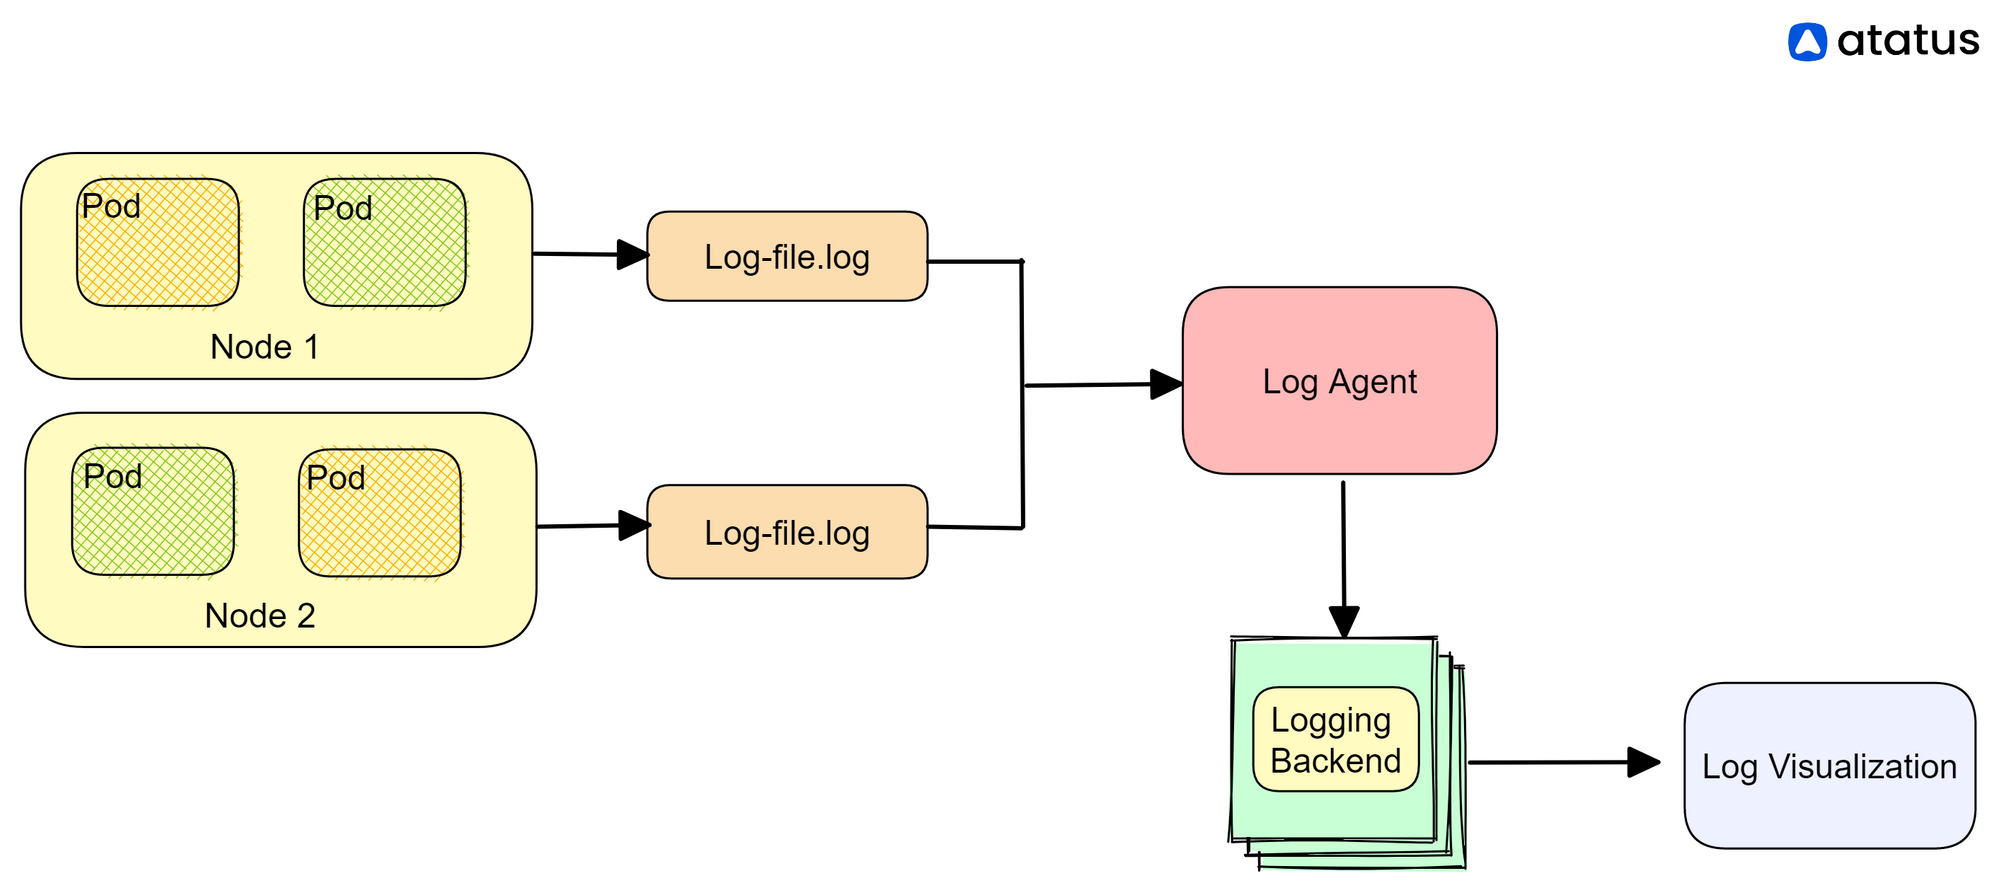
Logging Architecture
Logs are very important to monitor the working of your application. They serve as a diary, recording everyday activities and tracing customer request transactions across the entire Kubernetes architecture.
Writing to standard outputs and standard error streams is the easiest and most popular method for logging containerized applications.
1. Logging using stdout and stderr
To log using stdout and stderr in Kubernetes, you can modify your container's configuration to write logs to these streams. Here is an example of how to log using stdout and stderr in a Kubernetes Pod:
apiVersion: v1
kind: Pod
metadata:
  name: my-pod
spec:
  containers:
  - name: my-container
    image: my-image
    command: ["my-command"]
    args: ["arg1", "arg2"]
    volumeMounts:
    - name: logs
      mountPath: /var/log/my-app
  volumes:
  - name: logs
    emptyDir: {}
In this example, the command and args fields specify the command and arguments to be run in the container. The volumeMounts field specifies a volume to mount in the container at the path /var/log/my-app, which is where the logs will be written to.
To write logs to stdout and stderr, you can modify the command and arguments to redirect output to these streams. Here is an example:
apiVersion: v1
kind: Pod
metadata:
  name: my-pod
spec:
  containers:
  - name: my-container
    image: my-image
    command: ["/bin/sh", "-c"]
    args: ["my-command arg1 arg2 1>>/proc/1/fd/1 2>>/proc/1/fd/2"]
    volumeMounts:
    - name: logs
      mountPath: /var/log/my-app
  volumes:
  - name: logs
    emptyDir: {}
In this example, the command field specifies /bin/sh as the shell to use, and the args field specifies the command to be run with the arguments my-command arg1 arg2. The 1>>/proc/1/fd/1 and 2>>/proc/1/fd/2 parts redirect standard output and standard error to the container's stdout and stderr streams, respectively.
Once the Pod is running, you can use Kubernetes logging tools to view the logs written to stdout and stderr. For example, you can use the kubectl logs command to view the logs for a specific container in a Pod:
kubectl logs my-pod my-container
This will display the logs written to stdout and stderr by the container. If you want to access logs of a crashed instance, you can use –previous.
2. Logging using sidecar
A sidecar container is a secondary container that runs alongside the main container in a Kubernetes Pod. In the context of logging in Kubernetes, a sidecar container can be used to collect and forward logs from the main container to a centralized logging service or tool.
The sidecar container can be configured to collect logs from the main container by accessing the logs written to stdout and stderr or by directly accessing log files written by the main container. Once the sidecar container has collected the logs, it can forward them to a centralized logging service or tool such as Elasticsearch, Fluentd, or Stackdriver.
Here's an example of a Kubernetes Pod with a sidecar container for logging:
apiVersion: v1
kind: Pod
metadata:
  name: my-pod
spec:
  containers:
  - name: my-app
    image: my-image
    command: ["my-command"]
    args: ["arg1", "arg2"]
    volumeMounts:
    - name: logs
      mountPath: /var/log/my-app
  - name: my-logger
    image: my-logger-image
    volumeMounts:
    - name: logs
      mountPath: /var/log/my-app
  volumes:
  - name: logs
    emptyDir: {}
In this example, the my-app container is the main container that runs the application and writes logs to stdout and stderr. The my-logger container is the sidecar container that collects and forwards the logs to a centralized logging service or tool.
Both containers share the same volume logs, which is an emptyDir volume that is created when the Pod is created. The my-app container writes logs to the /var/log/my-app directory in this volume, and the my-logger container collects logs from this directory.
The my-logger container can be configured to forward logs to a centralized logging service or tool by specifying the appropriate output plugin for the logging agent used in the container. For example, if Fluentd is used as the logging agent, the output plugin can be configured to forward logs to Elasticsearch or Stackdriver.
Using a sidecar container for logging in Kubernetes provides several benefits, including:
- Separation of concerns: The main container can focus on running the application, while the sidecar container handles the logging.
- Scalability: The sidecar container can be scaled independently of the main container to handle large volumes of logs.
- Standardization: The sidecar container can provide a standard interface for logging across all containers in the Pod.
Kubernetes node logging
In Kubernetes, nodes are the worker machines that run the containers. Node logging refers to the process of collecting and analyzing logs generated by the nodes themselves, as well as logs generated by the containers running on the nodes.
Node logging can be important for troubleshooting issues related to node health, resource utilization, and container performance. Kubernetes provides several options for collecting and analyzing node logs.
Kubernetes itself generates logs that can be used for troubleshooting node-related issues. These logs can be accessed using the kubectl logs command, or by accessing the logs directly on the node.
There are several logging agents that can be installed on each node to collect and forward logs to a centralized logging service or tool. These agents can collect logs generated by the node, as well as logs generated by containers running on the node. Examples of popular logging agents include Atatus, Fluentd, Sysdig, and Datadog.
A daemonset is a Kubernetes object that ensures that a specific pod is running on each node in the cluster. A daemonset can be used to deploy a logging agent as a sidecar container on each node, which can then collect and forward logs to a centralized logging service or tool.
Each node in a Kubernetes cluster maintains log files that contain information about the node's activity and performance. These log files can be accessed directly on the node or using a log analysis tool.
When setting up node logging in Kubernetes, it's important to consider factors such as log collection frequency, log retention policy, log storage requirements, and log analysis capabilities. By configuring effective node logging, Kubernetes administrators can gain insight into the health and performance of their nodes and applications, and troubleshoot issues more effectively.
Kubernetes system components logging
Kubernetes has several system components that are critical for managing the cluster and its workloads. These components generate logs that can be useful for troubleshooting issues and monitoring the health and performance of the cluster. Some of the key Kubernetes system components that generate logs include:
- kube-apiserver: The Kubernetes API server serves as the front-end for the Kubernetes control plane. It exposes the Kubernetes API and processes RESTful requests from clients. The kube-apiserver logs contain information about API requests, responses, and errors.
- kube-controller-manager: The kube-controller-manager is responsible for managing various controllers that automate tasks in the cluster, such as node and pod management. The logs generated by the kube-controller-manager contain information about the status of controllers and the actions they perform.
- kube-scheduler: The kube-scheduler assigns pods to nodes based on resource availability and other factors. The logs generated by the kube-scheduler contain information about scheduling decisions and events.
- kubelet: The kubelet runs on each node in the cluster and is responsible for managing the lifecycle of pods on the node. The kubelet logs contain information about pod events, container status, and other node-related events.
- etcd: Etcd is the distributed key-value store used by Kubernetes to store cluster data. The etcd logs contain information about etcd events and transactions, such as key-value changes and leadership changes.
- kube-proxy: The kube-proxy is responsible for routing traffic to services in the cluster. The kube-proxy logs contain information about service events, such as load balancing and proxying decisions.
These system component logs can be accessed using the kubectl logs command or by accessing the logs directly on the node. Additionally, most logging agents used for Kubernetes logging can collect these system component logs and forward them to a centralized logging service or tool for analysis.
By monitoring and analyzing the logs generated by Kubernetes system components, administrators can gain insight into the health and performance of the cluster, troubleshoot issues, and optimize resource utilization.
Popular log aggregator tools for Kubernetes Logs
There are several logging agents available for Kubernetes logs, including:
- Fluentd: Fluentd is an open-source log collector and aggregator that can collect logs from various sources, including Kubernetes, and forward them to multiple destinations. It supports a wide range of input and output plugins and can handle structured and unstructured data.
- Elasticsearch: Elasticsearch is a distributed search and analytics engine that can be used for logging and monitoring in Kubernetes. It allows you to index and search logs in real-time and provides powerful search and analysis capabilities.
- Prometheus: Prometheus is a popular open-source monitoring and alerting toolkit that can be used for logging in Kubernetes. It uses a pull-based model to collect metrics and provides a powerful query language for analyzing logs.
- Stackdriver Logging: Stackdriver Logging is a logging service provided by Google Cloud Platform that can be used for logging in Kubernetes. It supports various sources and provides powerful search and analysis capabilities. It also integrates with other Google Cloud services for easy management.
- Splunk: Splunk is a popular log management and analysis platform that can be used for logging in Kubernetes. It supports various sources and provides powerful search and analysis capabilities. It also has a wide range of plugins and integrations with other tools and services.
These logging agents can be deployed as Kubernetes pods or as part of a Kubernetes cluster. The choice of logging agent depends on your specific needs and requirements.
Conclusion
Kubernetes has features that allow it to function well in larger clusters because of its centralized nature which also makes it more scalable than other tools such as Mesos or Cloud Foundry when it comes to running clusters in production environments.
This very merit can be a reason of concern, especially when you look at the logging aspects. It has a default logging option. I.e., Kubernetes stores all the log data from all of its applications onto a separate file (while still in tact).
But once these pods crash or get deleted, kubernetes automatically cleans all the logs associated with them too. This part is what necessitates a central logging and application monitoring tool for Kubernetes pods.
We have discussed node-level log management and component level log management, both within Kubernetes environment. However, for more prominent and transparent monitoring capabilities, a customized log management tool would greatly help.
Atatus Logs Monitoring and Management
Atatus offers a Logs Monitoring solution which is delivered as a fully managed cloud service with minimal setup at any scale that requires no maintenance. It monitors logs from all of your systems and applications into a centralized and easy-to-navigate user interface, allowing you to troubleshoot faster.

We give a cost-effective, scalable method to centralized logging, so you can obtain total insight across your complex architecture. To cut through the noise and focus on the key events that matter, you can search the logs by hostname, service, source, messages, and more. When you can correlate log events with APM slow traces and errors, troubleshooting becomes easy.
#1 Solution for Logs, Traces & Metrics
![]() APM
APM
![]() Kubernetes
Kubernetes
![]() Logs
Logs
![]() Synthetics
Synthetics
![]() RUM
RUM
![]() Serverless
Serverless
![]() Security
Security
![]() More
More
