The MongoDB Performance Monitoring Toolkit
MongoDB is a very popular database used by Node JS developers, especially beginners (who think it is the default option). True that, MongoDB is renowned for its ability to scale horizontally, accommodate dynamic schemas, and deliver high-performance results. However, the seamless operation of any database, including MongoDB, relies heavily on efficient monitoring to uncover insights and identifying potential issues that may compromise performance and reliability.
This article delves into MongoDB monitoring, shedding light on the essential tools, techniques, and key performance indicators that empower database administrators and developers to maintain a robust and responsive MongoDB deployment.
From built-in commands to advanced third-party solutions, we explore the comprehensive spectrum of monitoring options available, each designed to provide a better understanding of MongoDB's inner workings.
Table Of Contents:-
- MongoDB: Definition and Key Features
- Why Monitor MongoDB?
- What Metrics to Monitor?
- Built-in MongoDB Monitoring Commands
- Other Popular Monitoring Tools
MongoDB: Definition and Key Features
MongoDB is a popular, open-source NoSQL (non-relational) database management system that is designed to handle large volumes of unstructured or semi-structured data. It falls under the category of document-oriented databases, meaning it stores data in flexible, JSON-like documents instead of traditional rows and columns as seen in relational databases.
Key features of MongoDB:
- MongoDB stores data in BSON (Binary JSON) documents, which are JSON-like objects. Each document can have a different structure, making it flexible for handling diverse data types.
- It groups related documents into collections. Collections are similar to tables in relational databases, but they don't enforce a schema across all documents in a collection.
- Unlike traditional relational databases, MongoDB is schema-less, meaning you can insert documents into a collection without a predefined structure. Each document in a collection can have different fields.
- MongoDB provides a rich set of query operators for performing CRUD (Create, Read, Update, Delete) operations on documents. The query language is designed to be expressive and flexible.
- It supports the creation of indexes on fields within a collection to improve query performance.
- Includes a powerful aggregation framework that allows you to perform complex data transformations and analysis on the server side.
- MongoDB is designed to scale horizontally by sharding data across multiple servers. This makes it suitable for handling large and growing datasets.
- MongoDB supports replication, allowing you to create multiple copies of your data across different servers to ensure high availability and fault tolerance.
- You can perform ad-hoc queries on MongoDB without the need for a predefined schema, making it easy to adapt to changing data requirements.
MongoDB is commonly used in modern web applications, content management systems, real-time analytics, and other scenarios where flexibility and scalability are essential. It has gained popularity due to its ease of use, scalability, and support for a wide variety of data models.
Why monitor MongoDB?
MongoDB is one of the most powerful databases available right now. However, most of the data stored nowadays is relational, and that is a problem. For example, users list, orders list, products, and product categories are all relational data by nature. And although MongoDB has some relational features, it is not enough to support when you scale applications.
Firstly, mongoDB is not the only option if you are a Node JS developer. Yes, Mongoose is a very good ORM for Node JS, but it is not the only one. There are several relational databases that work much faster and more efficiently.
But for this, you must put all the data in the same table in a relational database like MySQL. You can achieve the same speed or even higher as you would get using a MongoDB solution.
The other popular point with MongoDB is its schema design, there is no hard and fast structure and this may feel good to hear, but designing a schema priorly will only help you later, especially during production stage.
Talking about relational databases, it means joining two or more collections. MongoDB has an $lookup operator for this purpose but usually developers and engineers advice against it because, it is rather a heavy operation and does not have any foreign keys to support this.
Lastly, MongoDB doesn’t guarantee data integrity. Why I say so is because it lacks relations and doesn't fully support ACID transactions, and when you can’t guarantee multi-document transactions and application-level checks, security can be compromised.
What Metrics to Monitor?
Monitoring MongoDB involves tracking various metrics to gain insights into the performance, health, and behavior of your database. Here are some key metrics to monitor in MongoDB:
1. Database Operations
i.) Command - In MongoDB, a command is a special type of operation used to perform administrative tasks or execute specific actions. For example, The db.runCommand() method allows you to run a specific command. For instance, db.runCommand({ serverStatus: 1 }) retrieves various statistics about the MongoDB server.
ii.) Query - A query operation is used to retrieve documents from a MongoDB collection based on specified criteria.
iii.) Update - An update operation modifies existing documents in a MongoDB collection matching the specified criteria by setting a new value for a field.
iv.) getMore - The getMore operation is part of the MongoDB wire protocol and is used to fetch additional batches of documents from a cursor. Typically, applications do not explicitly use getMore as it is handled internally by the MongoDB driver when iterating over large result sets.
v.) Insert - An insert operation adds new documents to a MongoDB collection.
2. Cluster Operation and Connection Metrics
i.) Opcounters - Counts the number of database operations (inserts, queries, updates, deletes, commands) performed.
ii.) Operation Execution Time - Measures the execution time of various database operations. Identifies slow-performing operations and helps in optimizing queries.
iii.) Query Executors - Tracks the number of query executors currently active. Indicates the level of parallelism in query execution, helping to optimize resource utilization.
iv.) Connections - Counts the number of incoming connections to the MongoDB server. Monitors the level of concurrent connections and helps in capacity planning.
v.) Queues - Measures the number of operations currently queued for execution. Indicates potential bottlenecks or resource contention, helping to optimize performance.
3. Replication Metrics
i.) Replication Lag - Measures the time delay between the most recent operation on the primary node and the corresponding operation on secondary nodes. Indicates the replication delay, helping to assess the consistency of secondary nodes.
ii.) Replication Oplog Window - Represents the time interval covered by the oplog. Helps assess how far back in time a secondary node can catch up with the primary using its oplog.
iii.) Oplog GB/Hour - Calculates the rate at which the oplog grows in gigabytes per hour. Assesses the oplog growth rate for capacity planning and replication performance.
iv.) Opcounters-repl - Similar to opcounters but specific to the replication process. Monitors replication-specific operations, providing insights into replication activity.
4. Hardware Metrics
i.) System CPU Usage - Measures the percentage of CPU utilization by the MongoDB process.
ii.) Disk Utilization - Monitors the disk space usage, including read and write operations.
iii.) Memory Utilization - Measures the percentage of RAM used by the MongoDB process.
These metrics can be collected using MongoDB's built-in tools, third-party monitoring solutions, or a combination of both. Analyzing these metrics over time helps you understand the behavior of your MongoDB deployment, troubleshoot issues, and optimize performance. Consider setting up alerts based on these metrics to receive notifications when certain thresholds are reached.
Built-in MongoDB Monitoring Commands
MongoDB provides several built-in commands for monitoring and managing the database. These commands can be executed in the MongoDB shell or through a MongoDB driver. Here are some of the key built-in monitoring commands:
a.) Provides an overview of the database, including the number of collections, indexes, and the size of the data.
db.stats()b.) Returns a comprehensive set of metrics about the database server, including information on connections, memory usage, and network statistics.
db.serverStatus()c.) Displays information on the current operations (queries, updates, etc.) that are being executed on the server. Useful for identifying long-running or blocking operations.
db.currentOp()d.) Provides statistics about a specific collection, including the number of documents, index sizes, and storage usage.
db.collection.stats()e.) Checks the validity of a collection's data and metadata, reporting any errors found.
db.collection.validate()f.) Returns the total size of all indexes in a collection.
db.collection.totalIndexSize()g.) Returns the total size of the data stored in a collection.
db.collection.dataSize()h.) Provides information on the query execution plan, including the number of scanned documents, index usage, and execution time.
db.collection.find() with .explain()i.) Similar to find().explain(), but for aggregation pipelines.
db.collection.aggregate() with .explain()j.) Enables and configures the database profiler to collect data on query performance. Useful for identifying slow queries.
db.getProfilingStatus() and db.setProfilingLevel(level, slowMs)Other Popular Monitoring Tools
Several third-party tools are available to monitor MongoDB, providing more comprehensive features and visualizations compared to the built-in commands.
Here are some popular tools for monitoring MongoDB:
1. MongoDB Cloud Manager
MongoDB Cloud Manager provides a holistic view of the database environment with real-time monitoring. The platform automates the backup process, offering continuous backups with point-in-time recovery options. Automated provisioning and scaling for MongoDB deployments. Role-based access control (RBAC) and integration with MongoDB Atlas for enhanced security. The platform goes beyond monitoring by providing insights into query performance and offering optimization recommendations.
Pros:
- Intuitive dashboard and user interface for ease of use.
- Implements security best practices with RBAC and MongoDB Atlas integration.
- Simplifies routine tasks through automation, reducing manual intervention.
Cons:
- Pricing may be a consideration, particularly for smaller projects or startups.
- Some users may experience a learning curve, especially those new to MongoDB or cloud-based management platforms.

2. Prometheus + Grafana
Prometheus is an open-source monitoring solution tailored for cloud-native environments.
It allows for flexibility, customization, and extensibility through community contributions.
Grafana complements Prometheus with visually appealing and customizable dashboards and provides a user-friendly interface for creating and exploring visual representations of metrics.
Designed with scalability in mind, Prometheus and Grafana make it suitable for large-scale deployments. Efficient storage and retrieval mechanisms enable handling high volumes of time-series data.
Pros:
- Well-suited for monitoring large, distributed systems.
- Highly customizable dashboards and alerting configurations.
- Large community support and a wide range of integrations.
Cons:
- Initial setup and configuration may be complex, particularly for beginners.
- Prometheus may not retain extensive historical data by default.
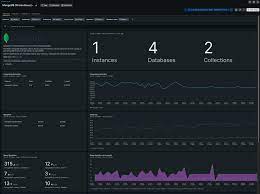
3. New Relic APM
NewRelic APM offers insights into application performance, tracing transactions, and detecting errors. It helps identify performance bottlenecks within the application code. NewRelic monitors server health, system metrics, and database instances, including MongoDB, and provides a holistic view of the entire application stack.
NewRelic features configurable alerts based on predefined thresholds for timely issue resolution and notifies teams through various channels, including email and messaging.
Pros:
- Intuitive interface with straightforward setup.
- In-depth application performance monitoring.
- Supports various programming languages and frameworks.
Cons:
- Pricing may be relatively higher for some organizations.
- Advanced customization options may be limited compared to open-source alternatives.
4. Datadog
Offers real-time metrics and analytics for MongoDB and a variety of services. It provides detailed insights into resource utilization, query performance, and application health. Datadog monitors infrastructure changes to understand the impact on application performance and integrates with CI/CD pipelines for continuous monitoring in DevOps workflows.
Supports collaboration through shared dashboards and annotations.
Pros:
- Offers a broad set of monitoring tools for various aspects of infrastructure and applications.
- Supports a wide range of integrations with third-party services.
- Features collaboration and sharing capabilities.
Cons:
- Pricing may be a factor for smaller budgets.
- Some users may find the interface complex initially.
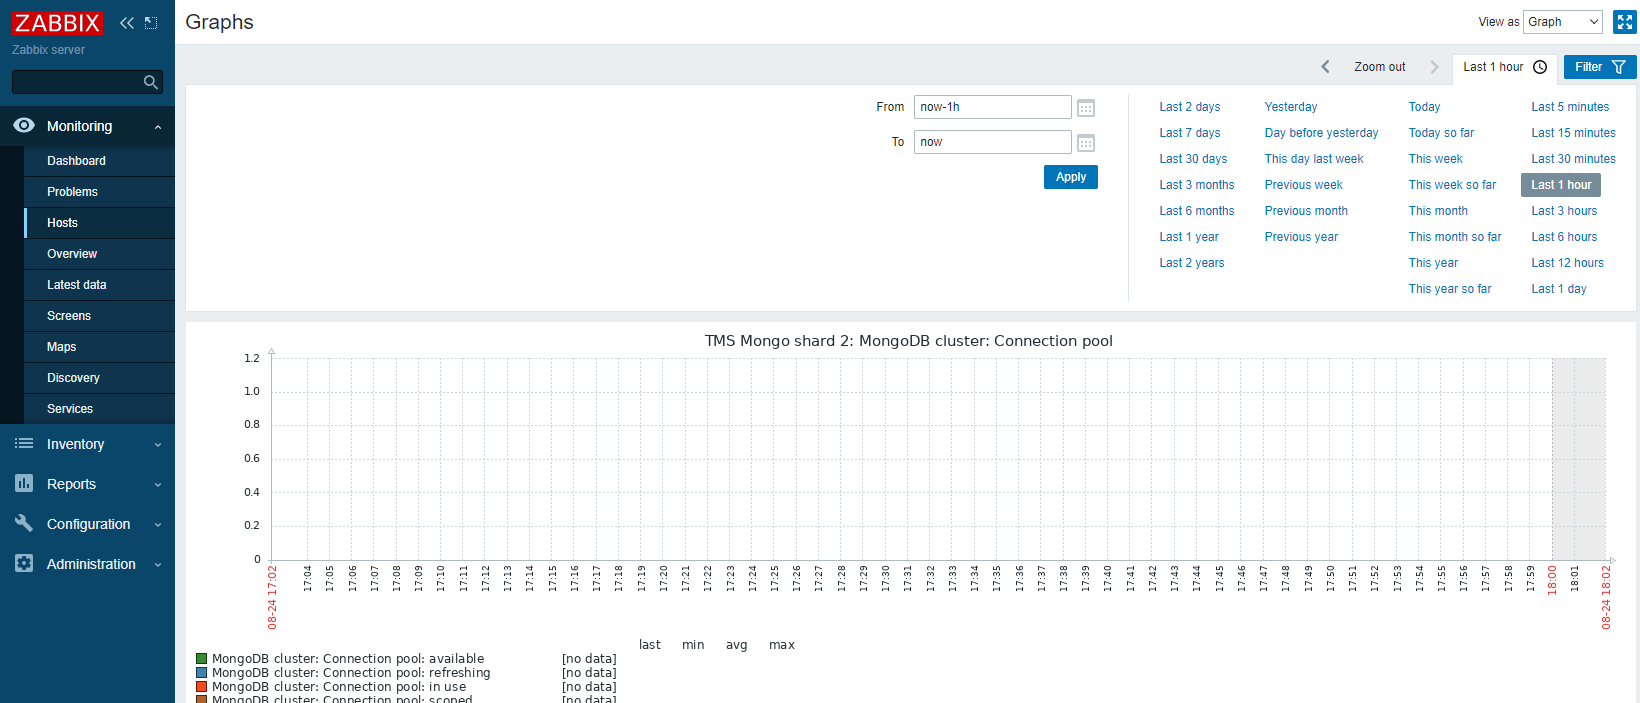
5. Zabbix
Zabbix is an open-source solution with an active community and extensive documentation.
Allows for customization, extension, and integration with other tools and provides customizable dashboards for visualizing key metrics. It supports the creation of personalized views tailored to specific monitoring needs and generates reports and trend analysis to aid in performance evaluation and capacity planning. Zabbix boasts of configurable alerting mechanisms with support for multiple notification channels.
Pros:
- Zabbix is an open-source monitoring solution.
- Can monitor a wide range of devices and applications.
- Detects and alerts on issues before they escalate.
Cons:
- The initial setup may be complex for some users.
- The user interface may not be as modern or intuitive as some other solutions.
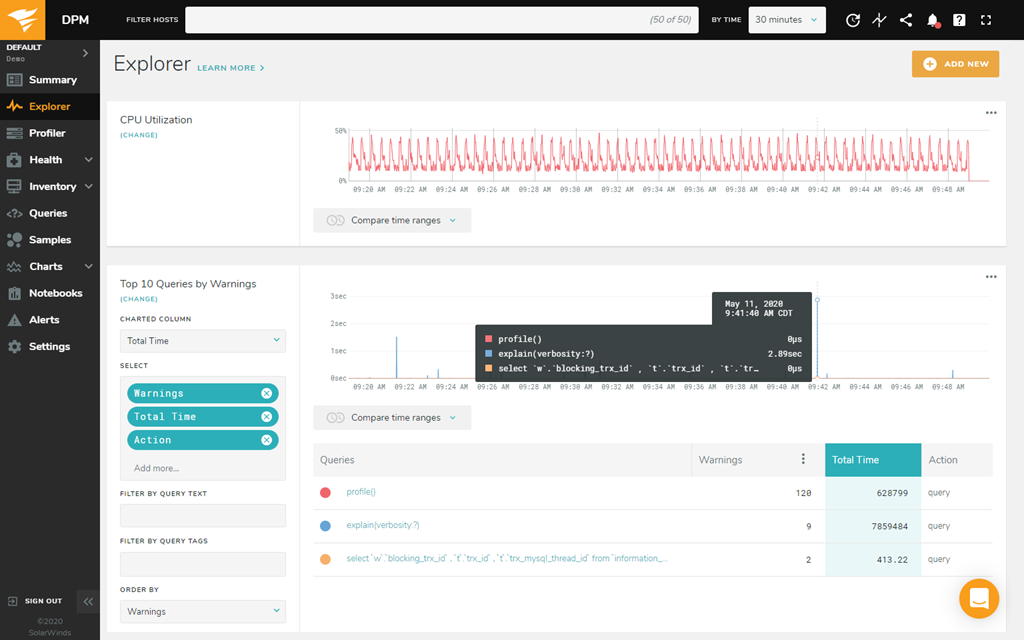
6. Solarwinds DPM
SolarWinds DPM is a comprehensive database monitoring solution that provides insights into the performance and health of various databases, including MongoDB. Solarwinds DPM provides real-time monitoring of database metrics. Customizable dashboards identify and troubleshoot slow-performing queries. Configurable alerts for performance deviations and potential issues. It also monitors databases in various environments.
Pros:
- Supports multiple database platforms.
- User-friendly interface.
- Cloud-ready for monitoring databases in the cloud.
Cons:
- Cost may be a consideration for smaller organizations.
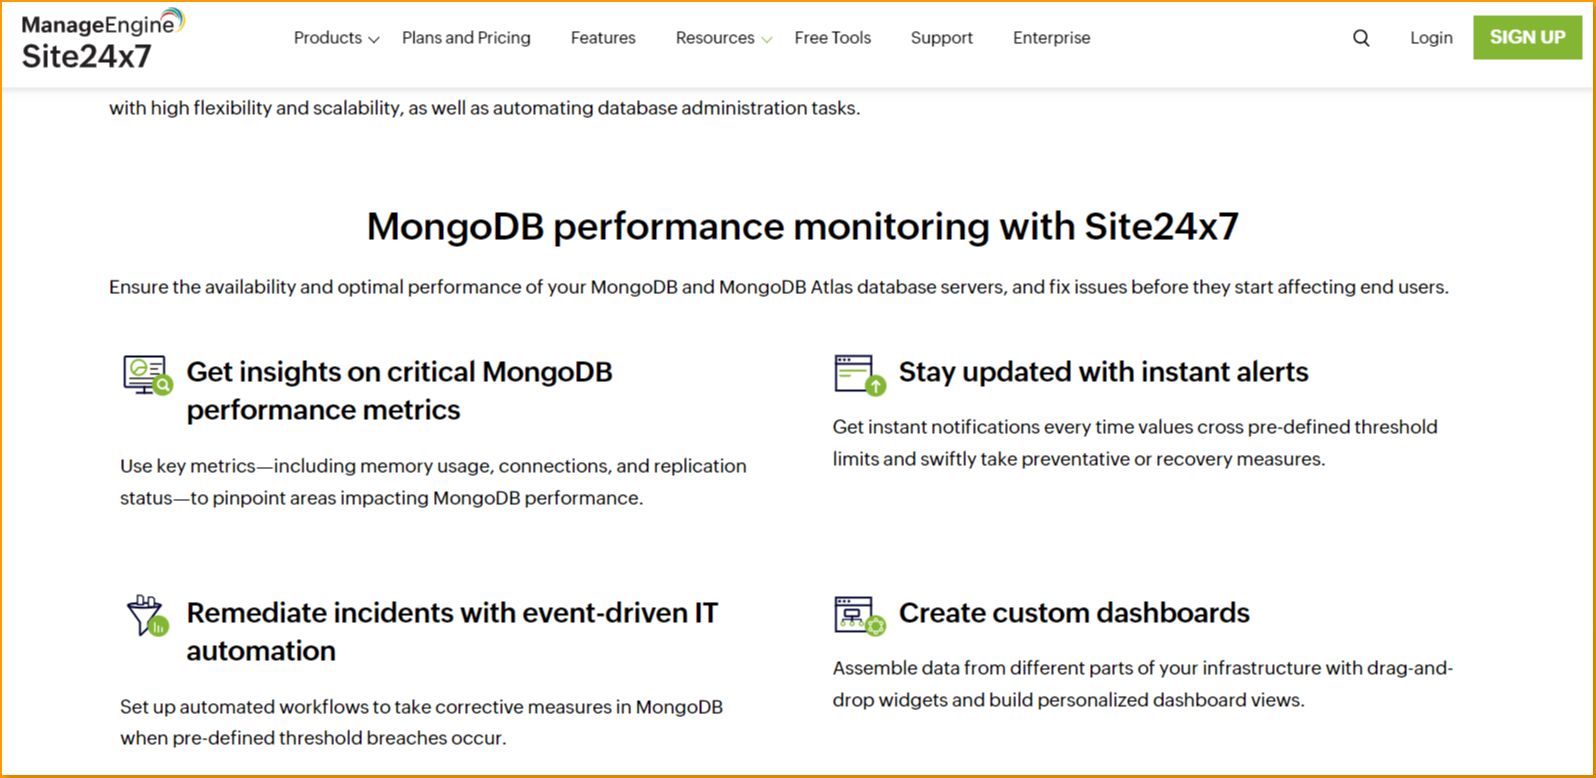
7. Site 24x7
Site24x7 is a cloud-based monitoring solution that offers a range of monitoring services, including infrastructure, applications, and databases like MongoDB. It boasts of real-time monitoring with customizable dashboards, End-user experience monitoring, and Automatic discovery and mapping of MongoDB resources.
Pros:
- Agent-based and agentless monitoring options.
- Scalable for small to large deployments.
- SaaS-based with minimal setup required.
Cons:
- Advanced features may require higher-tier plans.
8. MongoDB Atlas
MongoDB Atlas is the official cloud database service for MongoDB, providing a fully managed, scalable, and secure database solution. MongoDB Atlas provides automated backups and point-in-time recovery, Monitoring and visualization of cluster metrics, and automated scaling for clusters. Security features include VPC Peering and IP Whitelisting.
Pros:
- Fully managed MongoDB service.
- Integrated monitoring and management tools.
- Seamless scalability and automated backups.
Cons:
- Limited customization compared to self-hosted deployments.
9. Nagios XI
Nagios XI is an enterprise-grade monitoring solution that offers comprehensive monitoring capabilities for servers, applications, and databases. Nagios is flexible and extensible through plugins. It provides customizable dashboards and reports. It has an active user community for support.
Pros:
- Active user community with a wide range of plugins.
- Highly customizable and scalable.
- Centralized monitoring for various services.
Cons:
- Setup and configuration may be complex for beginners.
10. Opsview
Opsview is an open-source-based, scalable IT monitoring solution designed to monitor networks, applications, and databases. Provides unified monitoring for diverse IT environments along with centralized visualization of infrastructure and application performance.
Extensible through Opspacks (plugins).
Pros:
- Supports both open-source and enterprise versions.
- Flexible and extensible monitoring platform.
- Role-based access control.
Cons:
- Some advanced features are available in the enterprise version.
Conclusion
Monitoring MongoDB is essential for ensuring the smooth and efficient operation of database systems. By actively monitoring MongoDB, administrators and developers gain real-time insights into the performance, health, and security of the database environment.
MongoDB monitoring provides visibility into crucial metrics such as server resource utilization, query performance, and replication status, empowering stakeholders to optimize configurations, allocate resources effectively, and make informed decisions based on the evolving needs of the application.
Ultimately, the practice of monitoring is integral to maintaining a resilient, scalable, and responsive database infrastructure that meets the demands of modern, data-intensive applications.
Database Monitoring: Monitor MongoDB with Atatus
Atatus provides you an in-depth perspective of your database performance by uncovering slow database queries that occur within your requests, and transaction traces to give you actionable insights. With normalized queries, you can see a list of all slow SQL calls to see which tables and operations have the most impact, know exactly which function was used and when it was performed, and see if your modifications improve performance over time.
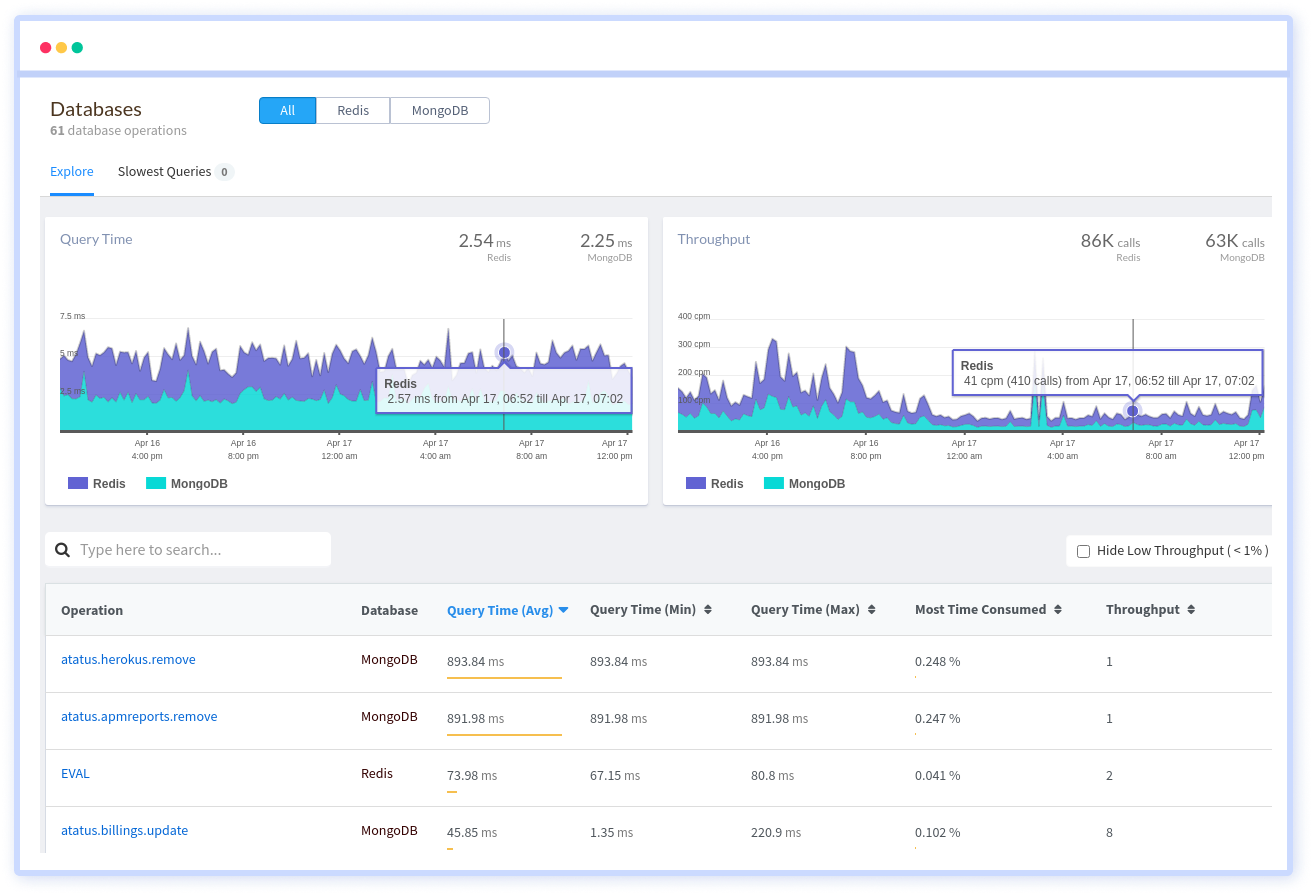
Atatus benefit your business, providing a comprehensive view of your application, including how it works, where performance bottlenecks exist, which users are most impacted, and which errors break your code for your frontend, backend, and infrastructure.
#1 Solution for Logs, Traces & Metrics
![]() APM
APM
![]() Kubernetes
Kubernetes
![]() Logs
Logs
![]() Synthetics
Synthetics
![]() RUM
RUM
![]() Serverless
Serverless
![]() Security
Security
![]() More
More


![New Relic vs Splunk - In-depth Comparison [2026]](/blog/content/images/size/w960/2024/10/Datadog-vs-sentry--19-.png)
![New Relic vs Sentry - Which Monitoring Tool to Choose? [2026]](/blog/content/images/size/w960/2024/10/VS--1-.png)