8 Best Network Monitoring Tools to Try in 2025
Network monitoring tools are an important part of any network management strategy since it gives you valuable information about network-related issues that could damage your business. Overloaded networks, router difficulties, downtime, cybercrime, and data loss are all dangers that can be mitigated by frequently monitoring networks.
These network monitoring software tools will amaze you with features like detecting devices, monitoring network equipment, servers, and applications, recognizing network patterns, visually presenting monitoring results, and even backing up switch configurations and routers.
Network monitoring is something that every business should undertake. However, with so many different network monitoring software and tools to choose from, it can be difficult to find the best one for your needs and budget.
Below is a list of the most recent tools and software to ensure that your network is continuously tracked and monitored at all hours of the day to achieve the highest possible up-times. The majority of them offer free downloads or trials to get you started for 14 to 30 days so you can make sure it fulfills your needs.
- SolarWinds
- Paessler PRTG Network Monitor
- Nagios XI
- Datadog
- Icinga
- Zabbix
- Auvik
- Progress WhatsUp Gold
#1 SolarWinds
SolarWinds Network Performance Monitor is one of the best network performance monitoring tools that uses SNMP to track the status of devices. It can detect network devices that are linked to your network automatically. Use the dashboard to keep track of the availability and performance of all connected network devices in one place.
It's simple to put up and ready in no time. The utility detects network devices automatically and deploys them within an hour. Its simple approach to network management makes it one of the most user-friendly and intuitive user interfaces available.
The product is very adaptable, and the user interface is simple to manage and update. The web-based performance dashboards, charts, and views can all be customized. For your whole network infrastructure, you can create a custom topology. You can also develop personalized dependency-aware intelligent warnings, among other things.
Any newly detected devices, applications, or services can be viewed on a network topology map, which shows how your infrastructure is connected. The NetPath function allows you to trace packet transfers hop by hop, which can help in more efficiently diagnosing the source of performance network issues.
You can specify trigger conditions for alerts using the custom alerts system. When the trigger criteria are met, the software will send you an email or SMS message to inform you that an event has occurred. On the All Active Alerts page, the visitor can see a full list of alerts organized by severity.
Pricing: A 30-day free trial is offered. On request, an interactive demo will be provided. The starting price is $2995. For further information on the price, you can request a quote.
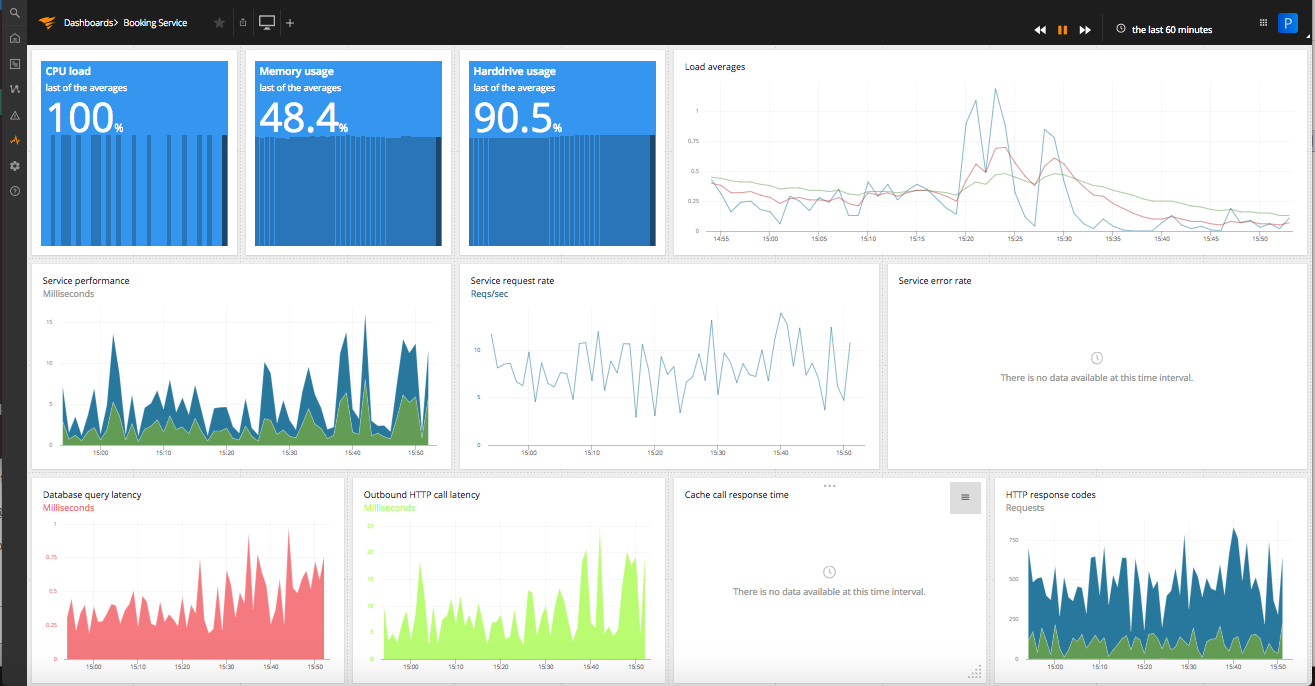
#2 Paessler PRTG Network Monitor
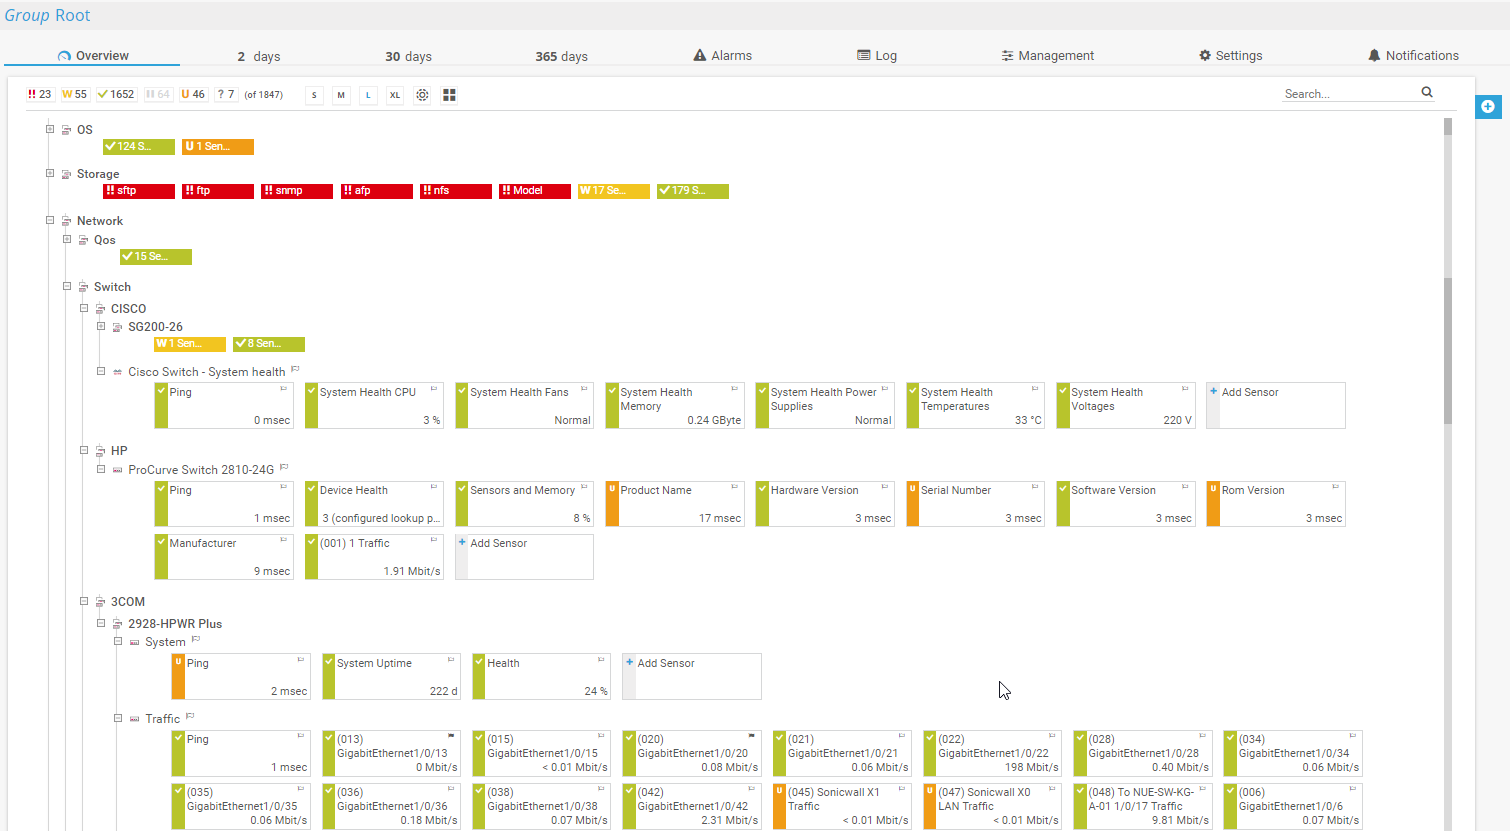
PRTG Network Monitor from Paessler is one of the free network monitoring tools that monitors your network using SNMP, packet sniffing, and WMI. Scan network segments for devices to monitor and add them to the list.
It's one of the greatest options for companies who are new to network management software. The user interface is extremely powerful and simple to operate.
To monitor various areas of your network, you can choose from a variety of sensors. Bandwidth Monitoring Sensors, Hardware Parameters Sensors, network data use meters, SNMP sensors, VOIP and QoS sensors, and other sensors all monitor a certain value in your network.
All of your network's devices, systems, traffic, and applications may be viewed in a hierarchical view that highlights performance and warnings. PRTG uses SNMP, WMI, SSH, Flows/Packet Sniffing, HTTP requests, REST APIs, Pings, SQL, and other technologies to monitor the complete IT infrastructure.
PRTG's ability to monitor devices in the data center via a mobile application is a unique capability. The sensor is identified by a QR code that is printed and affixed to the physical device.
Pricing: The price is determined by the number of licenses purchased. Up to 100 sensors are free.
#3 Nagios XI
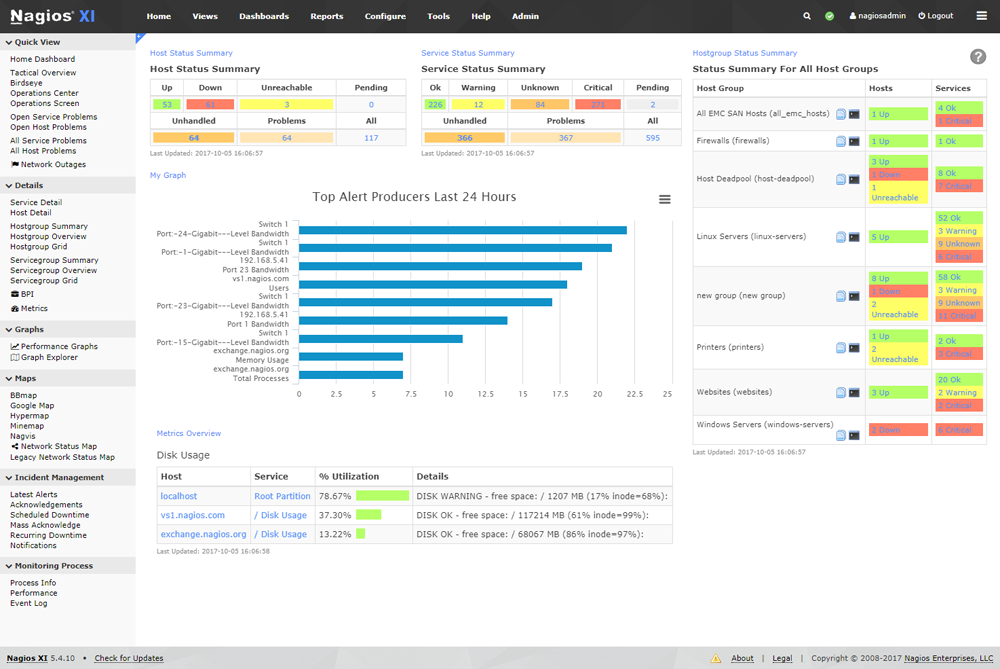
Nagios XI is one of the powerful network monitoring tools that has been in development for a long time. Nagios Core is open-source and free software, while Nagios XI is a proprietary interface that runs on Nagios Core. Nagios XI is a network monitoring software that does practically everything a system or network administrator may want.
The web interface is quick and easy to use, and the server is dependable. Its somewhat complex configuration can be difficult for newcomers to grasp, but it also has the benefit of allowing the tool to be tailored to practically any monitoring task.
Since Nagios Core is supported by a large and active community, there are numerous plug-ins for a wide range of hardware and software. Servers, services, network channels, and anything else with an IP address can be continuously monitored. Without notifications, no server or network monitoring system would be complete.
The Nagios software platform includes a customized method for e-mail, SMS, and instant messaging via the most common internet messengers, as well as an escalation structure for making rational decisions about who should be notified when and under what conditions.
Furthermore, the display function displays all monitored devices in a logical representation of their network layout, with color-coding that indicates issues as they develop.
Pricing: For 100 nodes, the standard paid edition costs $1,995.
#4 Datadog
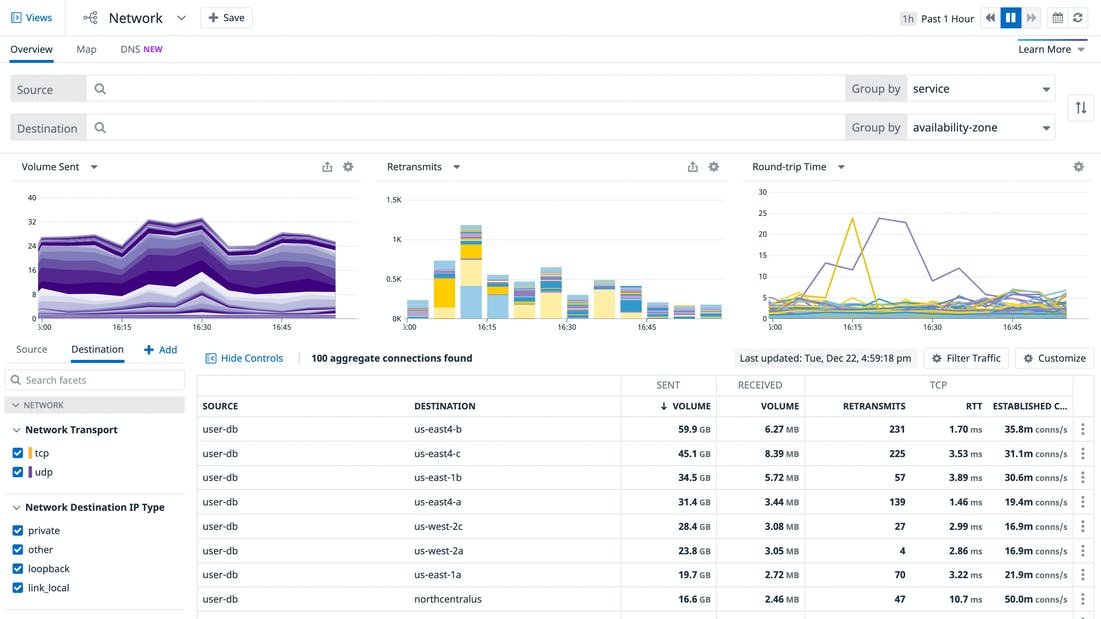
Datadog Network Performance Monitoring is a cloud-based infrastructure monitoring solution that looks at network traffic flows. A Network Device Monitoring service complements it, focusing on the state of each network device, such as switches, routers, and appliances.
The Network Performance Monitor may combine network monitoring efforts for several websites as well as cloud services. The service provides a processor to execute the monitoring software and storage space for acquired statistics as part of the SaaS package. This network monitoring system includes packet capture and analysis tools in addition to live status updates.
The Datadog Network Performance Monitoring service starts by scanning your network and identifying all of the devices. This autodiscovery service does all of the monitoring system configurations for you. The device inventory created by the network discovery process serves as an index for the entire monitoring service.
The Datadog dashboard may provide an overview of all network activity once all devices and linkages have been detected. The service also creates a network topology map, which can be used to gain a rapid overview of each node or link. The map is interactive, allowing you to access device data and performance information. Information about Internet connections to other websites and cloud resources is also included.
Datadog's network research services are recursive, so any changes you make to your network are automatically detected. This automatically updates the network inventory and topology map without the need for human interaction.
Pricing: For Network Performance, Infrastructure, Log Management, and other services, Datadog offers a variety of pricing options. The cost of Network Performance starts at $5 per month per host. This design includes tools for analyzing network traffic patterns and searching using tags. They provide a 14-day free trial of their product.
#5 Icinga
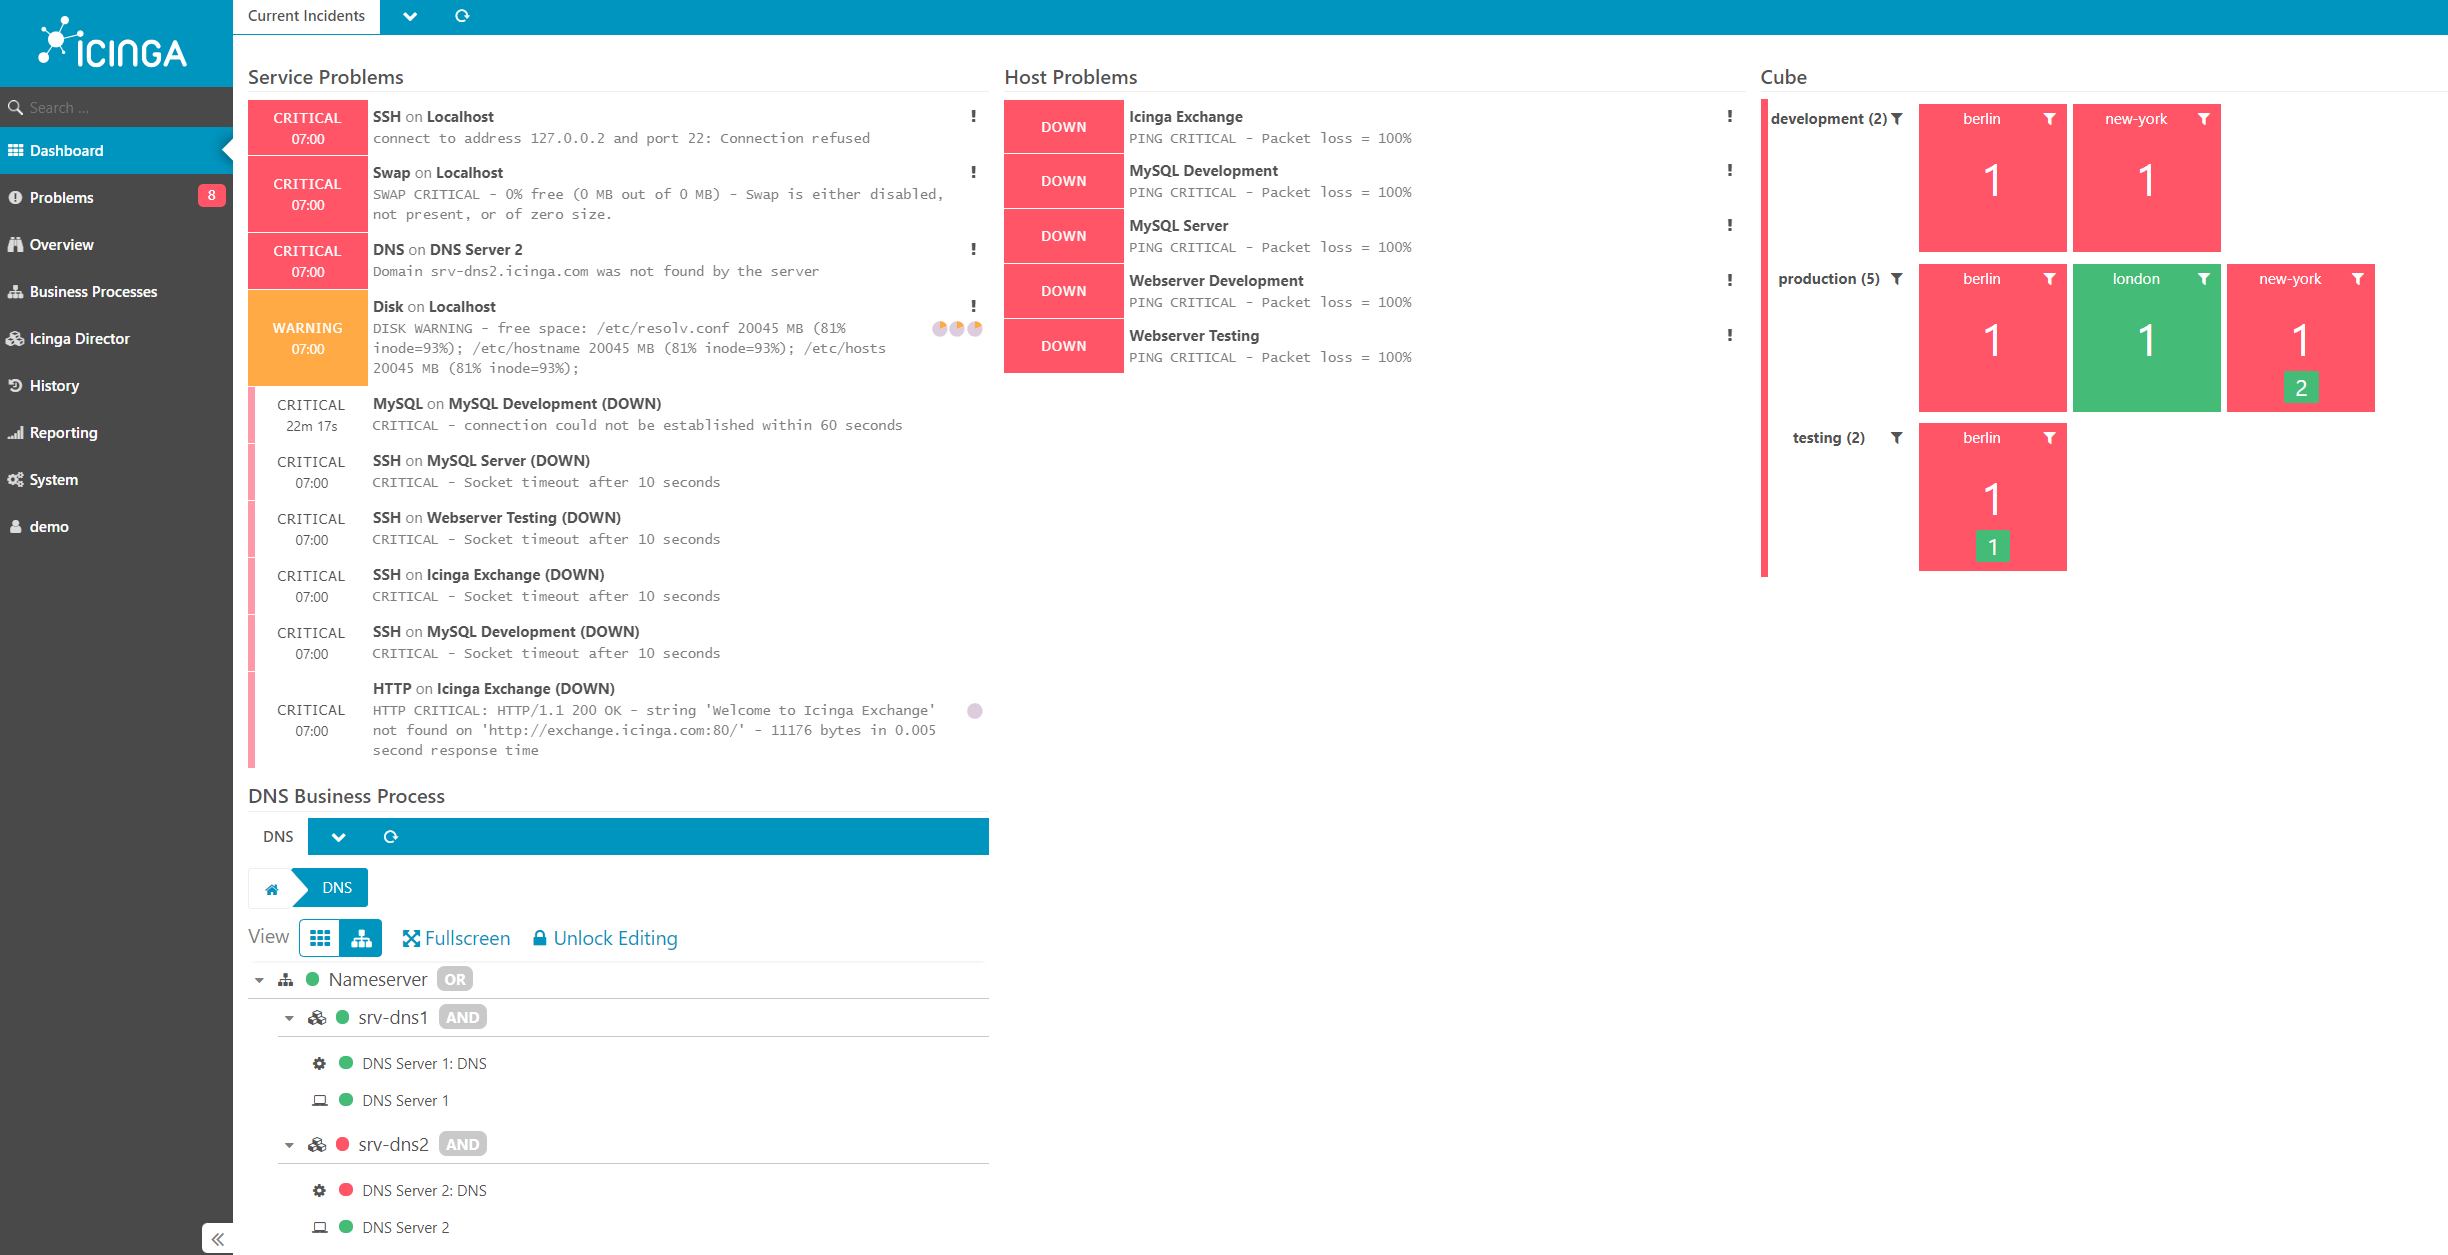
Icinga is another best open-source network monitoring system that keeps track of your network, cloud services, and data center performance. The software is web-based and may be adjusted using the graphical user interface (GUI) or the Domain Specific Language (DSL). Having the option to choose between the two offers you the freedom to monitor as you see fit.
You may obtain an overview of performance management by logging in to the GUI and using the dashboard. The dashboard shows if there are any performance or availability issues and color-codes them according to their severity. The network devices that are critical or down are highlighted in red.
Although this platform is a valuable addition to your tech stack, it lacks some of the functionality of more complete network monitoring tools like Graphite and Prometheus. Nonetheless, its functionality and usability make it an excellent alternative for small businesses or beginners.
It's a user-friendly and adaptable tool for SMB and enterprise networks. The software is mostly used to monitor infrastructure and services. In addition, the tool has excellent threshold analysis and report/alert capabilities.
Icinga is known for producing high-quality analytics and reports on the overall health of your IT infrastructure. All alert requirements can be seen on the dashboard and issued through email, SMS, or mobile messaging.
Pricing: It is open-source and free software.
#6 Zabbix
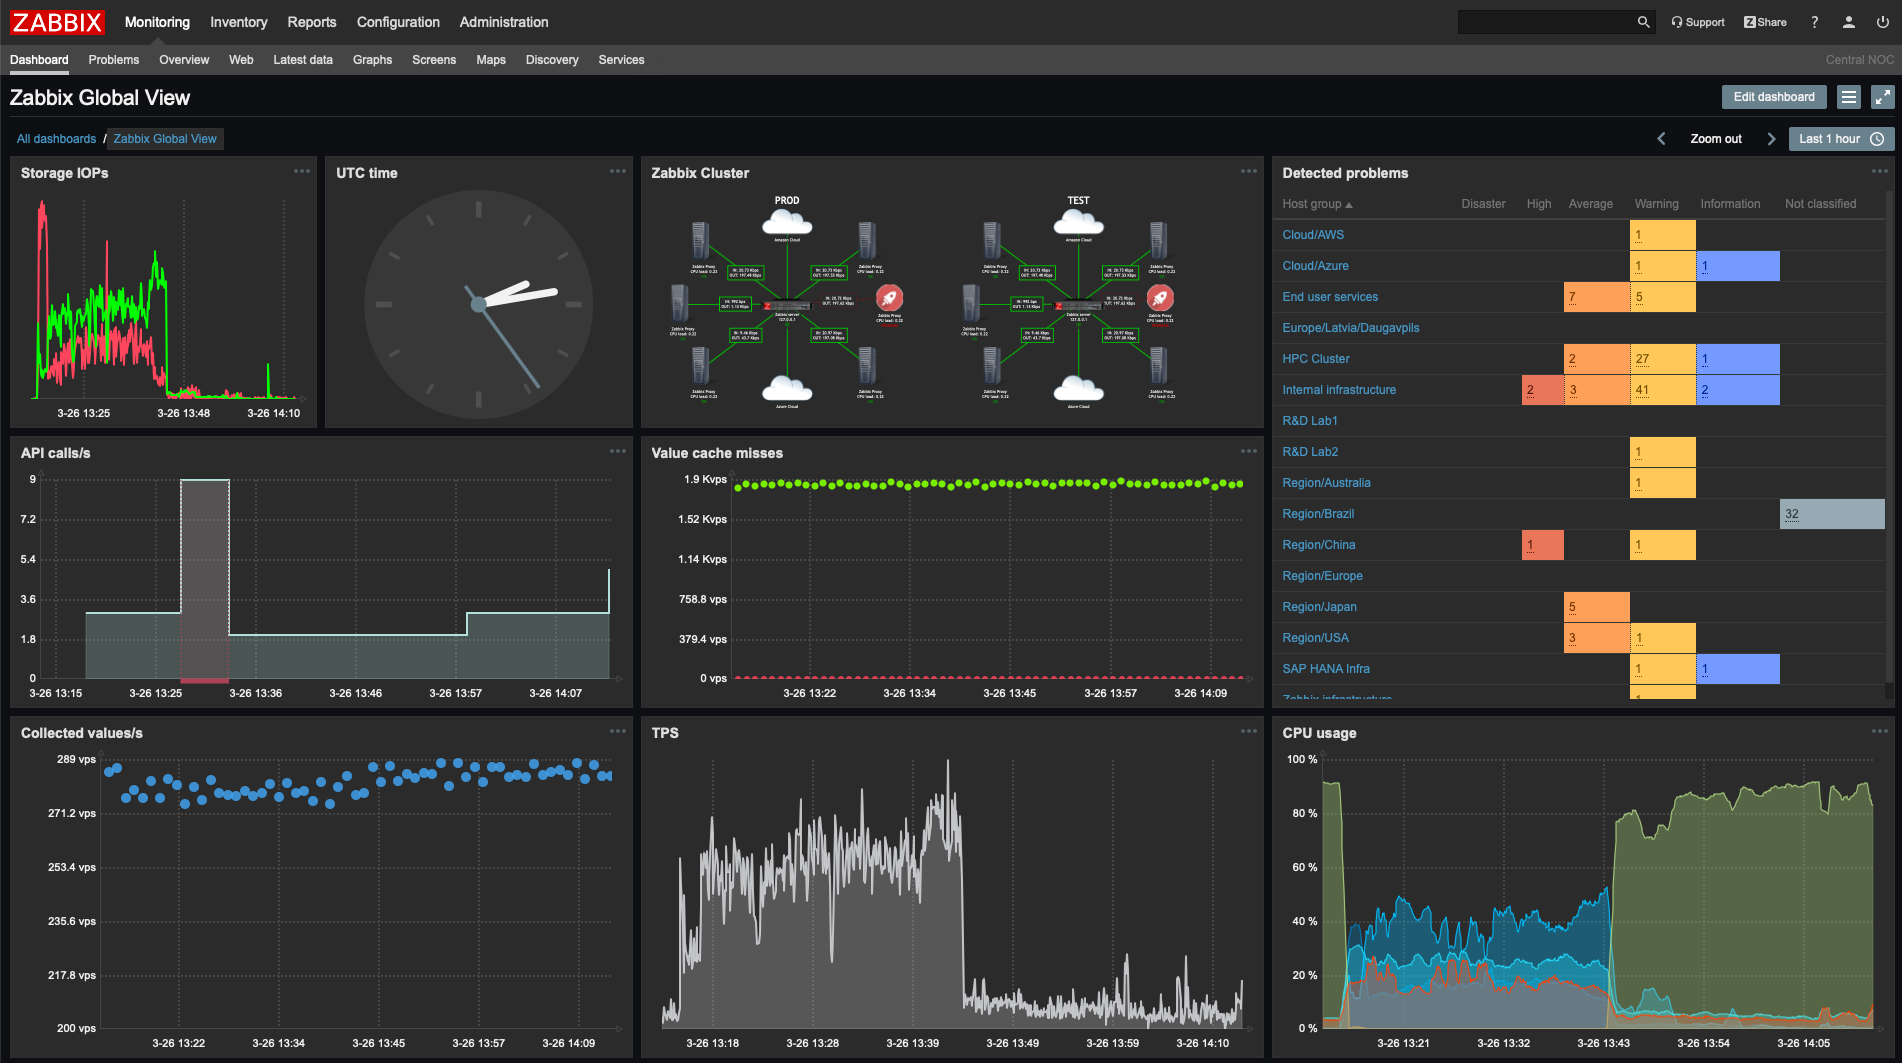
Zabbix is a free open-source network monitoring system that integrates network, server, cloud, application, and service monitoring into a single platform. Zabbix monitors your network using SNMP and IPMP.
The autodiscovery feature locates network devices and adds them to the monitoring list automatically. The tool can also automatically detect configuration changes, allowing you to determine whether or not a network device has been updated.
Zabbix features a notification system to ensure that you can respond to alarms quickly. To keep you up to date on changing network security events, alerts are sent by email, SMS, messenger, jabber, or custom scripts. To ensure that the point of contact has all they need to react intelligently, the notification content can be tailored according to the receiver.
Zabbix works with VMware, Hyper-V, and other virtualization hypervisors, delivering precise information on the hypervisor's performance, availability, and activity. It can monitor Java application servers, web services, and databases in particular.
Zabbix is mostly used for monitoring and trending. This software is commonly used to keep track of servers and network infrastructure. One of Zabbix's best features is its ability to predict traffic trends. Based on prior data, Zabbix can predict future behavior.
You can set up network monitoring and get fast alerts if there are any issues, such as network overuse or underuse. This automation eliminates the need to manually check networks, freeing up resources and team members.
Pricing: It is open-source and free software.
#7 Auvik
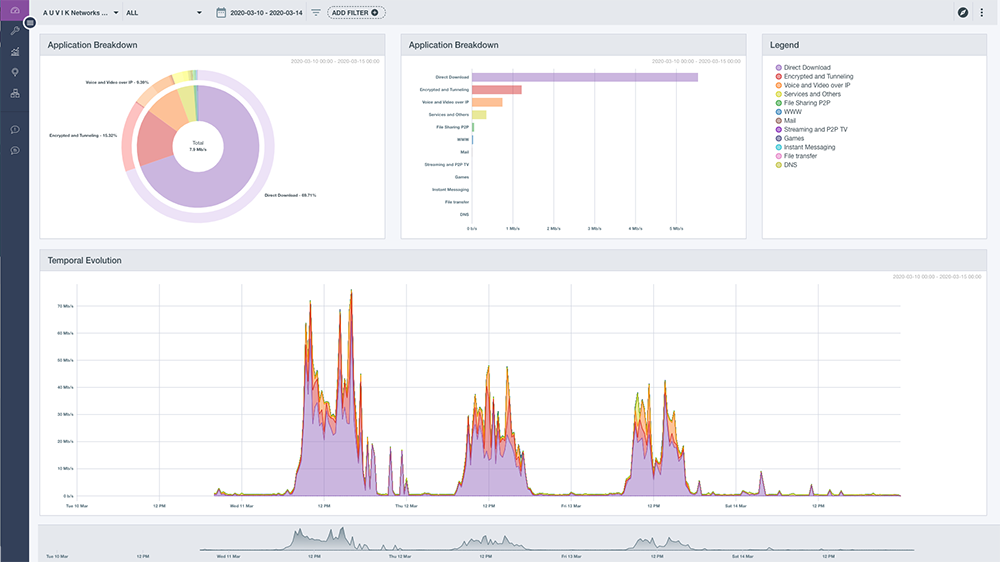
Auvik is a cloud-based network monitoring system with a variety of system management features. The software is accessed via a Web browser, and the setup process installs collectors on your system when you create an account. The Auvik package can monitor and control several websites from a single location. As a result, the package is perfect for WAN monitoring.
The Auvik service begins with a network discovery procedure. This populates all of the necessary base information for the monitor to function. Since the discovery service is always running, it will detect any new devices that are introduced to the network.
Once the monitoring service is up and running, the system will generate an alert if any of the thresholds are exceeded. This method allows technicians to focus on other duties, safe in the knowledge that the thresholds will allow them to address system performance issues before they become evident to users.
Configuration management is one of the network management tools included in the Auvik package, and it is used to standardize network device settings and prevent unauthorized changes.
The cloud servers that power Auvik supply the computing power. The method, however, requires the installation of collectors at each monitored location. Windows Server and Ubuntu Linux are both supported by this software.
Pricing: Auvik's Network management and monitoring solution are completely free to use. It provides a free trial period. Auvik uses a quote-based pricing strategy. It has two pricing tiers for the solution: Essentials and Performance. The pricing starts at $150 a month.
#8 Progress WhatsUp Gold
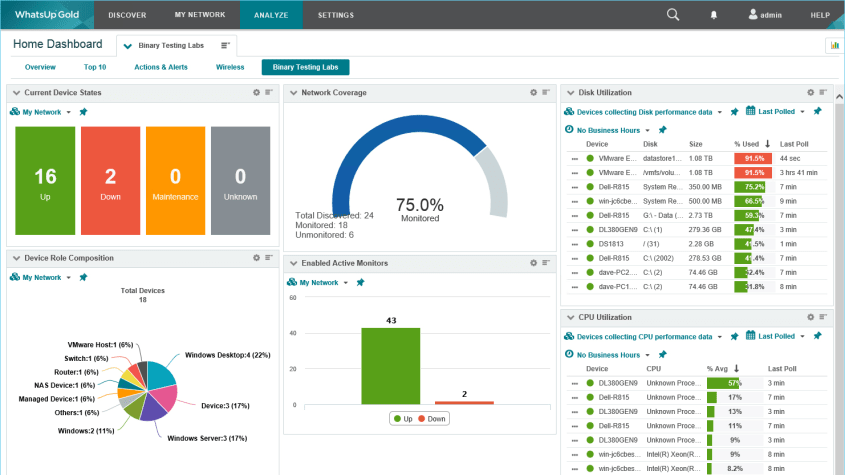
WhatsUp Gold from Progress Software Corporation is a network performance system that checks network device health using the Simple Network Management Protocol (SNMP). This software's flexible pricing scheme allows you to tack on additional services such as configuration management, log management, application monitoring, and traffic analysis.
An autodiscovery module is included in the WhatsUp Gold system. At launch, this populates the monitoring device inventory, and it then polls for any changes in network resources. If any devices are added, moved, or removed, the system will immediately update the network inventory.
WhatsUp Gold's network monitoring capabilities include LANs, wireless networks, and Internet connections to remote sites or cloud resources. WhatsUp Gold also features a network topology mapper that creates network maps automatically using device inventory data. When the device inventory changes, these topology maps adapt automatically.
This monitoring tool sends out broadcasts on a regular basis, requesting status reports known as MIBs. WhatsUp Gold compiles the results it receives once each device agent answers the request. This method informs the monitoring system about all of the gadgets that are out there, as well as the other devices to which they are connected.
If a device agent detects a problem with the equipment it is monitoring, it will send a Trap message. This is translated into an alert by WhatsUp Gold. The monitoring console can be ignored by network administrators, who can instead rely on WhatsUp Gold to keep an eye on everything.
Pricing: Raise a quote to know the pricing. A free trial and demo are also provided to explore the product.
Wrap Up!!!
Many IT departments combine the duties of server, application, storage, and network management. All of these aspects of a company's infrastructure can be covered by bundled software packages that include monitoring tools. A network monitoring tool might be as simple as a command-line application or as complex as a whole suite of services.
Many different specialty functions are involved in networking technology. At the most basic level, you should be aware of the physical features of your network, such as the cable or optic fiber that transports LAN data or the transmitters that generate radio waves in wireless networks.
Monitor Your Entire Application with Atatus
Atatus Observability Platform lets you review problems as if they happened in your application. Instead of guessing why errors happen or asking users for screenshots and log dumps, Atatus lets you replay the session to quickly understand what went wrong.
We offer Application Performance Monitoring, Real User Monitoring, Serverless Monitoring, Logs Monitoring, Synthetic Monitoring, Uptime Monitoring, and API Analytics. It works perfectly with any application, regardless of framework, and has plugins.
Atatus can be beneficial to your business, which provides a comprehensive view of your application, including how it works, where performance bottlenecks exist, which users are most impacted, and which errors break your code for your frontend, backend, and infrastructure.
If you are not yet an Atatus customer, you can sign up for a 14-day free trial.
#1 Solution for Logs, Traces & Metrics
![]() APM
APM
![]() Kubernetes
Kubernetes
![]() Logs
Logs
![]() Synthetics
Synthetics
![]() RUM
RUM
![]() Serverless
Serverless
![]() Security
Security
![]() More
More


![New Relic vs Splunk - In-depth Comparison [2026]](/blog/content/images/size/w960/2024/10/Datadog-vs-sentry--19-.png)
![New Relic vs Sentry - Which Monitoring Tool to Choose? [2026]](/blog/content/images/size/w960/2024/10/VS--1-.png)