Metrics are used by the most successful companies to track and understand the performance of their applications and infrastructure. As a result, telemetry data and time-series databases (TSDB) have become increasingly popular in recent years. One of the most prominent TSDBs today is the Prometheus monitoring tool.
We now have the following:
- What is Prometheus?
- What is Prometheus Monitoring and How does it Work?
- Prometheus Components and Architecture
- What can You Monitor with Prometheus?
What is Prometheus?
Prometheus is an open-source tool that provides monitoring and alerting for cloud-native systems, such as Kubernetes. It can collect and store measurements as time-series data, including a timestamp for each entry. Labels, which are optional key-value pairs, can also be collected and recorded.
SoundCloud was the first to create Prometheus in 2012. Prometheus has grown in popularity since its start, due to the contributions of a diverse community of contributors. Prometheus joined the Cloud Native Computing Foundation (CNCF) in 2016 and is currently a CNCF-certified project.
The following are some of Prometheus' key features:
- Multidimensional Data Model
Using time-series data with metric names and key-value pairs as identifiers. - PromQL
A querying language with a multi-dimensional data model can be used. - Pull Model
By actively "grabbing" data through HTTP, Prometheus may collect time-series data. - No Reliance on Distributed Storage
All single server nodes are self-contained. - Pushing Time-series Data
Through the usage of an intermediary gateway, this service is available. - Monitoring Target Discovery
Static configuration or service discovery are both options. - Visualization
Prometheus has a variety of graphs and dashboards to choose from.**
What is Prometheus Monitoring and How does it Work?
Prometheus requires an exposed HTTP endpoint to obtain metrics. Prometheus can begin scraping numerical data, capturing it as a time series, and storing it in a local database designed for time-series data as an endpoint is ready. Remote storage repositories can also be coupled with Prometheus.
Prometheus was created to help software developers and administrators manage production computer systems, such as the applications, tools, databases, and networks that support popular websites.
Users can construct temporary time series from the source using queries. Metric names and labels are used to define this series. Queries are made in PromQL, a one-of-a-kind programming language that enables users to select and aggregate time-series data in real-time. PromQL can also be used to create alert conditions that will send messages to external systems such as email, PagerDuty, or Slack.
In its web-based user interface, Prometheus can present collected data in tabular or graph form. APIs can also be used to connect to third-party visualization tools like Grafana.
Prometheus Components and Architecture
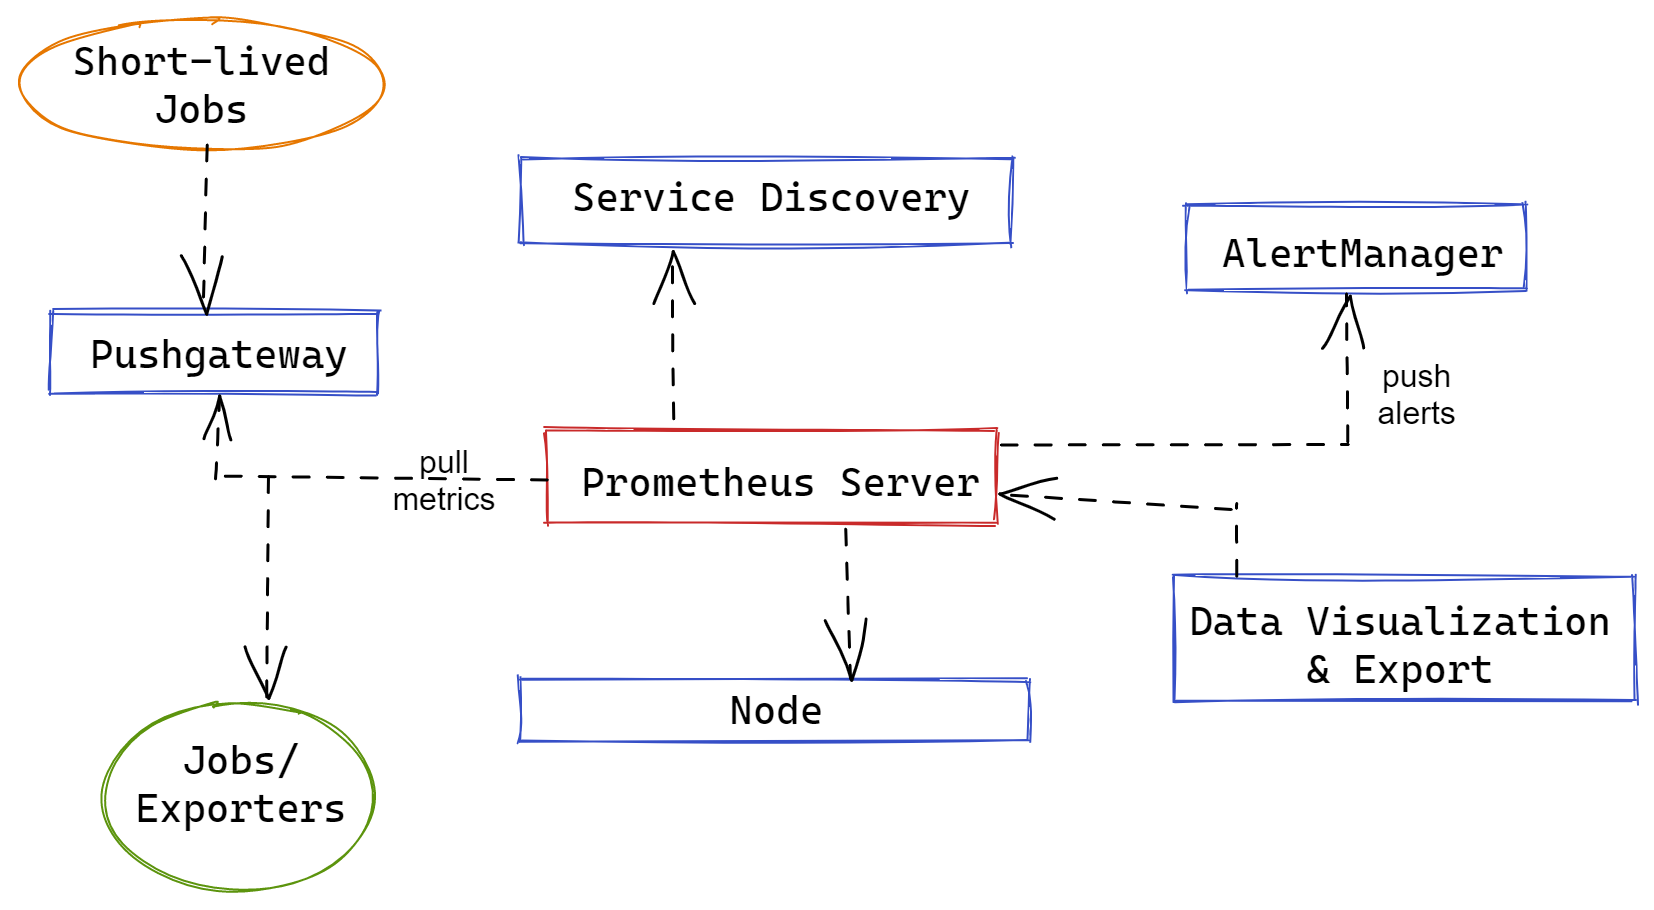
Prometheus is made up of several components that work together to track and report on the health, behavior, and performance of the system. Scraping metrics from instrumented applications and services, which offer metrics in a plaintext format via HTTP endpoints, is the primary technique of data collection.
The Prometheus architecture makes it easier to find and scrape sources that create the data you need. A third-party application or a company's instrumented applications could be the target. The scraped data is saved in Prometheus and can be analyzed using the Prometheus Query Language (PromQL).
Let's take a closer look at Prometheus' core components to have a better understanding of how it operates.
Prometheus Server
The scraping and storing of metrics are handled by the Prometheus server. The server is in charge of monitoring job scheduling, which entails querying data sources (known as "instances") at a predetermined polling frequency. Monitoring jobs are set up using one or more "scrape config" directives, which are handled via a YAML configuration file that may be live-reloaded using a SIGHUP or the Management API.
To find scrape targets, Prometheus relies extensively on several service discovery (SD) techniques. These integrations range from generic APIs to file-based service discovery, which bespoke SD implementations can use to manage a JSON or YAML file containing a list of targets.
Prometheus Exporters
Prometheus servers pull data from instrumented applications and Prometheus exporters, unlike other monitoring systems that rely on agents or embedded instrumentation to gather data and "push" metrics to the monitoring backend.
Client libraries that provide an HTTP endpoint where internal metrics are exposed and collected by Prometheus servers are used to instrument applications.
Libraries and servers that assist in the exporting of existing metrics from third-party systems as Prometheus metrics are exporters. When directly instrumenting a system with Prometheus is not practicable, exporters come in handy.
Exporters can be thought of as "single-purpose monitoring agents" that collect metrics from a specific third-party system and make them available for collection by Prometheus servers.
Prometheus Pushgateway
Although Prometheus is largely a pull-based monitoring system, it includes a "Pushgateway" component that allows metrics from other applications and services to be pushed in. The Pushgateway is useful for gathering metrics from systems that aren't compatible with the rest of the infrastructure, which is pull-based.
For example, ephemeral batch tasks that start and stop before Prometheus can identify and scrape metrics from them may start and stop before Prometheus can discover and scrape metrics from them. The Prometheus Pushgateway can be used to push the metrics of such processes, preventing important data from being pulled before it is lost.
Prometheus Client Libraries
After you apply instrumentation to an application's code, it generates metrics. One of the Prometheus client libraries can be used to accomplish this. The official client libraries for Prometheus are available in Java/JVM, Go, Python, and Ruby. Client libraries for Node.js, Haskell, C#/.Net, Common Lisp, Dart, Erlang, Rust, and more languages are also available.
Choose a Prometheus client library that is compatible with your application's language. You'll have problems defining and exposing internal metrics via HTTPs endpoints on your application if the library doesn't match the application language.
Prometheus Alertmanager
Client applications, such as the Prometheus server, send alerts to the Alertmanager. In practice, the Prometheus server sends out alerts when a user-defined alerting rule triggers an alert circumstance. Alertmanager instances handle deduplication, grouping, inhibition, silence, and routing of alerts to the relevant recipient once they've been configured.
Configuring Alertmanager is only half of the battle because Prometheus alerting is split into two parts (alerting rules and alert processing). The majority of the business logic in Prometheus's alerting system is dependent on alerting rules that are specified in Prometheus. Alerting rules are PromQL expressions that the Prometheus server evaluates at regular intervals.
Prometheus Web UI & Visualizations
The Prometheus web app offers a built-in function called an "expression browser," which allows users to directly enter any expression and see the output in a table or graph over time. However, Grafana or Prometheus Console templates are advised for actual graphs; this is advertised as mostly useful for ad-hoc searches and debugging.
What can You Monitor with Prometheus?
Prometheus is a multi-purpose monitoring tool that can track a wide range of infrastructure and software metrics. Here are a few examples of common applications.
Service Metrics
Prometheus is commonly used to gather numeric metrics from services that run all the time, and to make metric data accessible via HTTP endpoints. This can be done manually or with the help of a variety of client libraries.
Prometheus exposes data in a simple style, with each metric on its line, separated by line feed characters. Prometheus may query and scrape metrics from the file because it is published on an HTTP server with the provided path, port, and hostname.
Prometheus may also be used to execute distributed services over several hosts. Each instance broadcasts its metrics and is given a different identity by Prometheus.
Host Metrics
You can use the operating system to determine when a server's hard disk is full or if it is continually running at 100% CPU. You can use a specific exporter to collect operating system information and publish it to an HTTP-accessible address on the host.
Uptime/Status of the Website
Although Prometheus does not normally monitor website status, a BlackBox exporter can be used to do so. To query an endpoint, you specify the destination URL and run an uptime check to gather information like the website's response time.
To ensure Prometheus uses the BlackBox exporter, you define the hosts to be queried in the prometheus.yml configuration file, using relabel configs.
Cronjobs
You can use the Push Gateway to display metrics to Prometheus through an HTTP endpoint to see if a cronjob is running at the set intervals. You can compare the timestamp of the last successful job to the present time in Prometheus by pushing the timestamp of the last successful job to the Gateway. The monitor times out and sends an alert if the time exceeds the set threshold.
Conclusion
Prometheus Monitoring is a dependable way to collect and process metrics from machines and applications. Small inaccuracies and race circumstances due to factors like kernel scheduling and unsuccessful scrapes are common in operational monitoring, hence Prometheus is built for it.
Prometheus makes tradeoffs, preferring to give you 99.9% accurate data over your monitoring malfunctioning while you wait for flawless data. Prometheus should be utilized with caution in applications involving money or billing.
Also Read:
Monitor Your Entire Application with Atatus
Atatus is a Full Stack Observability Platform that lets you review problems as if they happened in your application. Instead of guessing why errors happen or asking users for screenshots and log dumps, Atatus lets you replay the session to quickly understand what went wrong.
We offer Application Performance Monitoring, Real User Monitoring, Server Monitoring, Logs Monitoring, Synthetic Monitoring, Uptime Monitoring, and API Analytics. It works perfectly with any application, regardless of framework, and has plugins.

Atatus can be beneficial to your business, which provides a comprehensive view of your application, including how it works, where performance bottlenecks exist, which users are most impacted, and which errors break your code for your frontend, backend, and infrastructure.
If you are not yet an Atatus customer, you can sign up for a 14-day free trial.