New Browser APIs for Detecting Javascript Performance Issues in the Production
Users nowadays demand the greatest possible experience, which implies top-notch performance. Smooth scrolling, prompt interaction responses, a fast page load time, and flawless animations are all things they anticipate.
Local profiling to identify performance issues is convenient, but it only provides a limited amount of information. While things may run smoothly on our high-end developer machines, the user may be dealing with poor hardware and a bad experience.
Alternatively, the user may utilize your application in ways you never considered or checked. Obtaining real data from production is the only method to demonstrate that an application works properly.
To collect performance measurements from end-user sessions, there are various fantastic new APIs and approaches. They're all in varying phases of proposal and implementation in browsers, but all of the ones listed are in the most recent Chromium versions.
Here’s how it is done:
#1 Add Stopwatches Manually
Before we go into the newest APIs, let's take a look at how you used to collect performance data from production.
The most straightforward method is to preserve a timestamp before and after an operation, as seen below:
HTML:
<button onclick="myfunc()">Click me</button>JavaScript:
function myfunc() {
    const start = performance.now();

    // Function Code...

    const duration = performance.now() - start;
}
I'm utilizing the performance.now() API, which is more suited for performance measures than Date.now() and is supported by all browsers.
This method is both easy and effective.

You can evaluate the findings and uncover tasks that take longer than 50 milliseconds if you send the duration to a telemetry database. You'll have a lot of information to figure out why the task took so long if you combine it with other logs in this context, provided you report them as well.
The drawback to this method is that you'll have to include this code in any function you want to measure. This will bloat the codebase considerably, not to mention the additional work necessary.
You can utilize strategies like placing this code around every function during the build step to automate instrumentation. Such instrumentation is undoubtedly a viable technique, but it will almost certainly introduce performance issues where none previously existed, skewing the reported results.
Such stopwatches are frequently used around performance-sensitive code that we are now attempting to optimize.
#2 Long Task API
The Long Task API can detect all tasks that take longer than 50 milliseconds and provide some basic information about them, such as the length, the iframe responsible (more or less), the DOM container responsible, and the type of work that is causing it (script, layout. etc.).
Here's how you can utilize it:
const observer = new PerformanceObserver(function(list) {
    for (const entry of list.getEntries()) {
        console.log(JSON.stringify(entry, null, 4));
    }
});
observer.observe({
    type: "longtask",
    buffered: true
});
Let's examine this code.

The PerformanceObserver (which is part of the Performance Timeline) exposes a variety of performance-related features that allow for high-resolution temporal specifications. The high-resolution component is no longer supported due to security concerns (see spectre attack), however, the data are still rounded up to 1 millisecond or so (depending on the browser).
We establish a PerformanceObserver and listen for "longtask" events to leverage the Long Task API. When there are issues, the observer's callback is invoked with a batch of all the entries that have been added since the last time it was invoked. We assume each frame's idle time is used to call a batch, thus we will get all the entries as soon as the main thread is free. Each of these entries indicates a time-consuming task.
Let's say my event handler took 52 milliseconds to respond to a button click. The following is what the code above will produce:
{
    "name": "unknown",
    "entryType": "longtask",
    "startTime": 468699.1000000015,
    "duration": 52,
    "attribution": [
        {
            "name": "unknown",
            "entryType": "taskattribution",
            "startTime": 0,
            "duration": 0,
            "containerType": "window",
            "containerSrc": "",
            "containerId": "",
            "containerName": ""
        }
    ]
}
The output reveals that there was one big task that took 52 milliseconds (my function would not trigger the API if it took less than 50 milliseconds). It's not in an iframe, but rather in the self window, as the name implies. startTime indicates when the long task began.
Even though the Lengthy Task API does not provide which functions were executed during the long task, this information is nevertheless very relevant. You can look into logs both before and after the long work was completed.
You may also generate a performance health metric by combining the number and duration of long tasks. You can use this metric to spot performance regressions. You can also do A/B testing to check if improving performance reduces the number of long tasks.
I enjoy this API because it provides powerful production insights without requiring me to take drastic efforts such as instrumenting my entire code.
Long Task API is now supported in all Chromium-based browsers except Firefox and Safari.
#3 Event Timing API
The Event Timing API is designed for long processes that are the result of user interaction. The observer callback will be fired whenever an event, such as a button click, takes more than 100 milliseconds to complete. You'll be able to learn about the task's length, the event's name, and the event's DOM object.
The problematic issue with event handlers is that the time the function runs isn't always the same as the time it takes for the user to interact because the event handler's processing doesn't begin right away. That is why traditional stopwatches do not deliver reliable results.
The main thread may be in the middle of something else when the user performs something, such as clicking a button. The action is queued, and it can only process the event when the main thread is free.
This API returns the duration of the event handler as well as the time since the user interaction began. This refers to our 50ms task rule, which states that if all tasks take 50ms or less, the overall operation will take less than 100ms.
Here's an example.
HTML:
<button onclick="myfunc()" id="mybutton">Click me</button>JavaScript:
const observer = new PerformanceObserver(function(list) {
    const perfEntries = list.getEntries().forEach(entry => {
        const inputDelay = entry.processingStart - entry.startTime;
        // Report the input delay when the processing start was provided.
        // Also report the full input duration via entry.duration.
    });
});

// Register observer for event.
observer.observe({entryTypes: ["event"]});

// ...

// We can also directly query the first input information.
new PerformanceObserver(function(list, obs) {
    const firstInput = list.getEntries()[0];

    // Measure the delay to begin processing the first input event.
    const firstInputDelay = firstInput.processingStart - firstInput.startTime;

    // Measure the duration of processing the first input event.
    // Only use when the important event handling work is done synchronously in the handlers.
    const firstInputDuration = firstInput.duration;

    // Obtain some information about the target of this event, such as the id.
    const targetId = firstInput.target ? firstInput.target.id : 'unknown-target';

    // Process the first input delay and perhaps its duration...

    // Disconnect this observer since callback is only triggered once.
    obs.disconnect();
}).observe({type: 'first-input', buffered: true});
The output will look something like this if the button's event handler myfunc executes for 150ms:
PerformanceEventTiming
duration: 168
entryType: "event"
name: "click"
processingEnd: 1731.0949999955483
processingStart: 1580.664999986766
startTime: 1577.709999983199
target: button #mybutton
duration: 168 handlersDuration: 150.43000000878237 Target Id: mybutton
We're using the PerformanceObserver interface again, but this time the entry is of the PerformanceEventTiming type. It's worth noting that, unlike the prior API, we're observing events rather than longtask.
We can view the duration of the event handler as well as the total duration from the time the user action occurred until all event handlers completed their task. This allows for more fine-tuned performance work, allowing you to spot issues that you wouldn't have discovered otherwise.
This API also provides a great deal of information with little effort. You may get your hands on the event name and even the DOM element itself, making it much easier to identify and resolve performance issues.
The Event Timing API, like the Long Task API, is only available in Chromium browsers.
Combining the Long Task API and the Event Timing API
With a single instance of PerformanceObserver, you can monitor many entry types.
Here's an example:
function handleEvent(entry) {
    console.log("Event entry", entry);
}

function handleLongTask(entry) {
    console.log("Long task entry", entry);
}

const performanceObserver = new PerformanceObserver((entries) => {
    for (const entry of entries.getEntries()) {
        switch (entry.entryType) {
            case 'event':
                handleEvent(entry);
                break;
            case 'longtask':
                handleLongTask(entry);
                break;
        }
    }
});

performanceObserver.observe({
    entryTypes: ['event', 'longtask']
});
#4 JavaScript Self Profiling API
The APIs we've discussed thus far provide a wealth of data, but the experience isn't yet complete. We did like something similar to local profiling, where I could look at a timeline view that showed all the call stacks that were called and their length. In Chrome DevTools, this is similar to the Performance view.
The JS profiling API accomplishes exactly this. It works as a full-featured sampling profiler that you can use in your browser. The profiler records call stacks of presently running functions every 10 milliseconds or so once you start it.
Here's an example:
HTML:
<button onclick="myfunc()" id="mybutton">Click me</button>JavaScript:
var profiler;
async function init() {
    profiler = await performance.profile({
        sampleInterval: 10
    });
}
init();

async function myfunc() {
    pausecomp(150);
    const trace = await profiler.stop();
    console.log(trace);
}

function pausecomp(millis) {
    var date = new Date();
    var curDate = null;
    do {
        curDate = new Date();
    }
    while (curDate - date < millis);
}
The function init starts the profiler with a 10-millisecond interval (in reality, it's 16 milliseconds), after which performance.profile() is called and the profiler begins logging call stacks. When you're through profiling, you'll call a profiler.stop() returns an object containing the recorded samples.
When you press the button in the previous example, the function myfunc pauses for 150 milliseconds, then stops the profiler and prints the call stack samples.
About 2300 milliseconds after the website loaded, I pressed the button. The result is as follows:
samples: Array(148)[0… 147]
0: {
    stackId: 2,
    timestamp: 101.6949999902863
}
1: {
    timestamp: 128.4600000071805
}
2: {
        timestamp: 143.61500000813976
    }
    ...(more empty samples)
135: {
    timestamp: 2363.76000000746
}
136: {
    timestamp: 2379.3249999871477
}
137: {
    stackId: 5,
    timestamp: 2394.479999988107
}
138: {
    stackId: 5,
    timestamp: 2310.530000009807
}
139: {
    stackId: 5,
    timestamp: 2425.4150000051595
}
140: {
    stackId: 5,
    timestamp: 2440.694999997504
}
141: {
    stackId: 5,
    timestamp: 2456.4400000090245
}
142: {
    stackId: 5,
    timestamp: 2471.530000009807
}
143: {
    stackId: 5,
    timestamp: 2487.4500000150874
}
144: {
    stackId: 5,
    timestamp: 2503.434999991441
}
145: {
    stackId: 5,
    timestamp: 2519.575000012992
}
146: {
    stackId: 5,
    timestamp: 2534.58999999566
}
147: {
    stackId: 6,
    timestamp: 2543.130000005476
}
stacks: Array(7)
0: {
    frameId: 2
}
1: {
    frameId: 1,
    parentId: 0
}
2: {
    frameId: 0,
    parentId: 1
}
3: {
    frameId: 5
}
4: {
    frameId: 4,
    parentId: 3
}
5: {
    frameId: 3,
    parentId: 4
}
6: {
    frameId: 6,
    parentId: 4
}
length: 7
frames: Array(7)
0: {
    name: "profile"
}
1: {
    column: 21,
    line: 39,
    name: "init",
    resourceId: 0
}
2: {
    column: 9,
    line: 35,
    name: "",
    resourceId: 0
}
3: {
    column: 20,
    line: 62,
    name: "pausecomp",
    resourceId: 0
}
4: {
    column: 23,
    line: 49,
    name: "myfunc",
    resourceId: 0
}
5: {
    column: 42,
    line: 77,
    name: "",
    resourceId: 0
}
6: {
    name: "stop"
}
Did we mention that Facebook suggested and supplied this API?

Anyway, let's take a closer look at this output. Looking at the samples, nothing happened until roughly sample #136. The profiler logged empty stacks because JavaScript functions did not run.
Each sample had the stackId 5 from frame 137 to frame 146, indicating that the same functions were run 10 times in a row. When looking at stacks, the frameId in the fifth element reflects the bottom function in the call stack, which is 3.
The pausecomp function appears as the third element in frames. The parent substack up to this function is parentId 4. Returning to the stack output, you can see that the 4th element represents the function myfunc, as well as parentId 3, which represents an empty function with no parent.
So the call stack from frame 137 to frame 146 was myfunc, which is called pausecomp.
You may combine the samples and determine the duration of each function using this output. In our situation, we can see that both myfunc and pausecomp took 160ms to complete (10 samples at 16ms intervals).
Samples in between empty stacks might be thought of as tasks. According to RAIL definition, a task is considered long if it takes more than 100 milliseconds to complete. You can report a long task to telemetry, investigate, and profit once the profiler has discovered it.
Converting these outputs to Google's Trace Event Format, which allows you to import and examine the samples in Chrome DevTools' "Performance" tab, is a great approach to debug them.
Wrap Up!!!
We discovered three APIs that provide us with several performance data for free. That is, you do not need to go through your entire code and add stopwatches or any other instrumentation.
All three can be combined into a "health metric" that can be used to detect performance regressions or perform A/B testing for performance improvements.
This type of measure is light years ahead of any manual testing or user feedback. It's the performance equivalent of a unit test suite for your application. Furthermore, the most recent API enables full-fledged profiling in production, which is rather impressive.
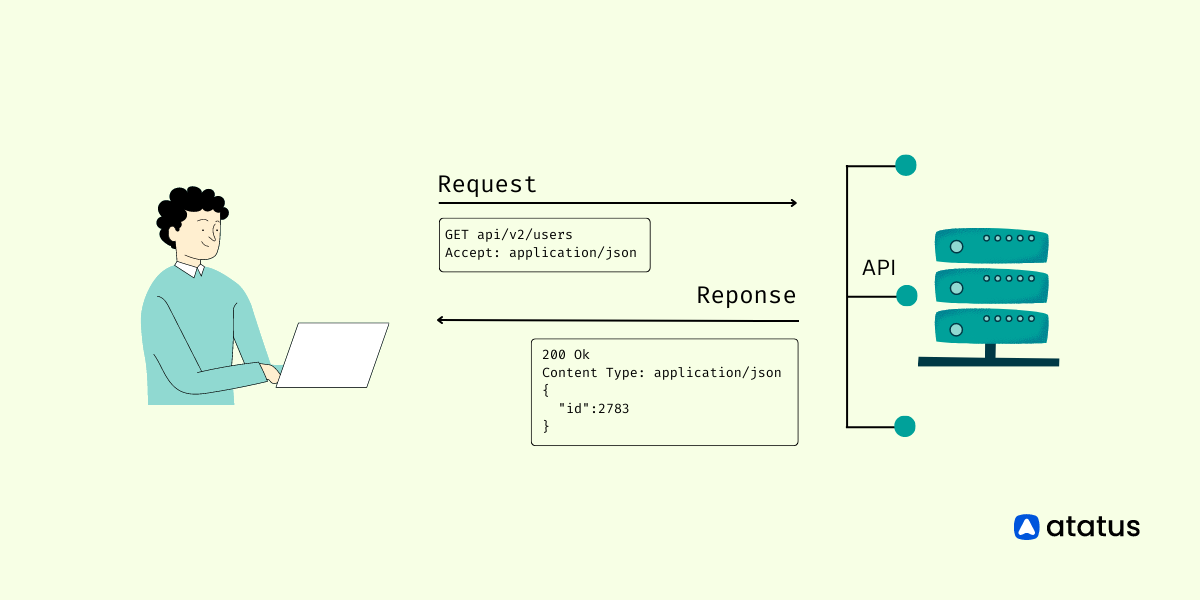
Atatus API Monitoring and Observability
Atatus provides Powerful API Observability to help you debug and prevent API issues. It monitors the consumer experience and be notified when abnormalities or issues arise. You can deeply understand who is using your APIs, how they are used, and the payloads they are sending.
Atatus's user-centric API observability tracks how your actual customers experience your APIs and applications. Customers may easily get metrics on their quota usage, SLAs, and more.
It monitors the functionality, availability, and performance data of your internal, external, and third-party APIs to see how your actual users interact with the API in your application. It also validates rest APIs and keeps track of metrics like latency, response time, and other performance indicators to ensure your application runs smoothly.
#1 Solution for Logs, Traces & Metrics
![]() APM
APM
![]() Kubernetes
Kubernetes
![]() Logs
Logs
![]() Synthetics
Synthetics
![]() RUM
RUM
![]() Serverless
Serverless
![]() Security
Security
![]() More
More