Apache Error Log Explained in Detail

Apache has been around since 1995 and is the most important web technology. The majority of businesses nowadays run-on Apache servers. Different servers operate in different ways and have different features and functions. For simple debugging, several servers keep server logs. Understanding how the server works is essential.
All errors encountered by the server while receiving or processing requests are recorded in the Apache error logs. These logs are accessible to admin users, who can troubleshoot them for immediate solutions.
These logs will provide you with useful information about the traffic to your application, errors that occur, and performance. This article will cover Apache web server logs, including log levels, format, and formatting as JSON.
We will cover the following:
- What are Apache Logs?
- What is the Apache Error Log?
- Apache Error Log vs Apache Access Log
- Where Do You Find the Apache Error Log?
- How Do You Check the Apache Error Log?
- Configuring Apache Logs
- Apache Error Log Levels
- Apache Error Log Format
- Apache Request Tracking
- Managed Dedicated Servers
- Unmanaged Dedicated Servers
- Assigning Nicknames
- Formatting as JSON
- How Do You Clear the Apache Error Log?
What are Apache Logs?
The Apache server keeps a record of all server actions in a text file known as Apache logs. These logs provide useful information about what resources are used and released. Additionally, the logs contain information about who visited those resources and for how long and all related data.
Not only that, but you'll get all of the details on all of the errors that occurred. The admins can use these logged errors to look into fixing the errors and determining the root cause to eliminate the possibility of the error occurring again.
There isn't a single Apache logging process. It involves several steps, including saving the logs in a specified area for future reference, analyzing and parsing the logs to extract the relevant information, and producing the graph for a better visual representation. There isn't a single log type that Apache keeps track of. However, we'll be concentrating on Apache error logs.
Types of Apache Log
There are two types of logs produced by Apache: Access logs and Error logs.
- Access Log
The access log keeps track of the requests that come into the webserver. This data could include what pages visitors are looking at, the status of requests, and how long it took the server to respond. - Error Log
The error log records any errors encountered by the web server when processing requests, such as missing files. It also contains server-specific diagnostic information.
What is the Apache Error Log?
If you can't figure out what's wrong with your server and it keeps throwing errors, it will become unreliable. We must keep information about the errors affecting the server's performance for easy and seamless server operation.
As a result, Apache keeps error logs in a specific location. For simple troubleshooting, the server administrator sets up these log files and other details such as file size, error time, type of error, error message, and so on.
The Apache log keeps track of events handled by the Apache web server, such as requests from other computers, Apache responses, and internal Apache server operations.
These logs will continue to be created and stored at that location, making them accessible in the future. You must understand where these errors are saved, how to access them, and how to use the information they provide.
Apache Error Log vs. Apache Access Log
The next thing that people appear to be confused about is the difference between the access log and the error log. Are these two different concepts? Or do they refer to the same thing under different names?

They're two very different things. The access log is not the same as the error log.
The access log keeps an account of all requests made to the web server, as well as who made them. You can think of it as a geekier version of an event guest log. It keeps track of information like visitor IP addresses, URL requests, responses, and so on.
While the access log may contain information about difficulties that arise, the error log—the subject of our discussion today—is dedicated to logging errors and problems that occur during the server's operation. You can search for general information about web requests in the access log, but errors should be found in the error log.
Where do you find the Apache Error Log?
Several factors have a role in this:
- Apache is a cross-platform web server that can run on nearly any operating system. It'll be difficult enough to figure out which version to download, let alone locate any log files it generates.
- The majority of Apache installations take place on Unix and Linux systems, which are even more fragmented in terms of where you can find stuff.
- Apache is highly customizable. While this gives it a lot of flexibility and power, it also makes items more difficult to find because you can put them everywhere.
So, what does it all add up to?
When you Google "where is the Apache error log," Google could simply pop up a message saying, "No one knows where yours is." This would save you a lot of clicking and bounce.
However, everything is not lost.
You could look up your operating system's log file location or the default Apache log file location using Google. Keep in mind that you'll have to search for your operating system. The '/var/log' directory is a common destination for log files on *nix systems.
Instead, we did investigate the location of your Apache configuration files. Because these are configurable Apache settings, you can identify the location of the error log (and other logs) once you have that.
For instance, consider the following example of log location configuration:
Update the below log path and log levels in the default configuration file - /etc/apache2/apache2.conf.
ErrorLog "/var/log/apache2/error.log"By the way, you're not obligated to name the file "error.log." Instead, any legal name you provide would suffice. If the specified file already exists, additional log entries will be appended to it.
You can also use a Syslog server to send log messages. Use the Syslog directive instead of a filename.
ErrorLog syslogThere are numerous options for the logging facility and the application name in the Syslog option. Details can be found here.
Finally, you can use a Linux command to redirect logs.
ErrorLog "|/usr/local/bin/httpd_errors"The pipe character tells Apache that the messages should be piped to the specified command.
Access logs for apache can be found in the following directory on the cPanel server.
/usr/local/apache/logs/access_logHow do you check the Apache Error Log?
How do you go about really checking it once you've located it?
You must first understand what it is to understand how it is.

A text file contains the Apache error log. So you can use any text editor or a command-line application like Cat or Tail to open it. These will offer you a quick preview of the contents and allow you to navigate through to find what you need. The entries in the file will be in reverse chronological order.
Let's say you wish to utilize the "tail" command. In practice, how would you go about doing that?
Easy. To begin, start a shell session.
After that, you type the command:
tail -f /path-to/logYou'll see the file's last few entries after running the command above. You'll also see new entries as they become available.
Since your log file contains errors, it should now be small. However, it could be large—too large to search quickly. In that situation, you might wish to use grep and regex to scan the contents of the error log. Alternatively, you may use a log aggregator to parse and turn the contents into data that you can readily query.
Configuring Apache Logs
The logging framework in Apache is highly flexible, allowing you to change logging behavior globally or for each virtual host. To adjust logging behavior, you can use several directives. The log level and log format directives are two of the most popular directives.
Apache Error Log Levels
It's no surprise that the Apache error log, like any other log file, uses logging levels.
If you're unfamiliar with the concept of logging levels, we recommend reading our post on the log levels.
In short, logging levels are labels that can be applied to log entries. The messages transmitted to the log file can then be filtered, thereby changing the verbosity of each message.
The LogLevel directive can be used to specify the desired level, as shown in the following example:
LogLevel warnThe default level is "warn," although there are a variety of alternative options.
The levels are described as follows in the Apache documentation:
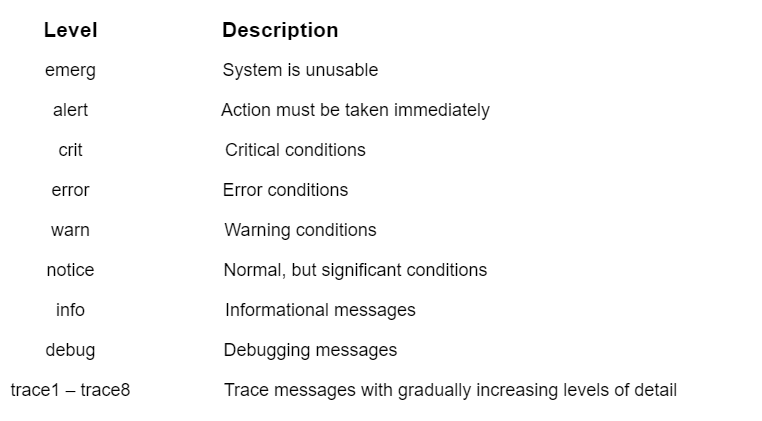
If you want to understand more about each level in-depth, go to Apache's documentation.
Let's look at how the two logging levels compare. We'll compare the levels of warning and debug logs.
- Warning: You will only receive warning logs if the system is functioning normally but something does not appear to be correct. If these warnings are not addressed promptly, they may result in serious problems over time.
- Debug log level, on the other hand, logs practically everything that happens on the server. It might be errors or any other essential notification that you as a website administrator could find useful.
The following command in the main configuration file can be used to enable debug log level.
LogLevel alert rewrite:trace6Apache Error Log Format
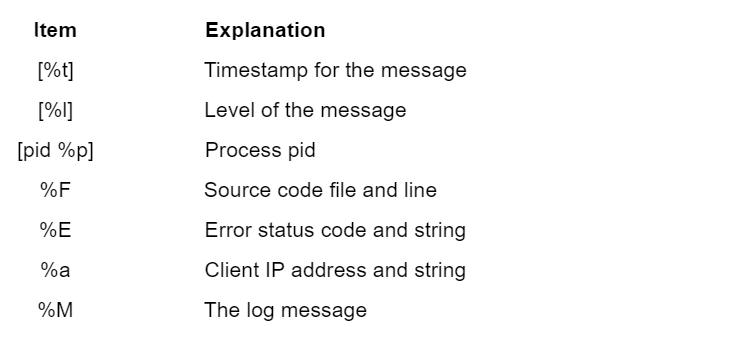
You can also modify the format of log messages. We have been using the default format thus far. The ErrorLogFormat setting controls the message composition.
Let's try a different setting to see what happens. We are going to utilize this example from the Apache documentation.
ErrorLogFormat "[%t] [%l] [pid %P] %F: %E: [client %a] %M"This is how a request appears right now:
[Thu Jun 09 11:46:18 2022] [fuga:error] [pid 6157:tid 4946] [client 144.110.67.126:20151] You can't copy the port without navigating the haptic SMTP card!
[Thu Jun 09 11:46:18 2022] [pariatur:info] [pid 5946:tid 7137] [client 35.8.11.82:2909] We need to transmit the primary SQL interface!
Let's go over how to use this format. The format string contains parameters that correspond to fields in a logging event.
The fields we used above are as follows:
For new connections and requests, you can define alternative formats. When a new client connects to the server, it is called a connection. A request is a communication that asks for something, such as a page or an image.
Apache uses connection and request formats when a new client connects or makes a web request. It records a message indicating that a client has established a connection or made a new request.
Apache Request Tracking
You can go a step further with logging messages for new connections and requests. Every new request or connection will generate a unique identifier in the Apache error log. This parameter can be used to group log entries. For identifiers, use the %L field.
Assigning Nicknames
You can give LogFormat strings nicknames, which you can use with the CustomLog directive to write logs in the format you specify. This allows you to use the same log format across multiple log files without having to change it each time. This is especially beneficial when many virtual hosts are utilizing separate log files.
Let's say you want to build an example format called "vhost_combined." Then, using the vhost_combined format, we'll create a CustomLog directive that writes logs to a file.
LogFormat "%v:%p %h %l %u %t "%r" %>s %O "%{Referer}i" "%{User-Agent}i"" vhost_combined
CustomLog /var/log/apache2/vhost.log vhost_combined
Formatting as JSON
If you save your logs as plain text, they'll be easy to scan if you ever need to read them. This makes it difficult to understand your logs with tools like log management solutions, which require knowledge of how your logs are formatted. The default Apache log format is supported by most log management solutions, but if it isn't, you should consider adopting a structured format like JSON.
JSON is a lightweight data storage format. JSON holds practically any data type and structure as a set of nestable name/value pairs. JSON is also self-documenting because the key name describes the data it contains. Strings, numbers, booleans, arrays, and null values are among the basic data types supported by JSON.
A LogFormat that saves logs in JSON format looks like this:
LogFormat "{ \"time\":\"%t\", \"remoteIP\":\"%a\", \"host\":\"%V\", \"request\":\"%U\", \"query\":\"%q\", \"method\":\"%m\", \"status\":\"%>s\", \"userAgent\":\"%{User-agent}i\", \"referer\":\"%{Referer}i\" }"Read must-know tips for JSON logging.
How Do You Clear the Apache Error Log?
Simply put, the log file will get quite large throughout a long period. You won't need error messages from two years ago at some point. So you'd like to get rid of it to free up some disk space, either by truncating it or backing it up somewhere else.
When it comes to deleting the logs, there's an interesting problem to solve. The server keeps a handle on the file for writing as long as it is operating. You can't just open it and start editing it, or back it up and delete it.
Having root access and doing something like this—overwriting the file contents with nothing—might be the simplest method. However, we would recommend making a backup of the file first.
Alternatively, you can follow the instructions for log rotation and piped logs on Apache's website. These solutions are more complicated, but they are more "proper" and less hacky.
However, regardless of how you approach deleting the logs or logging in general, our advice is to always err on the side of keeping as much information as possible.
Conclusion
The Apache error logs may appear to be simple. More than grepping log files or other ad hoc approaches are required to achieve uptime SLA. You should create a system for storing and analyzing Apache error logs. Tracking and analyzing HTTP error codes, finding outlier IP addresses, listing pages with slow response times, and other metrics that might improve uptime and MTTR.
Atatus Logs Monitoring and Management
Atatus offers a Logs Monitoring solution which is delivered as a fully managed cloud service with minimal setup at any scale that requires no maintenance. It monitors logs from all of your systems and applications into a centralized and easy-to-navigate user interface, allowing you to troubleshoot faster.

We give a cost-effective, scalable method to centralized logging, so you can obtain total insight across your complex architecture. To cut through the noise and focus on the key events that matter, you can search the logs by hostname, service, source, messages, and more. When you can correlate log events with APM slow traces and errors, troubleshooting becomes easy.
#1 Solution for Logs, Traces & Metrics
![]() APM
APM
![]() Kubernetes
Kubernetes
![]() Logs
Logs
![]() Synthetics
Synthetics
![]() RUM
RUM
![]() Serverless
Serverless
![]() Security
Security
![]() More
More