Implementing OTEL for Kubernetes Monitoring

Kubernetes is a top container orchestration platform. The Kubernetes clusters manage everything much from collecting to storing vast magnitudes of data from your multiple applications. It is this very property that can sometimes boom into an unending data pile later on.
Imagine a large warehouse of apparel, it has every size of clothing for men, women, and children. Now if you are asked to pick out one particular type from it within a small time frame, I know you will totally dread it.
So what to do then? Well, it is all easy if you’ve categorized them separately from the very beginning. Similarly, it is better to monitor Kubernetes from the very start. Not only does this make it more easy to view and understand but it can also aid to find patterns that work and don't work for your application.
Observing your Kubernetes cluster entails monitoring and analyzing its performance to guarantee the well-being of your applications. By doing so, you can promptly detect any performance-related problems, including pod failures and excessive CPU usage. This proactive approach not only reduces the Mean Time To Resolution (MTTR) but also optimizes your application's uptime, ultimately ensuring user satisfaction.
In this blog, we will discuss how you can monitor Kubernetes with one of the popular open-source monitoring solutions out there - Opentelemetry. Let’s see how you can do it:
The Process:-
- Integrate Opentelemetry with Kubernetes
- Collect Telemetry Data
- Export Collected Data to Backend
- Store Data in a Metric Storage System
- Analyze and Visualize Collected Data
Integrate Opentelemetry with Kubernetes
To get started, integrate OpenTelemetry into your Kubernetes environment. This involves instrumenting your applications and infrastructure components to capture telemetry data. Opentelemetry libraries are available in various languages; select the appropriate library for your programming language.
Example: Instrumenting a Python application
from opentelemetry import trace
from opentelemetry.sdk.trace import TracerProvider
from opentelemetry.ext import zipkin
from opentelemetry.sdk.trace.export import BatchExportSpanProcessor
import requests

trace.set_tracer_provider(TracerProvider())
zipkin_exporter = zipkin.ZipkinSpanExporter(service_name="my-k8s-app", endpoint="http://zipkin-service:9411/api/v2/spans")
span_processor = BatchExportSpanProcessor(zipkin_exporter)
trace.get_tracer_provider().add_span_processor(span_processor)

with trace.start_as_current_span("example-span"):
    # Your application code here
    response = requests.get("https://example.com")
    print(response.status_code)
Collect Telemetry Data
The OpenTelemetry Collector plays a crucial role in collecting telemetry data from various sources, including Kubernetes environments. It acts as an intermediary component between the instrumented applications and the backends (observability platforms), where the telemetry data is ultimately stored and analyzed.
Collector components: Receiver, Processor, Exporter, Connector.
You can send your SDK data directly to the backend without using a collector, but if you are using one then you have two options: using Daemonset - where the collector runs parallelly along with the other applications on the same host.
The collector can also be run as a gateway or deployment, where they run as standalone instances per data, per cluster, per region, etc. Here, we will deploy the OpenTelemetry Collector as a DaemonSet for our Kubernetes cluster.
Helm serves as a tool for overseeing Kubernetes applications. By utilizing the Helm charts of OpenTelemetry, you gain the ability to effectively handle the installation process of both the Collector and the operator.
To properly configure the operator, a YAML file will be employed, encompassing the custom resource definition (CRD) for your Collector. This file will serve as the platform to define and activate the various OpenTelemetry components.
OpenTelemetry Collector YAML Manifest:
apiVersion: apps/v1
kind: DaemonSet
metadata:
  name: otel-collector
spec:
  selector:
    matchLabels:
      app: otel-collector
  template:
    metadata:
      labels:
        app: otel-collector
    spec:
      containers:
      - name: otel-collector
        image: otel/opentelemetry-collector:latest
        args:
          - "--config=/etc/otel-collector-config.yaml"
        volumeMounts:
          - name: config
            mountPath: /etc/
      volumes:
      - name: config
        configMap:
          name: otel-collector-config
Export Collected Data to Backend
Exporters route your collector data to the available backend options. OpenTelemetry Collector can be configured to export data to the backend of your choice, such as Jaeger, Zipkin, or another exporter that is supported by OpenTelemetry Collector.
OTLP Exporter Exports data via gRPC using the OpenTelemetry Line Protocol (OTLP) format
receivers:
  otlp:
    protocols:
      grpc:

exporters:
  zipkin:
    endpoint: "http://zipkin-service:9411/api/v2/spans"

service:
  pipelines:
    traces:
      receivers: [otlp]
      exporters: [zipkin]
Store Data in a Metric Storage System
In order to use OpenTelemetry effectively, it needs to be integrated with a metric storage system such as Prometheus. You will need to adjust the OpenTelemetry Collector configuration to be able to export metrics to Prometheus using it.
receivers:
  otlp:
    protocols:
      grpc:

exporters:
  prometheus:
    endpoint: "http://prometheus-service:9090/metrics"

service:
  pipelines:
    metrics:
      receivers: [otlp]
      exporters: [prometheus]
Analyze and Visualize Collected Data
When you have successfully incorporated OpenTelmetry into Kubernetes, as the first step, application data is received in the collector.
- Traces and logs are received by the OTLP receiver
- Metrics are received by the OTLP, Prometheus, k8s_cluster, and k8sobjects receivers
The data is then processed by the processors:
- Traces and metrics go through the
memory_limiterprocessor first, then get transformed by the k8sattributes processor, then finally get batched by the batch processor - Logs go straight to the k8sattributes processor or in case if
memory_limiteris enabled, they will go to their customized destination.
The third and final step is where this processed data is exported to the backend by the exporters.
- Traces and metrics are routed via the OTLP exporter
Once exported, they can be routed to some observability platforms for analysis and visualization.
Conclusion
In conclusion, incorporating OpenTelemetry into Kubernetes monitoring can greatly improve efficiency and provide valuable insights into the performance and health of a cluster.
With its ability to collect and correlate metrics, traces, and logs from various sources, OpenTelemetry offers a comprehensive approach to monitoring that can help organizations better understand and optimize their Kubernetes environments.
By following these steps, you'll have a comprehensive OpenTelemetry setup for monitoring your Kubernetes environment. As the use of Kubernetes continues to grow, implementing tools like OpenTelemetry will become increasingly important for ensuring the smooth operation of complex clusters.
Adjust the configurations and integrations to meet the specific needs of your applications and infrastructure. Happy monitoring!
Atatus Kubernetes Monitoring
With Atatus Kubernetes Monitoring, users can gain valuable insights into the health and performance of their Kubernetes clusters and the applications running on them. The platform collects and analyzes metrics, logs, and traces from Kubernetes environments, allowing users to detect issues, troubleshoot problems, and optimize application performance.
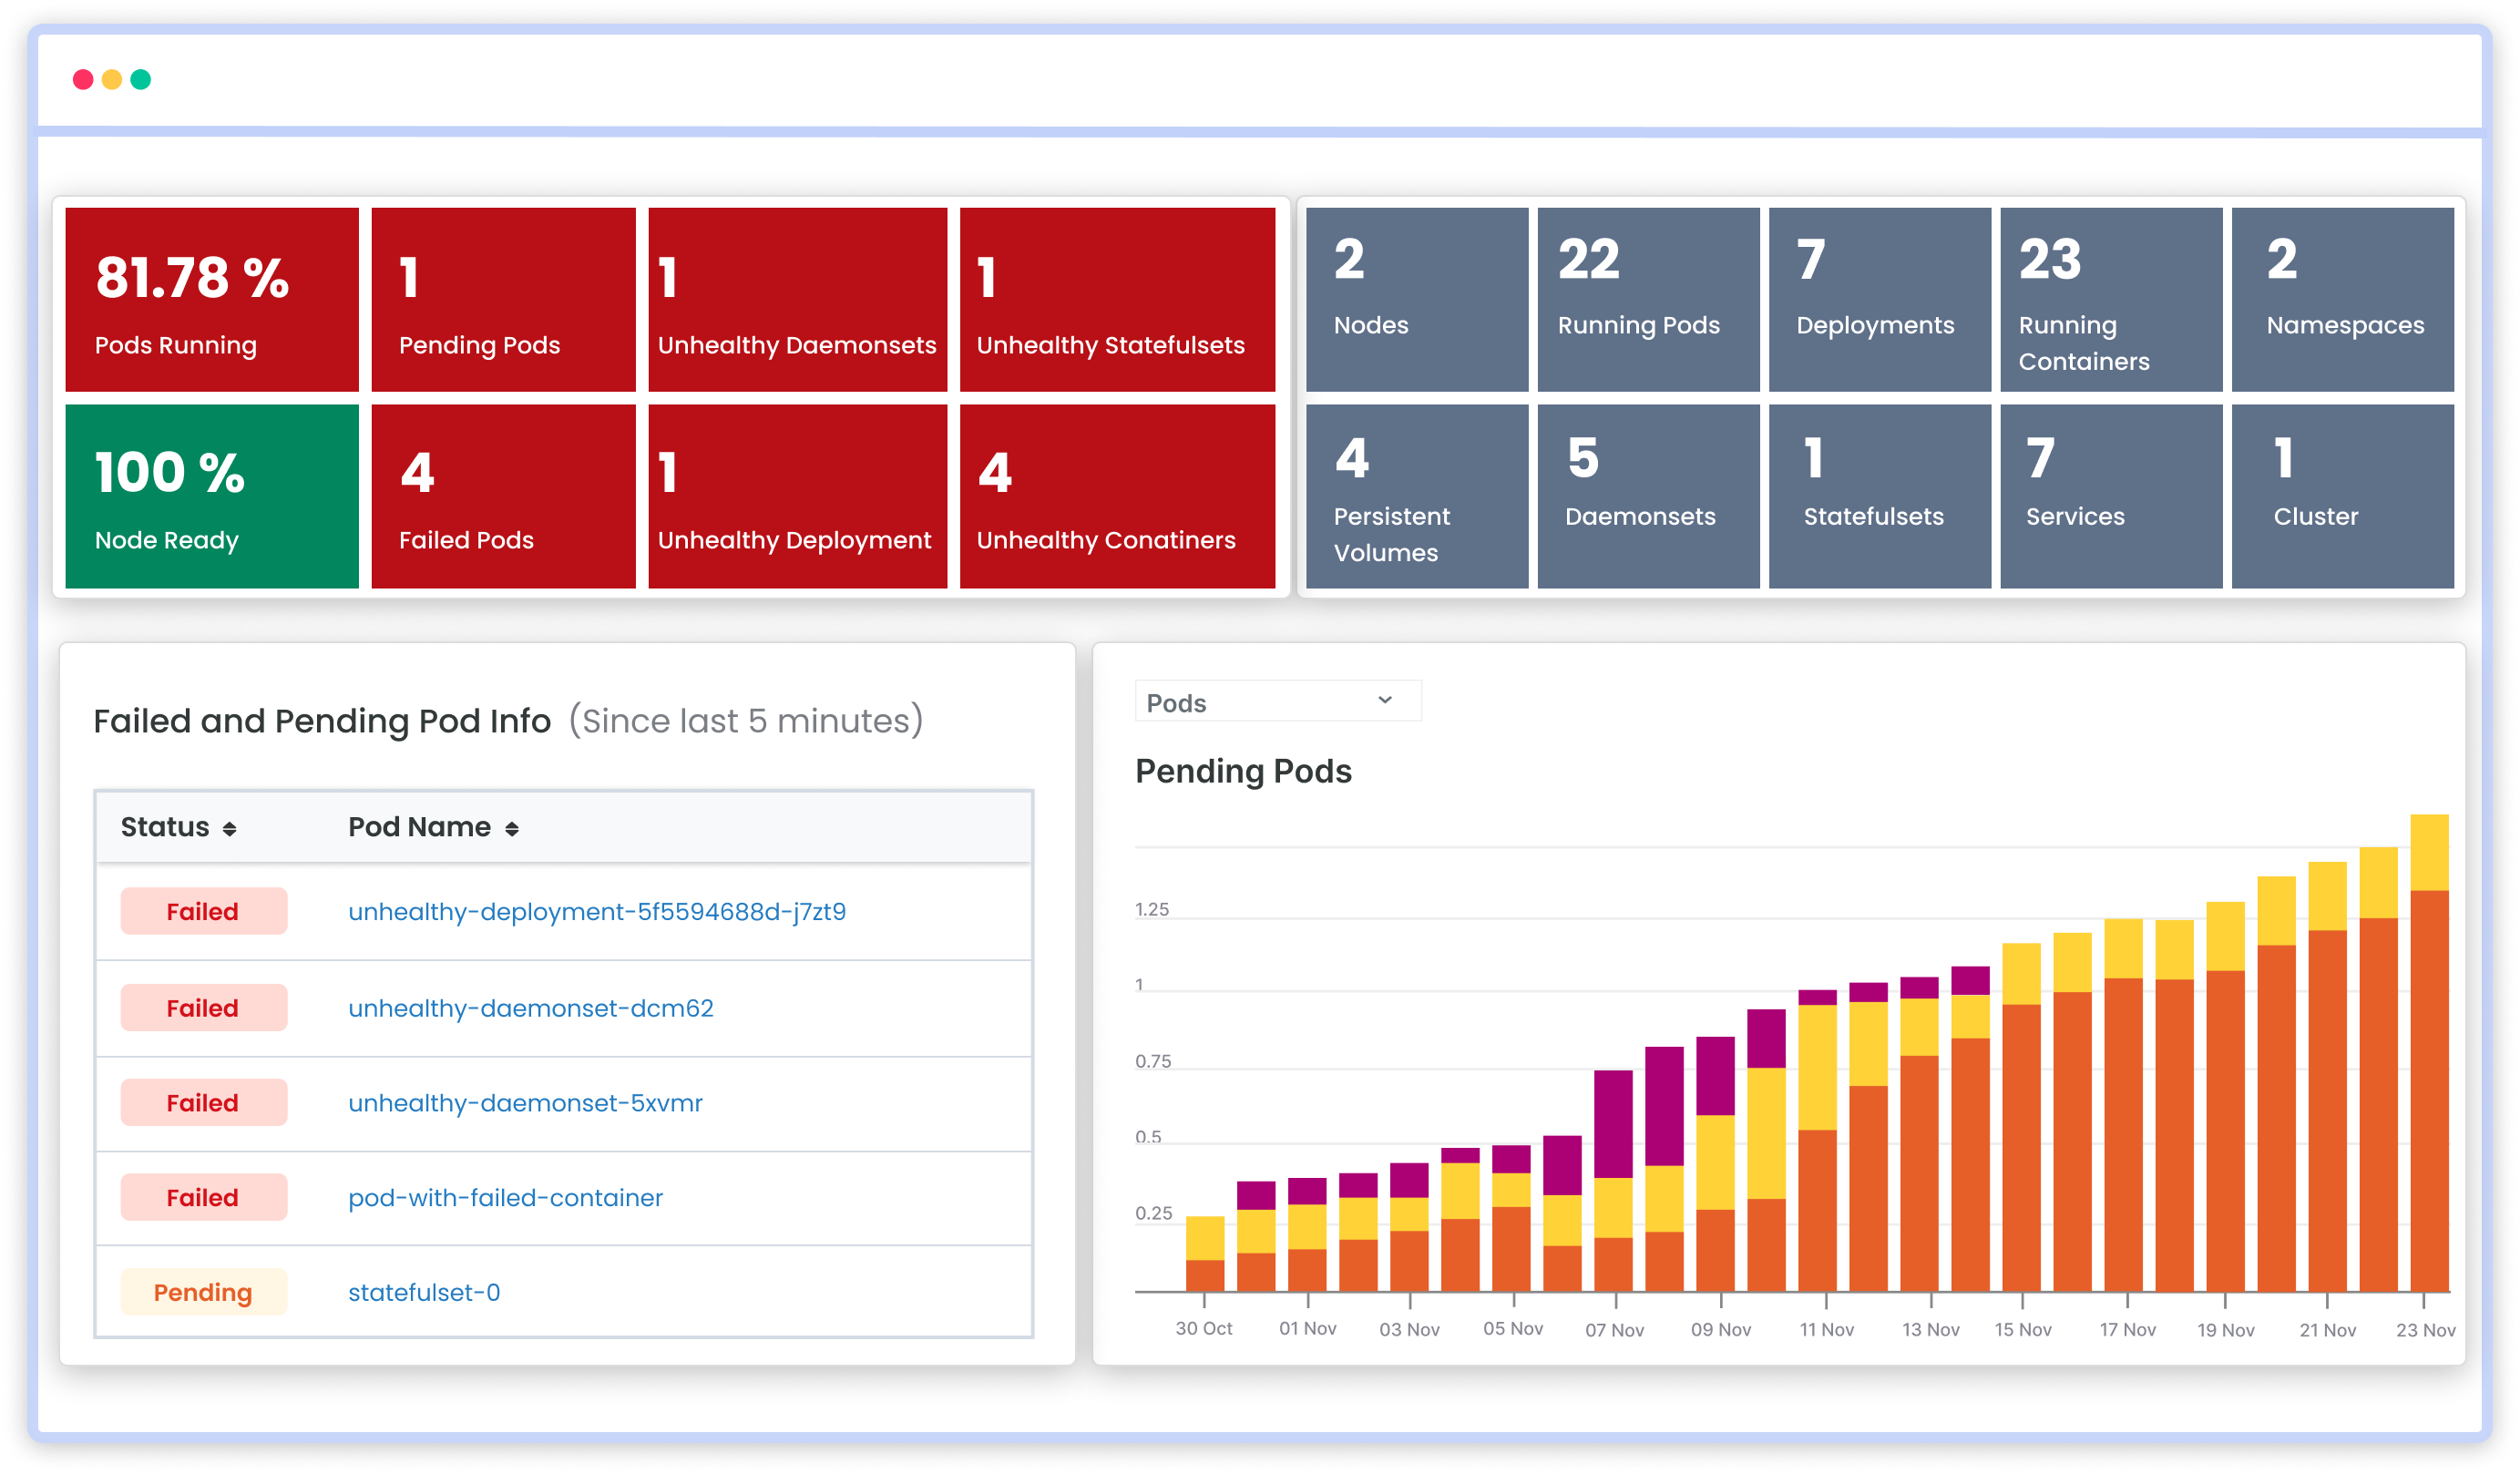
You can easily track the performance of individual Kubernetes containers and pods. This granular level of monitoring helps to pinpoint resource-heavy containers or problematic pods affecting the overall cluster performance.
#1 Solution for Logs, Traces & Metrics
![]() APM
APM
![]() Kubernetes
Kubernetes
![]() Logs
Logs
![]() Synthetics
Synthetics
![]() RUM
RUM
![]() Serverless
Serverless
![]() Security
Security
![]() More
More