PostgreSQL Connection Pool Exhausted in Kubernetes: Causes, Diagnosis and Fixes

"Connection pool exhausted" is one of PostgreSQL's most misleading production errors. The database is often healthy, while your application waits behind full connection pools. In Kubernetes, every pod and replica maintains its own pool, amplifying issues like connection leaks and slow queries across the cluster.
With 72% of organisations now running databases on Kubernetes, 82% of container users running Kubernetes in production, and production outages costing many enterprises over $300,000 per hour, connection pool management is now a critical reliability concern. This guide explains the root causes, how to diagnose the problem with psql and kubectl, proven fixes, and how observability helps prevent it from happening again.
Table of Contents:
- What PostgreSQL Connection Pool Exhaustion Actually Is?
- How Connection Pools Work in Kubernetes?
- Root Causes of Connection Pool Exhaustion, Ranked by How Often They Show Up
- Diagnosing Pool Exhaustion Live
- From Immediate Triage to Long-Term Architecture
- What to Monitor Continuously, Not Just During an Incident?
- Why Traditional Monitoring Misses This Until It's an Outage?
- How Engineers Actually Investigate This With Atatus?
- Pre-Deploy Checklist for PostgreSQL on Kubernetes?
- Frequently Asked Questions
What PostgreSQL Connection Pool Exhaustion Actually Is?
A connection pool is a fixed set of already-open connections that an application reuses instead of opening a new TCP connection and forking a new PostgreSQL backend process for every query, which is expensive on both sides. When a request needs the database, it checks out a connection from the pool. When it's done, it checks the connection back in.
Exhaustion happens when every connection in that pool is checked out at the same time and none are being returned fast enough. The next request waits. If nothing frees up before the pool's own wait timeout, that request fails, usually with something like timeout: unable to acquire connection from pool, FATAL: too many clients already, or a driver-specific variant. Note the two distinct failure points:
- Application-side pool exhaustion: The pool (HikariCP, pgx, node-postgres, SQLAlchemy) is full. PostgreSQL itself may still have plenty of available connections.
- Database-side connection exhaustion: PostgreSQL has hit
max_connections(default: 100) across all clients combined and refuses new connections outright withFATAL: sorry, too many clients already.
How Connection Pools Work in Kubernetes?
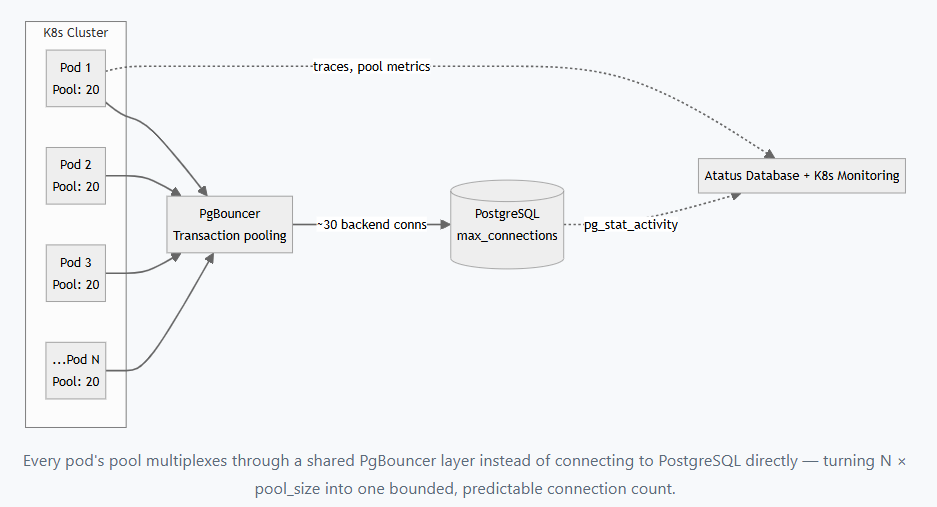
On a single VM running one application instance, there's one pool to reason about. In Kubernetes, every pod that talks to PostgreSQL instantiates its own independent pool, sized by whatever the application or its config map says Kubernetes has no built-in awareness of database connection limits at all.
That means total connection demand = pool size per pod × number of live pods, and every event that changes replica count changes that number instantly:
- Horizontal Pod Autoscaler (HPA) events can add 10-30 pods in under a minute in response to a CPU or custom-metric spike each one opening a full pool the moment it starts.
- Rolling deployments run old and new ReplicaSets side by side during the rollout window, so connection demand briefly doubles.
- CrashLoopBackOff and restart storms repeatedly tear down and re-establish pools, which can look like a connection leak from the database side even when no single pod is misbehaving.
Root Causes of Connection Pool Exhaustion, Ranked by How Often They Show Up
#1 Connection Leaks
Symptom: Pool utilization climbs steadily over hours and never drops, even during low traffic.
Why: A code path acquires a connection and returns or throws before releasing it back to the pool commonly a missing finally/defer, or an exception thrown between checkout and checkin.
Where to look: pg_stat_activity rows in idle or idle in transaction state with a state_change timestamp from hours ago.
Fix: Wrap every checkout in try/finally (Java: try-with-resources; Go: defer conn.Release(); Python: a context manager), and set idle_in_transaction_session_timeout as a hard backstop.
#2 Pool Size Set Without Doing the Multiplication
Symptom: Exhaustion appears the moment replica count grows, with no code change involved.
Why: Pool size per pod was copied from a single-instance deployment and never revisited for N replicas. 15 pods × 20 connections = 300, comfortably over a default max_connections of 100.
Where to look: SELECT count(*) FROM pg_stat_activity; compared against SHOW max_connections; during peak replica count.
Fix: Size per-pod pools for the workload (see the sizing formula below), and put a pooler in front so total replica count stops mattering to the database.
#3 HPA Scale-Out Without Connection Capacity Planning
Symptom: New pods fail readiness probes right after a scale-out event; older pods are unaffected.
Why: The HPA has no concept of database connection budget, it only watches CPU/memory/custom metrics. It will happily schedule pods that can never get a connection.
Where to look: kubectl describe hpa <name> for recent scaling events, cross-referenced against a spike in FATAL: too many clients in pod logs at the same timestamp.
Fix: Cap maxReplicas so maxReplicas × pool_size ≤ max_connections through the pooling layer, not direct to Postgres.
#4 Slow Queries and Lock Contention Holding Connections
Symptom: Pool exhausts in short, sharp bursts that correlate with a specific endpoint or batch job, not a steady climb.
Why: A query (or a lock it's waiting on) takes seconds instead of milliseconds. Every concurrent request hitting that code path holds a connection for the full duration.
Where to look: pg_stat_statements ordered by mean_exec_time, and pg_locks joined to pg_stat_activity for blocked sessions.
Fix: Add the missing index, break up long transactions, and set a statement_timeout so one bad query can't monopolize a connection indefinitely.
#5 Rolling Deployments Doubling Connection Demand
Symptom: Brief exhaustion spikes exactly during deploys, self-resolving within a few minutes.
Why: Kubernetes' default RollingUpdate strategy keeps old pods alive while new ones become ready, so both ReplicaSets hold pools simultaneously.
Where to look: kubectl rollout history timestamps against a connection-count time series.
Fix: Lower maxSurge, route through a pooler that absorbs the overlap, or size max_connections / pooler capacity with headroom for 1.5-2x steady-state demand.
#6 PgBouncer or Pooler Misconfiguration
Symptom: Exhaustion persists even after adding PgBouncer.
Why: Most often it's running in session pooling mode instead of transaction mode, session mode holds one backend connection per client for the client's entire session, which barely reduces total connections at all.
Where to look: SHOW POOLS; in the PgBouncer admin console - check cl_active vs sv_active ratios.
Fix: Switch pool_mode = transaction in pgbouncer.ini, being mindful this disallows session-level features like prepared statements without extra handling (PgBouncer 1.21+ supports prepared statement pooling in transaction mode).
#7 ORM Defaults That Were Never Tuned
Symptom: Exhaustion right after adopting a new ORM or framework version, with no explicit pool config in the codebase.
Why: Most ORMs ship a conservative default (often 5-10) tuned for a single-process app, unaware it will be instantiated once per pod.
Where to look: Framework config for an explicit pool size; if absent, the library docs for its default.
Fix: Set pool size explicitly rather than trusting the default, and size it against actual concurrency, not a guess.
| Error you see | Most likely root cause | Fastest confirmation |
|---|---|---|
FATAL: sorry, too many clients already | Database-side, max_connections hit | SELECT count(*) FROM pg_stat_activity; near the limit |
timeout: unable to acquire connection from pool | Application pool exhausted, DB has headroom | Pool at capacity, but pg_stat_activity total well under max_connections |
| Pool full but low query volume | Leak or idle-in-transaction | state = 'idle in transaction' rows with old state_change |
| Exhaustion right after a deploy | Rolling update overlap | Timestamp match with kubectl rollout history |
| Exhaustion right after a scale-out | HPA without capacity planning | Timestamp match with kubectl describe hpa events |
Stop guessing which cause it is!
Atatus Database Monitoring surfaces pool utilization, idle-in-transaction duration, and slow queries side by side with the Kubernetes pod events and deploy timestamps that usually explain them
Diagnosing Pool Exhaustion Live
Work top-down: confirm whether the database or the application pool is the bottleneck, then narrow to the specific cause.
1. Check total connections against the limit
SELECT count(*) FROM pg_stat_activity;
SHOW max_connections;
If the count is near the max, it's database-side - go to step 2. If it's well under, the application pool itself is the ceiling, jump to step 4.
2. Find which pods or services are holding connections
SELECT application_name, usename, state, count(*)
FROM pg_stat_activity
GROUP BY application_name, usename, state
ORDER BY count(*) DESC;
Set application_name in your connection string to the pod name or service name (most drivers support this) so this query actually tells you something in a multi-pod deployment.
3. Isolate idle-in-transaction and long-running sessions
SELECT pid, application_name, state,
       now() - state_change AS duration,
       query
FROM pg_stat_activity
WHERE state != 'idle'
ORDER BY duration DESC
LIMIT 20;
Anything sitting in idle in transaction for more than a few seconds under normal load is a leak candidate, not a query performance issue.
4. Check pod-level pool metrics and logs
# Pods currently crash-looping or failing readiness - a common companion symptom
kubectl get pods -n <namespace> --field-selector=status.phase!=Running

# Grep recent pool errors across the deployment
kubectl logs -n <namespace> -l app=<your-app> --since=15m | grep -i "pool\|too many clients\|timeout"

# Recent HPA scaling activity
kubectl describe hpa <hpa-name> -n <namespace>

# Rolling deploy history, to check overlap timing
kubectl rollout history deployment/<name> -n <namespace>
5. Find the slow queries actually holding connections
SELECT query, calls, mean_exec_time, total_exec_time
FROM pg_stat_statements
ORDER BY mean_exec_time DESC
LIMIT 15;
Requires the pg_stat_statements extension enabled - if it isn't, this is worth enabling permanently, not just for this incident.
6. Check for lock contention
SELECT blocked.pid AS blocked_pid, blocked.query AS blocked_query,
       blocking.pid AS blocking_pid, blocking.query AS blocking_query
FROM pg_stat_activity blocked
JOIN pg_locks bl ON bl.pid = blocked.pid AND NOT bl.granted
JOIN pg_locks kl ON kl.locktype = bl.locktype AND kl.database IS NOT DISTINCT FROM bl.database
  AND kl.relation IS NOT DISTINCT FROM bl.relation AND kl.granted
JOIN pg_stat_activity blocking ON blocking.pid = kl.pid
WHERE blocked.pid != blocking.pid;
From Immediate Triage to Long-Term Architecture
Immediate (stop the bleeding, minutes)
- Kill idle-in-transaction sessions manually to free connections right now:
SELECT pg_terminate_backend(pid) FROM pg_stat_activity WHERE state = 'idle in transaction' AND now() - state_change > interval '5 minutes'; - Pause the HPA or manually cap
maxReplicasif a scale-out is actively driving the exhaustion. - Roll back if the spike started at a specific deploy.
Medium-term
HikariCP (Java) - sane defaults for a pod-per-pool deployment
spring:
  datasource:
    hikari:
      maximum-pool-size: 15
      minimum-idle: 5
      idle-timeout: 300000        # 5 min
      connection-timeout: 10000   # 10s - fail fast, don't hang requests
      max-lifetime: 1800000       # 30 min - recycle before infra decides to
      leak-detection-threshold: 30000  # log a warning if held 30s+
PgBouncer - transaction pooling in front of N pods
[databases]
appdb = host=postgres-primary.svc.cluster.local port=5432 dbname=appdb

[pgbouncer]
listen_addr = 0.0.0.0
listen_port = 6432
pool_mode = transaction
max_client_conn = 2000
default_pool_size = 30
reserve_pool_size = 5
server_idle_timeout = 600
query_wait_timeout = 20
Kubernetes - PgBouncer as a shared Deployment fronting Postgres
apiVersion: apps/v1
kind: Deployment
metadata:
  name: pgbouncer
spec:
  replicas: 2
  selector:
    matchLabels: { app: pgbouncer }
  template:
    metadata:
      labels: { app: pgbouncer }
    spec:
      containers:
        - name: pgbouncer
          image: edoburu/pgbouncer:1.21.0
          ports: [{ containerPort: 6432 }]
          envFrom:
            - secretRef: { name: pgbouncer-config }
          readinessProbe:
            tcpSocket: { port: 6432 }
            initialDelaySeconds: 5
---
apiVersion: v1
kind: Service
metadata:
  name: pgbouncer
spec:
  selector: { app: pgbouncer }
  ports: [{ port: 6432, targetPort: 6432 }]
Point application connection strings at the pgbouncer Service instead of PostgreSQL directly, this is the single change that decouples "how many pods am I running" from "how many connections does Postgres see."
Long-term (architecture)
- Cap HPA maxReplicas against pooler capacity, not against CPU headroom alone.
- Workload isolation put reporting/batch jobs on a read replica or a separate pooler pool so a heavy analytical query can't starve request-serving connections.
- Read replicas for read-heavy paths to spread connection load across more
max_connectionsbudget total. - Circuit breakers around the database call so a struggling pool degrades gracefully (fail fast, serve cached data) instead of every pod piling on more waiting requests.
- Graceful shutdown handle
SIGTERMto close pool connections cleanly before the pod terminates, instead of leaving them for PostgreSQL's TCP timeout to clean up.
| Pooler | Pooling model | Best for | Kubernetes deployment pattern |
|---|---|---|---|
| PgBouncer | Session / transaction / statement | Most workloads; lightweight, single-purpose | Shared Deployment, or sidecar per pod for stricter isolation |
| Pgpool-II | Session-based, adds load balancing + replication awareness | Read/write splitting across replicas | Shared Deployment in front of a primary + replica set |
| HikariCP | Application-level pool, not a proxy | JVM apps; pairs with PgBouncer, doesn't replace it | In-process, one per pod |
| Supavisor / RDS Proxy / Cloud SQL Auth Proxy | Managed transaction pooling | Teams on managed Postgres wanting a pooler with no ops overhead | Cloud-managed, sits between VPC and DB endpoint |
What to Monitor Continuously, Not Just During an Incident?
Pool exhaustion is one of the clearest cases where the RED (Rate, Errors, Duration) and USE (Utilization, Saturation, Errors) frameworks map directly onto actionable signals:
| Signal | What to track | Why it matters here |
|---|---|---|
| Pool saturation | Active / total pool size, per pod | The earliest leading indicator - climbs before errors do |
| Wait time | Time spent waiting for a checkout (span-level via OTel) | Separates "pool is full" from "query is slow" |
| Idle-in-transaction duration | pg_stat_activity state age | Direct leak signal |
| Connection count vs. max_connections | Database-side, cluster-wide | Database-side ceiling, independent of any one pod |
| Pod events | Restarts, HPA scale events, rollout timestamps | Correlates a spike to its actual trigger |
| Slow query rate | pg_stat_statements mean_exec_time trend | Root cause behind connections being held too long |
PromQL - alert when pool utilization sustains above 80% for 5 minutes
(
  sum(db_pool_active_connections) by (pod)
  /
  sum(db_pool_max_connections) by (pod)
) > 0.8
OpenTelemetry Collector - capturing pool checkout time as a span attribute
receivers:
  otlp:
    protocols: { grpc: {}, http: {} }
processors:
  batch: {}
exporters:
  otlp:
    endpoint: "ingest.atatus.com:4317"
service:
  pipelines:
    traces:
      receivers: [otlp]
      processors: [batch]
      exporters: [otlp]
Most modern PostgreSQL client instrumentation (pgx, node-postgres, psycopg, JDBC via HikariCP micrometer) emits a distinct span for connection acquisition, that's what separates a pooling problem from a query performance problem in a trace waterfall, rather than one opaque "database call" block.
Why Traditional Monitoring Misses This Until It's an Outage?
Most teams already have some monitoring like CPU/memory dashboards, maybe a Postgres exporter in Grafana. It still gets missed in production for a few structural reasons:
- Metrics without traces - a dashboard shows pool utilization at 95%, but not which specific request or query is holding those connections.
- Missing pod-level correlation - connection metrics live in one tool, HPA/deploy events live in
kubectl, and nobody's lining up the timestamps until after the incident. - Siloed logs - the "too many clients" error shows up in application logs, the actual cause (idle-in-transaction) shows up in Postgres logs, and they're rarely searched together.
- Alerts fire on the symptom, not the trend - most setups alert when the pool hits 100%, which is already the outage, instead of when it crossed 70% ten minutes earlier with no traffic spike to explain it.
Closing that gap means correlating database state, pod events, and request traces in one place which is the specific job observability tooling does that ad-hoc dashboards don't.
How Engineers Actually Investigate This With Atatus?
A typical investigation looks like this:
- An alert fires from Atatus Database Monitoring - pool utilization crossed 80% and is still climbing, well before requests start failing.
- Atatus APM shows the request traces from the same window, with the connection-acquisition span broken out separately from query execution time, confirming this is a pool wait, not a slow query.
- Atatus Kubernetes Monitoring lines up the timeline against pod events in practice this is very often an HPA scale-out or the tail end of a rolling deploy, visible as a timestamp match rather than a guess.
- Logs Monitoring surfaces the exact
idle in transactionortoo many clientsmessages, searchable alongside the trace and the pod event in the same view instead of three separate tools. - Root cause analysis correlates the error spike to the most likely trigger, the deploy, the scale event, or the specific slow query cutting the "which of these five things happened first" step out of the incident entirely.
Related capabilities worth knowing about for this exact class of problem: Kubernetes Monitoring for pod and HPA event correlation, Database Monitoring for pool and query-level metrics, and APM for the distributed traces that connect the two.
See your own connection pool trend, not a hypothetical one
Instrument one service and watch pool utilization, slow queries, and Kubernetes pod events show up correlated within minutes.
Pre-Deploy Checklist for PostgreSQL on Kubernetes
- Multiply
maxReplicas × pool_size_per_podand confirm it's under your pooler's or database's connection budget, not just under a guess. - Run a pooler (PgBouncer in transaction mode) between application pods and PostgreSQL, don't connect directly at scale.
- Set
idle_in_transaction_session_timeoutat the database or role level as a backstop against leaks. - Set an explicit application-side pool size - never rely on an ORM's default.
- Set a
connection-timeoutthat fails fast (5-10s) rather than hanging requests indefinitely. - Enable
pg_stat_statementsbefore you need it, not during the incident. - Tag connections with
application_nameper pod/service sopg_stat_activityis actually attributable. - Account for rolling-update overlap (old + new ReplicaSet) in your connection budget, not just steady-state replica count.
- Implement graceful shutdown on
SIGTERMso pods release connections cleanly instead of leaving them for a timeout. - Alert on sustained pool utilization (e.g., >80% for 5+ minutes), not just on outright exhaustion.
Frequently Asked Questions
1) What does "PostgreSQL connection pool exhausted" mean?
It means every connection in the application-side pool is checked out and in use, so a new request has to wait. If no connection is returned before the wait timeout, the request fails even though the PostgreSQL server itself may be idle and healthy.
2) Why is this worse in Kubernetes than on a VM?
Every pod runs its own independent pool. Scaling from 10 pods to 40 during a traffic spike or an HPA event multiplies total connection demand by 4x in the time it takes new pods to become ready, often faster than anyone can react.
3) Should I raise max_connections or add PgBouncer?
Add a pooler first. Each PostgreSQL connection reserves backend memory (roughly 5–10MB depending on work_mem and extensions) whether or not it's doing work, so raising max_connections into the thousands can starve the server of memory before it ever helps with concurrency.
4) How do I find a connection leak in my application code?
Correlate pg_stat_activity idle-in-transaction duration against your APM traces for the same time window. A connection that's been idle for minutes with no corresponding active trace almost always means a code path exited without releasing it.
5) Can HPA scaling alone exhaust a PostgreSQL database?
Yes. If maxReplicas times pool-size-per-pod exceeds max_connections, a full scale-out event will hit the ceiling and the newest pods will fail readiness checks with connection errors, sometimes triggering a restart loop.
#1 Solution for Logs, Traces & Metrics
 APM
APM
Kubernetes
Logs
Synthetics
RUM
Serverless
Security
More