Deep Dive into Time-Series Monitoring: Prometheus vs. Graphite
In the most distinct term, time-series monitoring is all about you analyzing a data or a process over a certain period of time. This period of time can vary according to our needs. We can set the monitoring to provide results every day, every week or even once in a month.
Time-series monitoring works like logging, where all the activities your system goes through, are logged and stored in a file.
Noting the error at one point in time will not give us much information about where it had all started going wrong. Consistent data monitoring over time is essential to run any successful apps, products, or processes.
This gives us the leverage to find out what process faulted, where it faulted first, and what other processes got affected because of it.
In this blog, we will learn why having a proper maintenance strategy helps us a long way in having a healthy system or application. With analysis, we can find patterns and trends stemming from real-time data.
We can focus our attention to those areas that show anomalies, and provide tailored solutions.
Table Of Contents:-
- What are Time-series Metrics?
- Where is Time-series data used the most?
- Time-series Monitoring
- Prometheus vs Graphite Comparison
- Popular applications using Prometheus and Graphite
- Atatus Monitoring
What are Time-series Metrics?
Time-series metrics are measurements used to analyze and evaluate organized and recorded data over time.
They are specifically designed to capture and analyze patterns, trends, and behavior that emerge in sequential data. Time-series data is typically collected at regular intervals, such as daily, hourly, or even more granular time units.
Where is Time-series data used the most?
Time-series data is used in various domains and industries due to its ability to capture and analyze data over time. Here are some areas where time-series data is commonly used:
- Finance: Time-series data is extensively used in finance for analyzing stock prices, currency exchange rates, trading volumes, economic indicators, and financial market trends. It helps in making investment decisions, risk assessment, portfolio management, and algorithmic trading.
- Internet of Things (IoT): IoT devices generate vast amounts of time-series data, such as sensor readings, temperature, humidity, energy consumption, and device status. Time-series analysis enables monitoring, anomaly detection, predictive maintenance, and optimization of IoT systems.
- Energy and Utilities: Time-series data is crucial in the energy sector for monitoring and optimizing power generation, consumption patterns, renewable energy sources, demand forecasting, grid stability, and load balancing.
- Manufacturing Industry: Time-series data is used to monitor and optimize manufacturing processes, equipment performance, quality control, supply chain management, predictive maintenance, and resource utilization. It helps identify inefficiencies, improve productivity, and reduce downtime.
- Telecommunications: Time-series data plays a significant role in analyzing network traffic, call volumes, user behavior, service availability, and network performance. It helps in capacity planning, detecting anomalies, optimizing network infrastructure, and improving customer experience.
- Health and Medicine: Time-series data is utilized in healthcare for monitoring patient vital signs, electrocardiograms (ECG), blood glucose levels, sleep patterns, medication adherence, and disease progression. It enables early detection of abnormalities, remote patient monitoring, and personalized treatment plans.
- Environmental Monitoring: Time-series data is essential for studying and monitoring environmental factors like weather patterns, air quality, water levels, temperature changes, and ecological indicators. It aids in climate research, natural disaster prediction, resource management, and conservation efforts.
- Transportation and Logistics: Time-series data is used in transportation for analyzing traffic patterns, vehicle tracking, logistics optimization, route planning, fuel consumption, and vehicle performance. It helps improve efficiency, reduce costs, and enhance customer service.
Time-series Monitoring
Time-series monitoring is the ongoing process of observing, analyzing, and managing time-dependent data to identify patterns, anomalies, and changes over time.
It involves continuously monitoring and evaluating time-series metrics to detect any deviations or trends that may impact the performance, behavior, or health of a system or process.
In time-series monitoring, the primary objective is to track the data in real-time or near real-time, allowing for prompt detection of issues or opportunities. This proactive approach enables organizations to take timely actions, make informed decisions, and optimize processes based on observed patterns and trends.
Here are some key aspects of time-series monitoring:
- Data Collection: Time-series monitoring requires collecting and storing data at regular intervals. This can be done through automated data acquisition systems or by integrating with various data sources such as sensors, logs, databases, or APIs.
- Visualization: Time-series data is often visualized using line charts, area charts, or other graphical representations. Visualization tools and dashboards provide a clear and intuitive way to observe the data and identify patterns, anomalies, or changes over time.
- Alerting and Anomaly Detection: Monitoring systems often employ alerting mechanisms to notify stakeholders when certain thresholds or conditions are breached. Anomaly detection techniques, such as statistical methods or machine learning algorithms, can be applied to identify unusual patterns or outliers in the time-series data.
- Performance Metrics: Time-series monitoring involves tracking and analyzing performance metrics specific to the system or process being monitored. These metrics could include response times, throughput, error rates, utilization, or any other relevant indicators.
- Trend Analysis: Monitoring time-series data helps identify long-term trends and patterns. By analyzing historical data and observing the direction and magnitude of changes over time, organizations can gain insights into the behavior of the system and make informed decisions for optimization or planning.
- Capacity Planning: Time-series monitoring plays a crucial role in capacity planning by analyzing historical data and predicting future demand. By understanding trends and patterns, organizations can estimate resource requirements, identify potential bottlenecks, and ensure sufficient capacity to meet future needs.
- Continuous Improvement: Time-series monitoring provides valuable feedback on the performance of a system or process. By analyzing and acting upon the insights gained from monitoring, organizations can continuously improve their operations, optimize resource allocation, and enhance overall efficiency.
Prometheus vs Graphite Comparison
Prometheus and Graphite are both popular monitoring tools used for collecting and analyzing time-series data. While they have some similarities, they also have distinct features and capabilities. Here's a comparison of the monitoring capabilities of Prometheus and Graphite:
#1 Data Model
Prometheus uses a flexible multidimensional data model, allowing users to define and label their metrics. This model enables powerful querying and filtering capabilities. While Graphite uses a hierarchical data model based on dotted paths (e.g., server1.cpu.usage). It does not have built-in support for labels or dimensions like Prometheus.
#2 Collecting Metrics
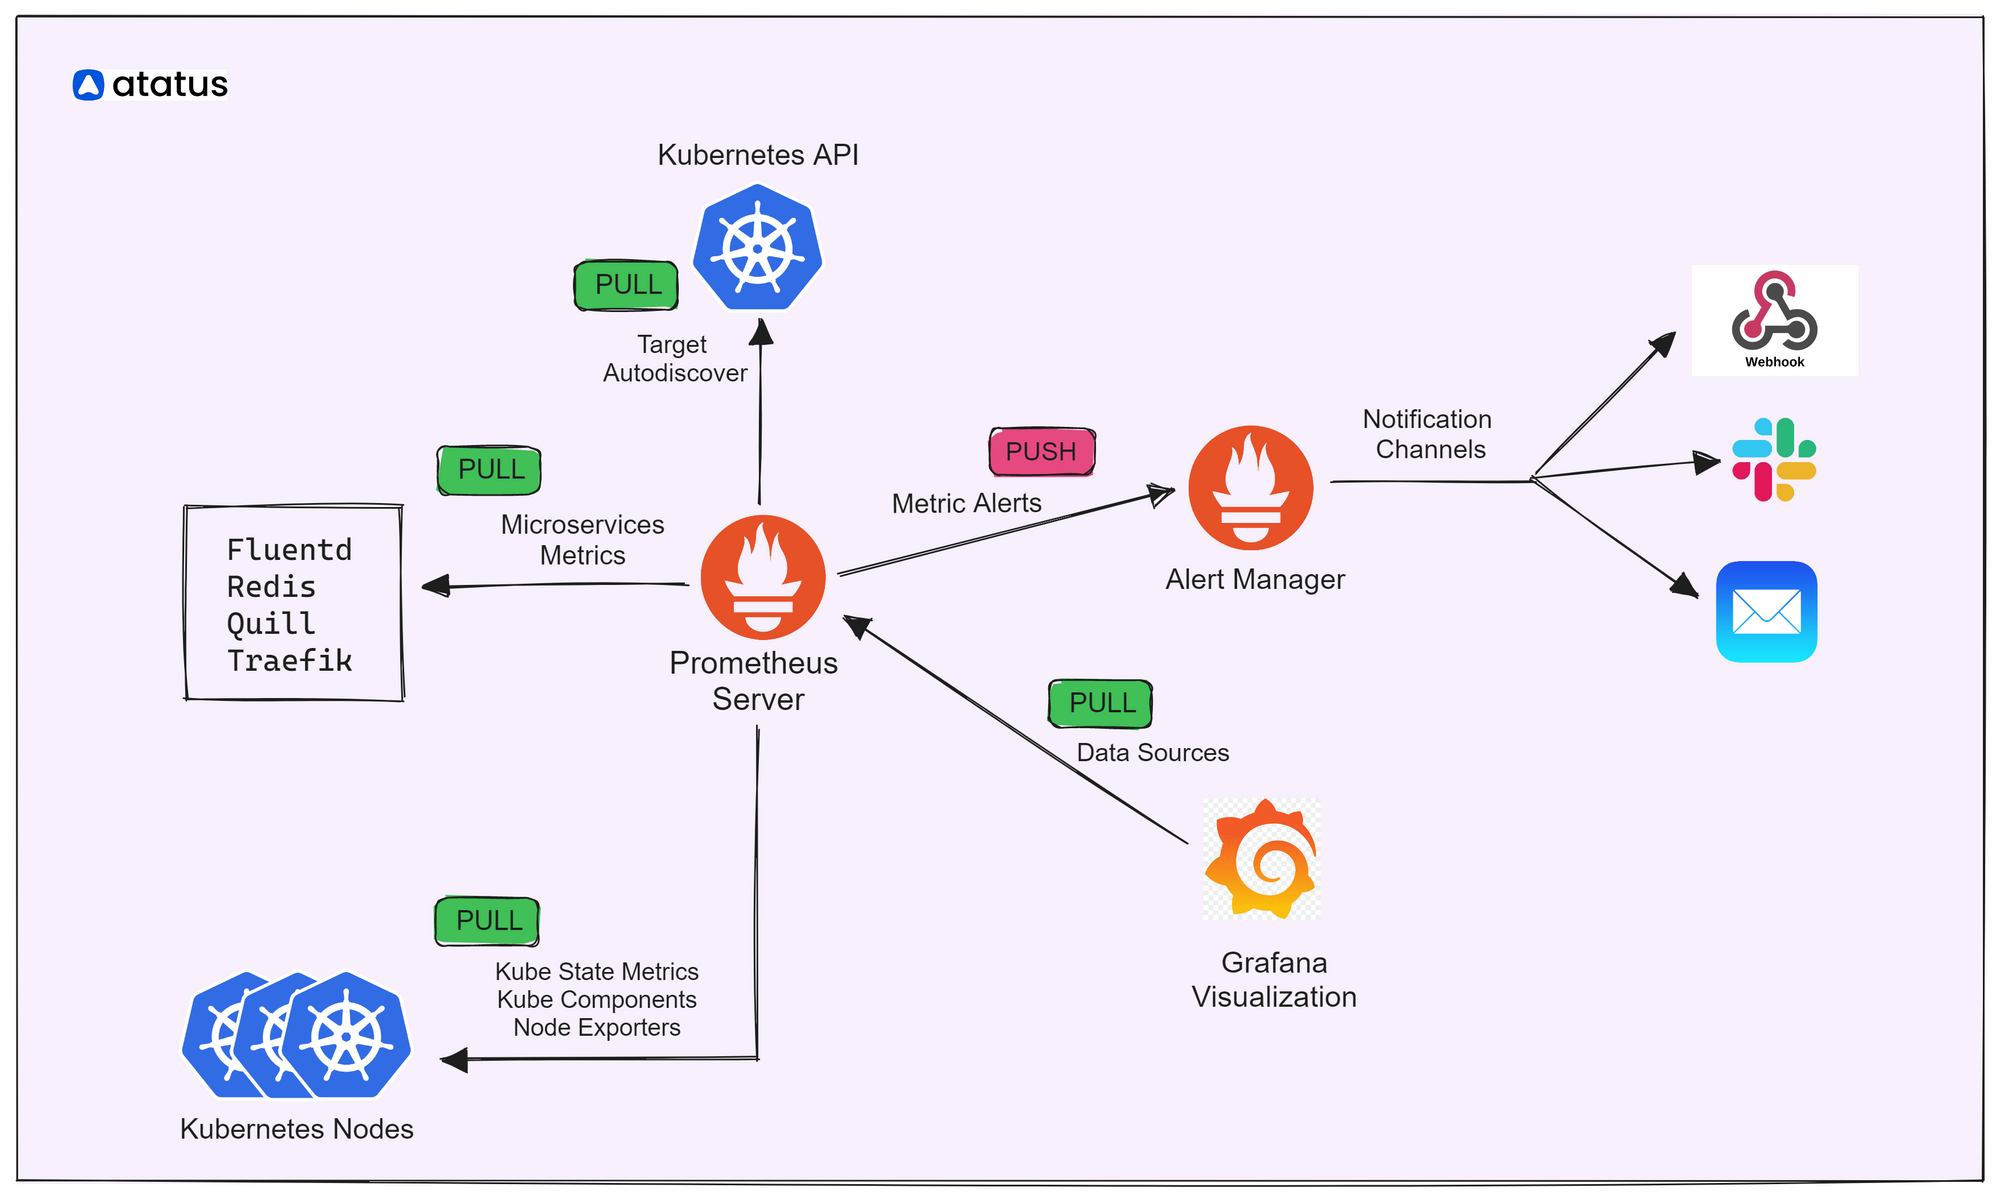
Prometheus employs a pull-based model where it actively collects metrics from monitored targets. It has built-in support for various exporters, making it easy to gather metrics from different systems and services. Graphite primarily relies on a push-based model, where applications or systems push metrics data to the Graphite server using protocols like StatsD or Carbon.
#3 Alerting
Prometheus has a robust alerting system that supports defining alert rules based on the collected metrics. It can trigger alerts and send notifications via various channels when specific conditions are met, while Graphite does not have built-in alerting capabilities. To set up alerts, users often rely on external tools like Grafana, which can query Graphite and provide alerting functionalities.
#4 Querying and Visualization
Prometheus provides a powerful PromQL (Prometheus Query Language) for querying and analyzing time-series data. It also offers a built-in expression browser and a basic graphing interface for visualization. Graphite uses its own query language called Graphite Query Language (GQL) for data retrieval and manipulation. It provides basic graphing capabilities but is often complemented by tools like Grafana for advanced visualizations.
#5 Service Discovery
Prometheus supports service discovery mechanisms, such as DNS, Kubernetes, and Consul. This makes it easier to dynamically discover and monitor new instances of services as they come and go. Graphite allows users to define retention policies for data storage, specifying how long to retain raw data and how to aggregate older data for long-term storage. This provides flexibility in managing storage requirements.
#6 Integrations
Prometheus integrates well with other tools in the cloud-native ecosystem, including Grafana for advanced visualization, Kubernetes for monitoring containerized environments, and various alerting and notification systems. Meanwhile, Graphite integrates well with Grafana, which is commonly used for data visualization and alerting. Grafana can connect to Graphite as a data source and provide rich visualization options.
Apart from these two, there are other great monitoring tools available. For example, Atatus is a reliable option when it comes to managing applications. They provide a complete application monitoring package(APM) apart from RUM, logs, etc.
Popular Applications using Prometheus and Graphite
Applications using Prometheus:
- Kubernetes: Prometheus is commonly used for monitoring and observability in Kubernetes clusters. It integrates with Kubernetes via the Prometheus Operator, enabling comprehensive monitoring of containerized environments.
- Cortex: Cortex is a horizontally scalable, multi-tenant Prometheus implementation. It enables storing and querying Prometheus data across a distributed system, making it suitable for large-scale deployments and high cardinality workloads.
To learn how to adopt Prometheus on Kubernetes, access this blog.
Applications using Graphite:
- Pinterest: Pinterest, a popular social media platform, has been known to use Graphite for monitoring and metrics collection. It tracks various metrics related to user activity, system performance, and application behavior.
- Airbnb: Airbnb, the online marketplace for accommodations, has reportedly used Graphite for monitoring and analyzing metrics related to their distributed systems, application performance, and user experience.
- Shopify: Shopify, the e-commerce platform, has employed Graphite for monitoring and tracking metrics across their infrastructure. It helps monitor the performance of their online stores, track user behavior, and analyze system health.
Atatus Monitoring
Atatus provides time-series monitoring capabilities as part of its comprehensive application monitoring and performance management platform.
The platform includes features that enable tracking, analyzing, and visualizing time-series data for various metrics related to application performance, errors, user interactions, and more. Here's how Atatus supports time-series monitoring:
- Performance Metrics: Atatus collects and stores time-series data for performance metrics such as response times, throughput, CPU usage, memory consumption, network latency, and other application-specific metrics. These metrics are recorded at regular intervals to provide a historical view of performance over time.
- Custom Metrics: In addition to predefined performance metrics, Atatus allows you to define and track custom metrics specific to your application. You can instrument your code or use the provided SDKs to capture and report custom metrics relevant to your application's performance and behavior.
- Real User Monitoring (RUM): Atatus captures time-series data for user interactions and behavior on your web and mobile applications. It tracks and measures metrics such as page load times, JavaScript execution times, user actions, and other user experience-related data. This data provides a time-series view of how users are interacting with your application.
- Error Tracking: Atatus records time-series data for errors and exceptions that occur within your application. It tracks metrics such as error frequency, occurrence trends over time, and error rates for different parts of your application. This data helps in understanding the impact and behavior of errors over time.
- Alerting: Atatus allows you to set up alerts based on specific time-series metrics. You can define thresholds or conditions for metrics like response times, error rates, or any other performance-related metrics. When the metrics breach the defined thresholds, Atatus can trigger alerts to notify you of potential issues or performance degradation.
Summary
In summary, Prometheus offers a powerful data model, built-in alerting, and advanced querying capabilities. It is well-suited for dynamic environments and provides comprehensive monitoring features out of the box.
On the other hand, Graphite focuses on simplicity and flexibility, with a push-based data model and integration options with tools like Grafana for visualization and alerting. It may be a good choice for organizations with specific requirements or existing Graphite deployments.
As always, your needs are the most important. If you’re looking for short-term data retention but a single platform for managing everything related to data, you should consider Prometheus, but if you only need storage and graphing, then you should go for Graphite.
Monitor Your Entire Application with Atatus
Atatus is a Full Stack Observability Platform that lets you review problems as if they happened in your application. Instead of guessing why errors happen or asking users for screenshots and log dumps, Atatus lets you replay the session to quickly understand what went wrong.
We offer Application Performance Monitoring, Real User Monitoring, Server Monitoring, Logs Monitoring, Synthetic Monitoring, Uptime Monitoring and API Analytics. It works perfectly with any application, regardless of framework, and has plugins.

Atatus can be beneficial to your business, which provides a comprehensive view of your application, including how it works, where performance bottlenecks exist, which users are most impacted, and which errors break your code for your frontend, backend, and infrastructure.
If you are not yet a Atatus customer, you can sign up for a 14-day free trial .
#1 Solution for Logs, Traces & Metrics
![]() APM
APM
![]() Kubernetes
Kubernetes
![]() Logs
Logs
![]() Synthetics
Synthetics
![]() RUM
RUM
![]() Serverless
Serverless
![]() Security
Security
![]() More
More


![New Relic vs Splunk - In-depth Comparison [2026]](/blog/content/images/size/w960/2024/10/Datadog-vs-sentry--19-.png)
![New Relic vs Sentry - Which Monitoring Tool to Choose? [2026]](/blog/content/images/size/w960/2024/10/VS--1-.png)