What are Spans in Distributed Tracing?
In modern software development, distributed systems have become increasingly common. As systems grow more complex and distributed, it can be challenging to understand how requests or messages move through the system and where bottlenecks may occur. This is where distributed tracing comes in.
Distributed tracing is a technique that allows developers and operators to monitor and understand the behavior of complex systems. At the heart of this technique are "spans", which provide a way to track workflow across multiple services and components.
The goal of distributed tracing is to provide visibility into the flow of work as it moves through the system, allowing developers and operators to identify bottlenecks, optimize performance, and diagnose errors and other issues.
In a distributed tracing system, each unit of work (such as a request or a message) is represented by a "span", which includes information about the work being performed, such as the service and method being called, any parameters or headers, and the start and end times of the work. Spans are then aggregated to form a "trace," representing the complete work flow through the system.
Before we delve into spans, let's take a moment to understand the basics of Distributed Systems, grasping their essence and gaining a clear understanding of how they work.
Table of Contents
- What are Spans in Distributed System?
- Parent Span and Child Span
- Span Composition
- Difference between Spans and Traces
- Advantages of Span in Distributed Systems
What are Spans in Distributed System?
In a distributed system, a "span" refers to a unit of work that occurs between two points in the system. It typically involves the processing of a request or a message and may include multiple steps, such as network communication, database queries, or other computations.
Each span is associated with a unique identifier, which is used to track the flow of work across the system. Spans are often used in distributed tracing, a technique for monitoring and understanding the behaviour of complex systems.
Distributed tracing tools can aggregate information from multiple spans to provide insights into the performance and behaviour of the system as a whole. For example, they may be used to identify bottlenecks or areas of high latency or to diagnose errors and other issues.
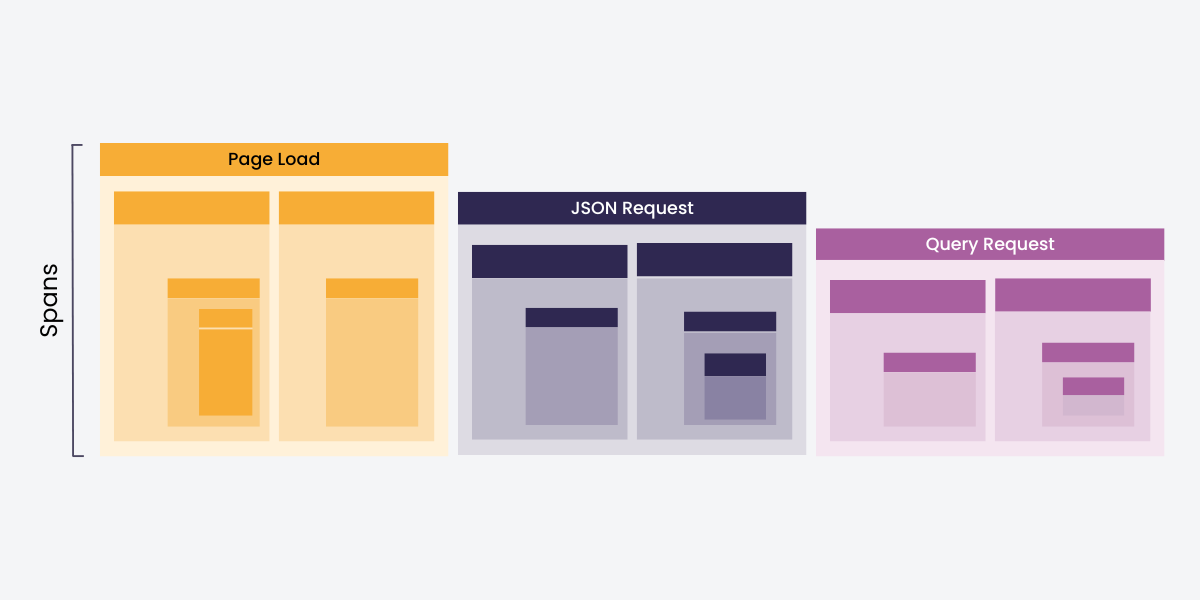
A trace is composed of many spans in a distributed tracing system, each of which represents a timed operation or workflow step. A tree-like structure that depicts the flow of work through the system is produced by the association of parent spans and the unique identifiers that each span has.
Spans include timestamps indicating when each operation began and ended, which helps users understand the timeline of events within the software. They also contain tags and contextual information about the request or operation being performed, such as metadata on HTTP methods, URLs, and status codes. This information can help identify correlations between different spans and diagnose issues or bottlenecks within the system.
Here is an example of what a span might look like in a distributed tracing diagram:
 ______________________________________________________
|                 Operation Name: Get User Info        |
|                                                      |
|         Start Time: 2023-05-04T10:00:00.000Z         |
|           End Time: 2023-05-04T10:00:01.000Z         |
|         Service/Component: User Service              |
|                Status: OK                            |
|             Metadata: {                              |
|                          "user_id": "123456",        |
|                          "user_agent": "Chrome"      |
|                      }                               |
|                                                      |
|   _______________________________________________    |
|  |              Logs and Events:                 |   |
|  |                                               |   |
|  | 2023-05-04T10:00:00.500Z: User info retrieved |   |
|  | 2023-05-04T10:00:01.000Z: Request completed   |   |
|  |                                               |   |
|  |_______________________________________________|   |
|                                                      |
|                Parent Span ID: 1234567               |
|                Child Span ID: 2345678                |
|______________________________________________________|
In this example, the span represents an operation in the User Service that retrieves user information. It includes the operation name, start and end time, service or component, status, metadata, and logs or events. It also includes references to a parent span and a child span, which indicate the relationship between this operation and others in the distributed transaction.
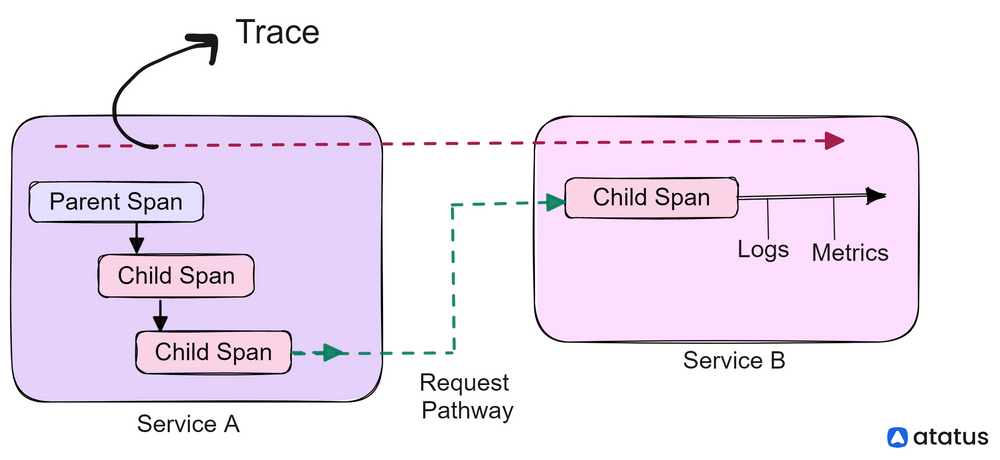
Parent Span and Child Span
In distributed tracing, a parent span is a span that immediately precedes and contains one or more child spans. Parent spans and child spans are used to represent the flow of work through a distributed system.
When a request or operation is initiated in a distributed system, it typically generates a new span. This span becomes the parent span for any subsequent spans that are generated as part of the same operation or request. Each child span represents a specific step or operation within the parent span.
For example, in a distributed system that handles online shopping orders, the parent span could represent the entire order process, while child spans could represent individual steps within the process, such as adding items to the cart, entering shipping information, and processing payment.
Each child span would be associated with the parent span and would contain information about the specific step it represents, including any relevant metadata such as HTTP status codes and database queries.
Parent spans and child spans work together to provide a complete view of the flow of work through a distributed system. By understanding the relationships between spans, developers and operators can gain insights into the behaviour of the system, identify bottlenecks and errors, and optimize performance.
Span Composition
The function and specifics of the logical work carried out in a system are comprised of distinct descriptors found in each span. Distributed tracing typical span consists of the following:
1. Span Tags
In distributed tracing, span tags are key-value pairs that provide additional context and metadata about a particular span. Span tags are used to provide insights into the behaviour of the system and can be used to identify and diagnose issues, optimize performance, and track important metrics.
Span tags can include information such as:
- HTTP method: The HTTP method used in the request, such as GET or POST.
- URL: The URL or path associated with the request.
- Status code: The HTTP status code returned by the server, such as 200 or 404.
- Database: Information about any database queries associated with the span, including the type of query and any parameters.
- Service name: The name of the service associated with the span.
- User ID: The ID of the user associated with the span.
- Error message: Any error messages associated with the span.
- Message Queue: Used to describe messaging systems within the context of distributed tracing.
Span tags are typically added to a span when it is created and can be used to filter and search spans in a tracing system.
2. Span Logs
In distributed tracing, users can record messages in span logs that are specific to a particular span, as well as any other relevant data provided by the application. These span logs are consulted by users to accurately document the timing and events that occur within a trace.
Unlike tags, which apply to the entire span, span logs are like a "snapshot" of the trace, capturing the specific details of each span.
Span logs can include events such as:
- Messages: Informational messages that provide additional context about what is happening during the span's execution.
- Warnings: Warnings that indicate potential issues or errors that may require attention.
- Errors: Errors that occur during the span's execution.
- Debug information: Information that is useful for debugging purposes, such as the values of variables or the results of function calls.
3. Span Context
Data is transported across numerous points and boundaries in a process using the SpanContext. An implementation-specific field that provides context for the associated span instance and user-level baggage are the two main parts of a SpanContext, according to logic.
Baggage items are essentially key:value pairs that cross process boundaries in distributed systems. Users may get useful data from any instance of a baggage item at any time during a trace. To simplify troubleshooting and debugging procedures, developers can quickly resort to the SpanContext for contextual metrics (such as service calls and duration).
Span context typically includes information such as:
- Trace ID: A unique identifier that is assigned to a trace, which represents a complete workflow or request.
- Span ID: A unique identifier that is assigned to each span within a trace.
- Parent span ID: The ID of the span that directly precedes the current span in the trace.
- Baggage: Additional metadata that is associated with the span and is propagated to child spans.
Span context allows tracing systems to correlate spans across multiple services and machines in a distributed system. By propagating span context, tracing systems can provide a complete view of the flow of work or requests through the system, even when that work or those requests span multiple services and machines.
We have compiled a list of top distributed tracing tools, which offer a range of features to cater to your specific needs. Take the time to familiarize yourself with their capabilities and select the tool that best aligns with your requirements.
Difference between Spans and Traces
In distributed tracing, spans and traces are both used to represent the flow of work or requests through a system. However, there are some key differences between spans and traces.
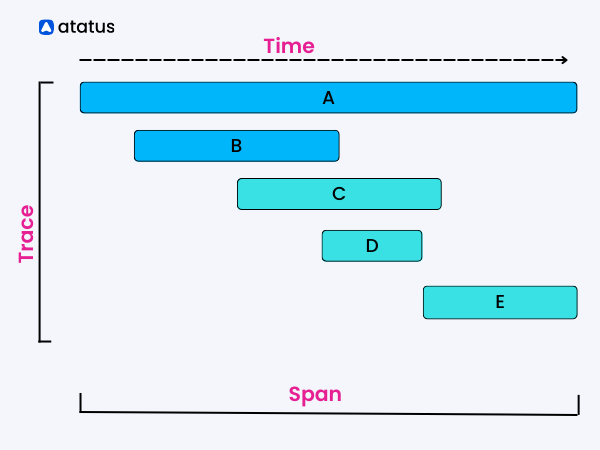
A span represents a timed operation within a trace. Each span has a start time and an end time and can include metadata such as tags and logs. Spans are used to represent the individual operations that make up a trace and can be correlated across services and machines using span context.
A trace, on the other hand, represents the complete flow of work or requests through a system. A trace is composed of multiple spans, each of which represents an individual operation within the trace. Traces provide a complete view of the flow of work or requests through the system and can be used to identify bottlenecks, diagnose issues, and optimize performance.
The data of a user service request is captured by traces, which also include custom characteristics, timelines of individual events, and spans (i.e., marked time intervals) that include comprehensive metadata of logical operations. As a result, a span denotes a single request inside an execution path, but a trace denotes the execution path within a distributed system.
In other words, a span is a unit of work within a trace, while a trace represents the complete flow of work or requests through the system.
To illustrate this, let's consider an example of a web application that is composed of multiple services. A trace for a user request might include multiple spans, such as a span for the initial HTTP request to the front-end service, a span for a database query in the back-end service, and a span for a cache lookup in another service.
By analyzing the spans and their relationship to each other within the trace, developers and operators can gain insights into the behaviour of the system and identify potential issues.
Advantages of Span in Distributed Systems
Spans are an important component of distributed tracing and offer several advantages:
- Granularity: Spans provide a high level of granularity, allowing developers and operators to track the performance and behaviour of individual operations within a system. By tracking individual operations, they can identify bottlenecks and optimize performance.
- Correlation: Spans can be correlated across services and machines using span context. This allows developers and operators to gain a complete view of the flow of work or requests through the system, even when that work or those requests span multiple services and machines.
- Contextual information: Spans can include metadata such as tags and logs, which provide additional context and information about the behaviour of the system.
- Debugging: Spans can be used for debugging purposes, allowing developers to trace the flow of code execution and identify issues in the system.
- Performance optimization: By using spans to track the performance of individual operations within a system, developers can optimize performance.
- Diagnostics: By analyzing spans and their relationship to each other within a trace, developers and operators can diagnose issues and identify the root cause of problems in the system.
Conclusion
In conclusion, understanding spans in distributed tracing is a critical component of diagnosing and troubleshooting issues in a distributed system. By breaking down complex requests into smaller, more manageable spans, developers and operations teams can gain visibility into the performance and behavior of their systems.
With the ability to visualize and analyze the entire request flow, developers can identify the exact service or component that is causing a slowdown or error. This level of granularity helps in reducing mean time to resolution (MTTR) and improves the overall stability and reliability of the system.
Additionally, utilizing consistent naming conventions and standardized attributes can help to simplify tracing and make it more meaningful across different services and teams. With the increasing complexity of modern applications, having a solid understanding of spans and distributed tracing is becoming more important than ever.
Monitor Your Entire Application with Atatus
Atatus is a Full Stack Observability Platform that lets you review problems as if they happened in your application. Instead of guessing why errors happen or asking users for screenshots and log dumps, Atatus lets you replay the session to quickly understand what went wrong.
We offer Application Performance Monitoring, Real User Monitoring, Server Monitoring, Logs Monitoring, Synthetic Monitoring, Uptime Monitoring, and API Analytics. It works perfectly with any application, regardless of framework, and has plugins.

Atatus can be beneficial to your business, which provides a comprehensive view of your application, including how it works, where performance bottlenecks exist, which users are most impacted, and which errors break your code for your frontend, backend, and infrastructure.
If you are not yet an Atatus customer, you can sign up for a 14-day free trial.
#1 Solution for Logs, Traces & Metrics
![]() APM
APM
![]() Kubernetes
Kubernetes
![]() Logs
Logs
![]() Synthetics
Synthetics
![]() RUM
RUM
![]() Serverless
Serverless
![]() Security
Security
![]() More
More