Top 6 Kubernetes Monitoring Tools
Kubernetes has become the de facto standard for container orchestration, enabling organizations to deploy, scale, and manage containerized applications with ease. However, ensuring the reliability, performance, and security of applications running in a Kubernetes environment requires robust monitoring and observability solutions.
To meet this need, numerous Kubernetes monitoring tools have emerged, each offering unique features and capabilities to help operators and developers gain insights into their clusters and workloads.
The top 6 Kubernetes monitoring tools discussed in this article are not listed in any particular order, as their suitability depends on specific use cases and requirements. Each tool comes with its own set of features and integrations, enabling users to choose the one that best aligns with their monitoring and observability needs.
In this blog, we shall explore the fundamentals of Kubernetes monitoring tools and delve briefly into a selection of these essential instruments.
Table of Contents
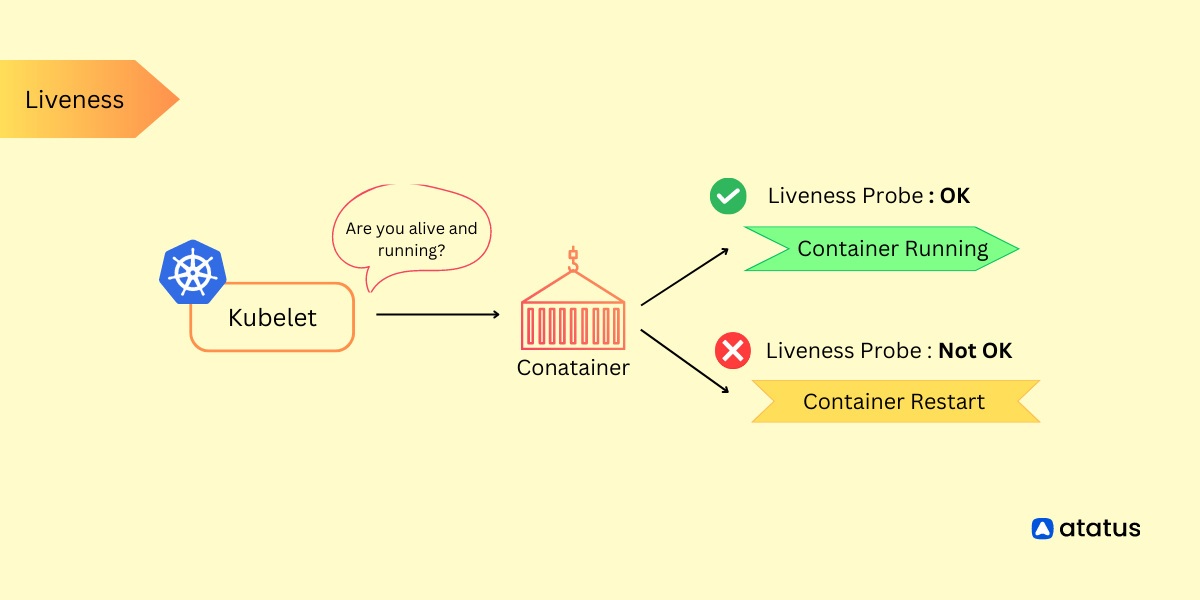
In a Kubernetes environment, vigilantly monitoring your system is absolutely crucial. Why? Because Kubernetes manages lots of containers across different machines, and you need to know how they are doing. Monitoring helps you see what's going on in real-time. It is like having a watchful eye over your containers. If something goes wrong, monitoring will tell you so you can fix it quickly and avoid any interruptions.
It is also helpful to make sure that you are using your resources wisely and not wasting them. And it keeps everything safe and follows the rules by spotting any security issues and making sure you are not breaking any regulations. Thus Kubernetes monitoring serves as a protector for your containerized applications within the Kubernetes framework.
1. Atatus
Atatus is a powerful and versatile monitoring tool designed to provide comprehensive insights into the performance and health of your applications and infrastructure. Whether you're running applications on traditional servers, in the cloud, or within containerized environments like Kubernetes, Atatus offers a unified solution to monitor, troubleshoot, and optimize your entire technology stack.
Atatus excels in application performance monitoring (APM), tracking the responsiveness and efficiency of your applications, and offering detailed insights into errors, bottlenecks, and transaction traces.
Its real-time monitoring capabilities enable you to proactively address issues, reducing downtime and improving user experience. The platform seamlessly integrates with a wide range of programming languages, frameworks, and third-party services, making it an ideal choice for modern, complex application environments.
With Atatus, you can set up custom alerts, automate incident response, and gain visibility into your infrastructure's resource utilization, helping you make data-driven decisions. This tool is a valuable asset for DevOps teams and developers, allowing them to ensure application reliability, optimize resource allocation, and streamline the entire development lifecycle.
Key features:
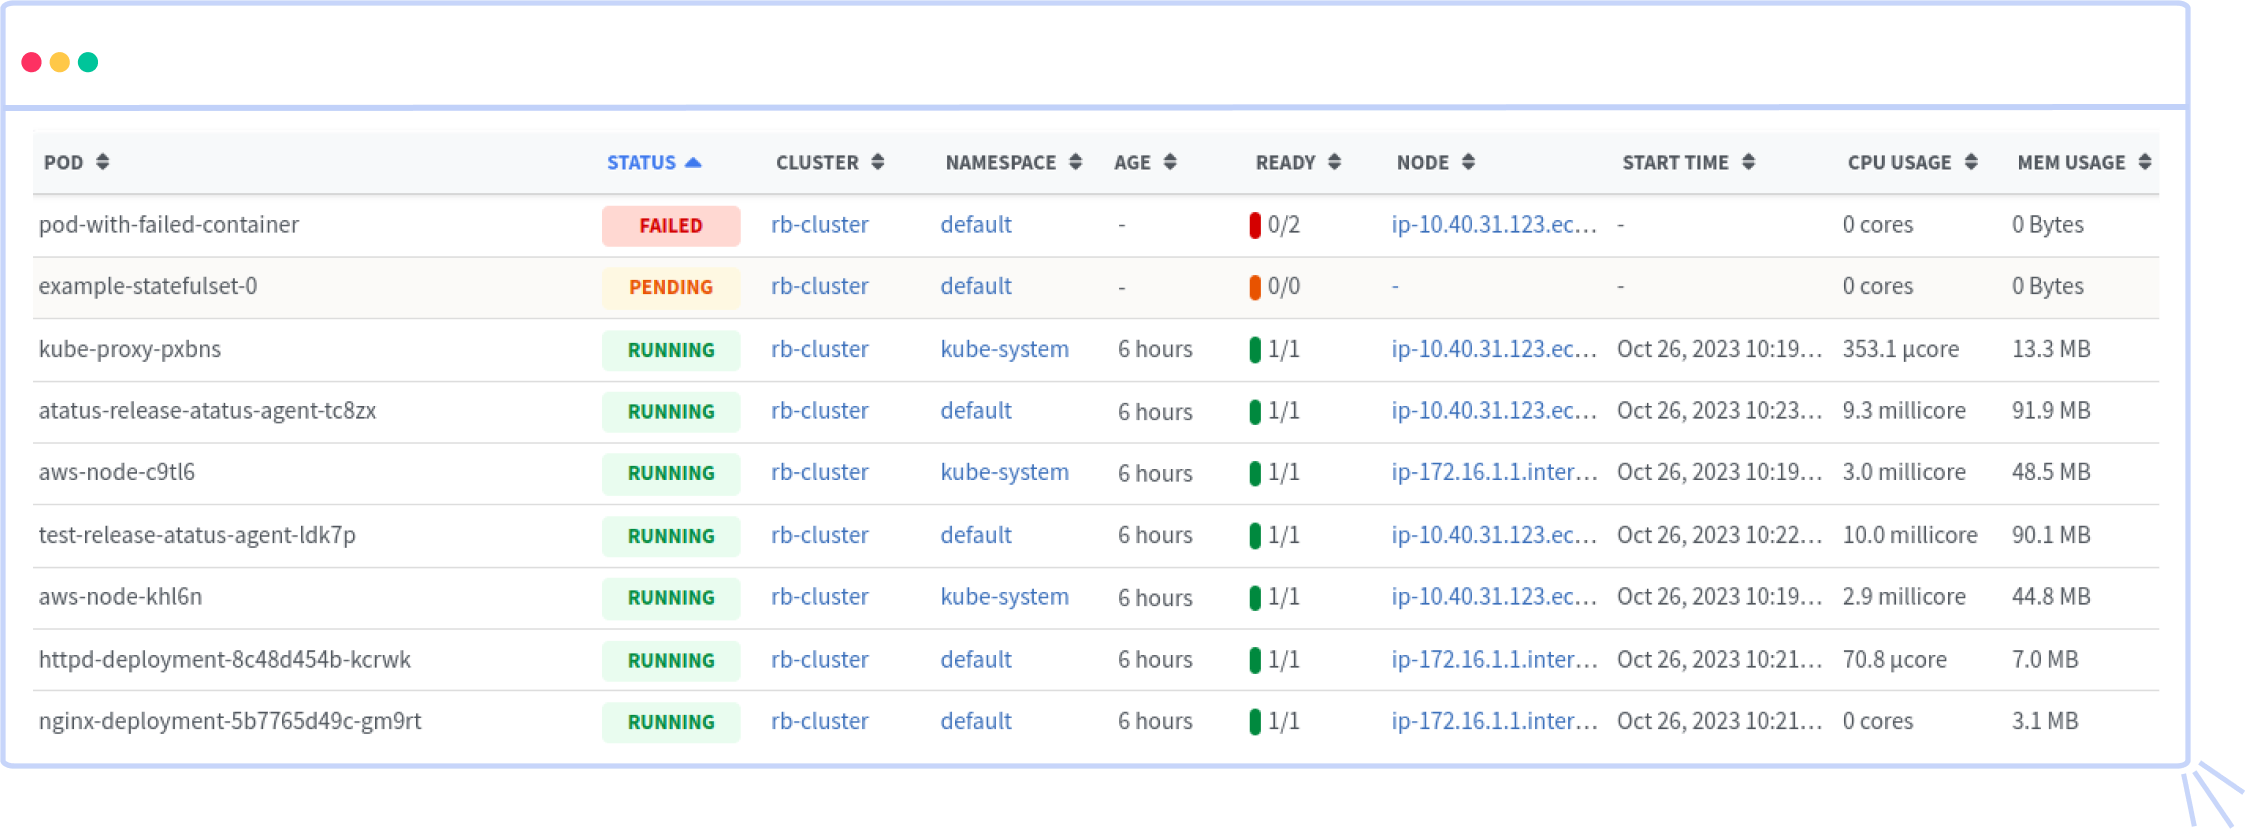
- Kubernetes Cluster Monitoring: Offers comprehensive monitoring for your Kubernetes cluster, tracking CPU, memory, and network usage, as well as node performance.
- Container Monitoring: Provides detailed metrics for individual containers, including CPU, memory, and network performance.
- Pod Monitoring: Monitor application performance at the pod level with insights into resource usage, errors, and latency.
- Application Performance Monitoring (APM): Integrate Atatus's APM solution with Kubernetes for deep insights into application code, real-time performance data, and transaction tracing.
- Alerting and Notification: Set up custom alerts in Atatus to be notified of issues, with notifications through email, Slack, and more.
- Log Management: Aggregates and analyzes Kubernetes applications and infrastructure logs for troubleshooting and correlation with performance metrics.
- Distributed Tracing: Supports tracing to identify performance bottlenecks in microservices by tracing requests as they move through the architecture.
- Kubernetes Cluster Explorer: The Cluster Explorer visually represents your Kubernetes cluster's components and their impact on performance.
- Integration and Extensibility: Atatus offers various integrations and APIs for collecting data from diverse sources, making it highly adaptable to your use cases.
2. Sematext
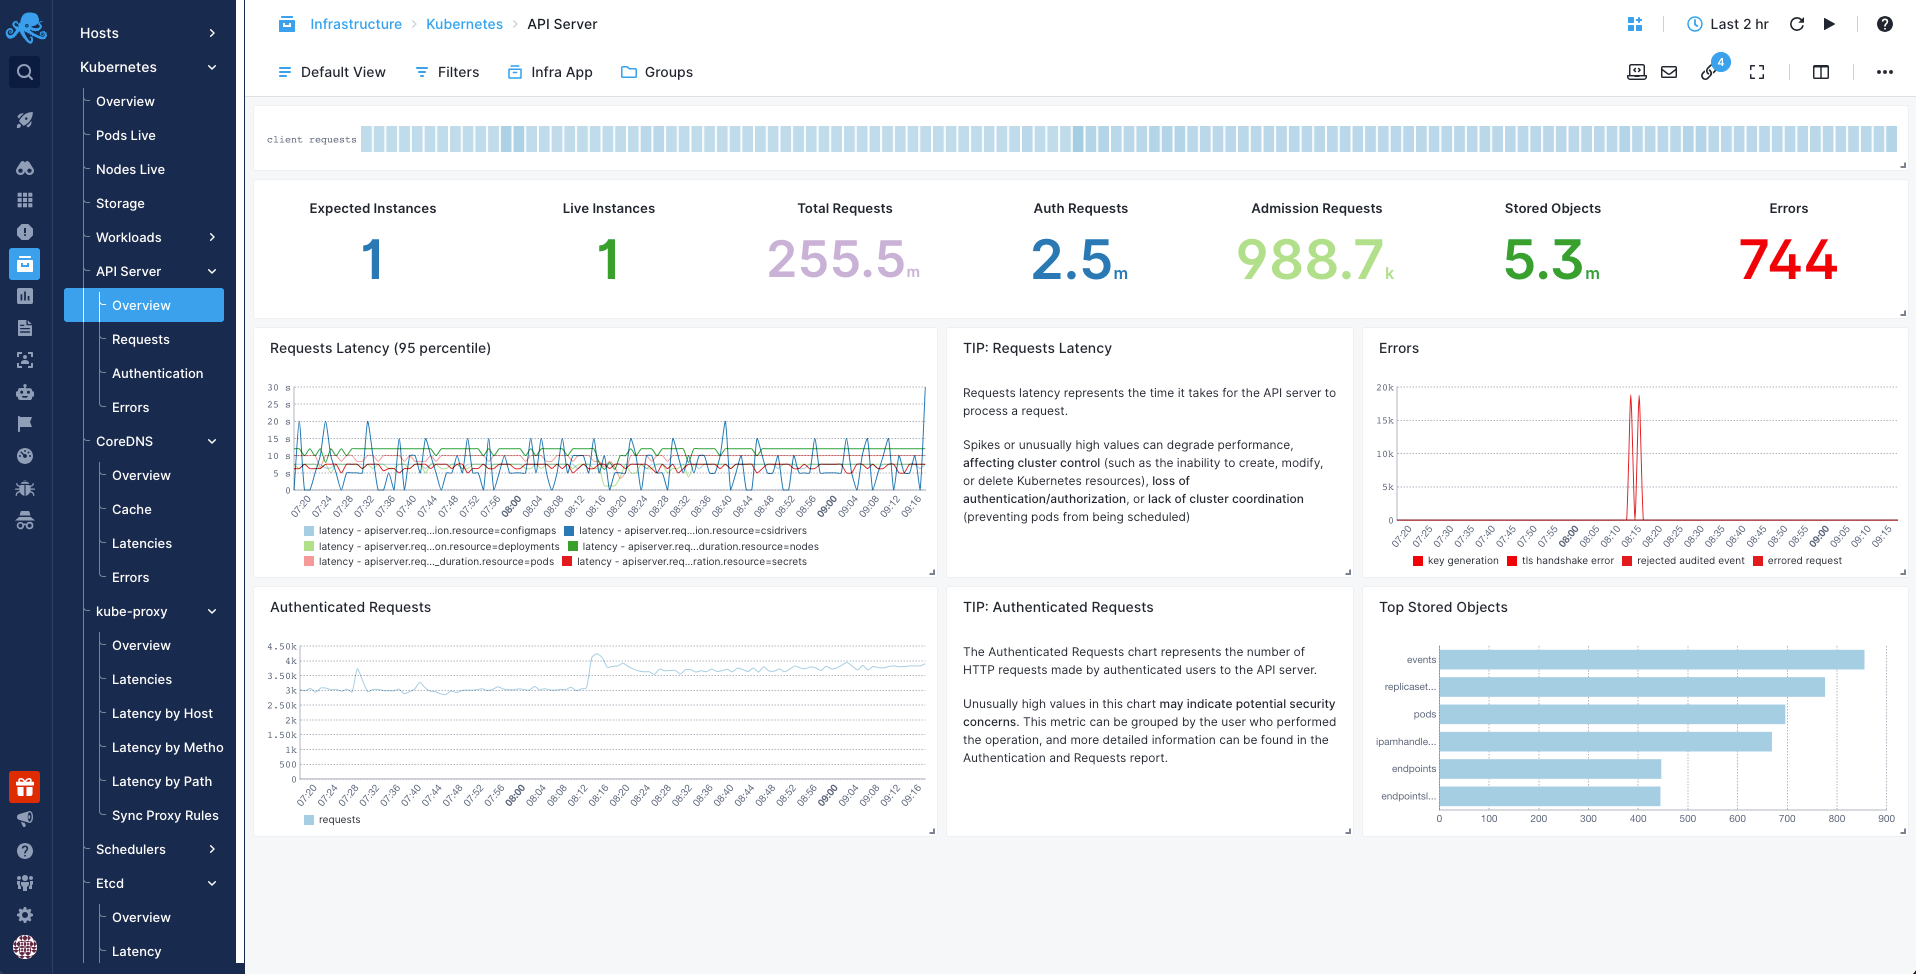
Sematext Kubernetes Monitoring tool offers comprehensive observability for your cluster's control plane. This means it provides real-time monitoring for various operational metrics of different components, including both the Kubernetes Control Plane and Node components.
By having this in-depth visibility into the control plane, DevOps teams can proactively detect issues and troubleshoot them. This proactive approach reduces the mean time to resolution and, as a result, enhances the overall uptime of your Kubernetes cluster.
Sematext Monitoring's pricing begins at $3.6 per host per month. It's worth noting that there are no obligations for long-term commitments, and the pricing is determined by actual usage. To ensure complete transparency and prevent unexpected costs, Sematext displays monthly cost estimates for the ongoing month during the free trial period. For the most up-to-date information, please visit the official website.
Key features:
- Rapid Issue Detection: Detect Kubernetes performance problems swiftly
- Real-Time Insights: Gain real-time visibility into Kubernetes metrics
- Effortless Troubleshooting: Simplify issue resolution through enhanced log data
- Efficiency with Dashboards: Benefit from pre-designed monitoring dashboards
- Timely Notifications: Keep your DevOps team informed about critical events
- Instant System Monitoring: Start monitoring your system within seconds
3. Grafana
Grafana Kubernetes Monitoring is a powerful tool for managing and optimizing your Kubernetes infrastructure. It offers a comprehensive solution to monitor your Kubernetes clusters, providing real-time insights and predictive analytics to ensure efficient resource allocation and optimal application performance. With Grafana's user-friendly interface, preconfigured dashboards, and an array of graph types, users can easily explore and visualize their data, making it an invaluable asset for both beginners and experienced users in the Kubernetes ecosystem.
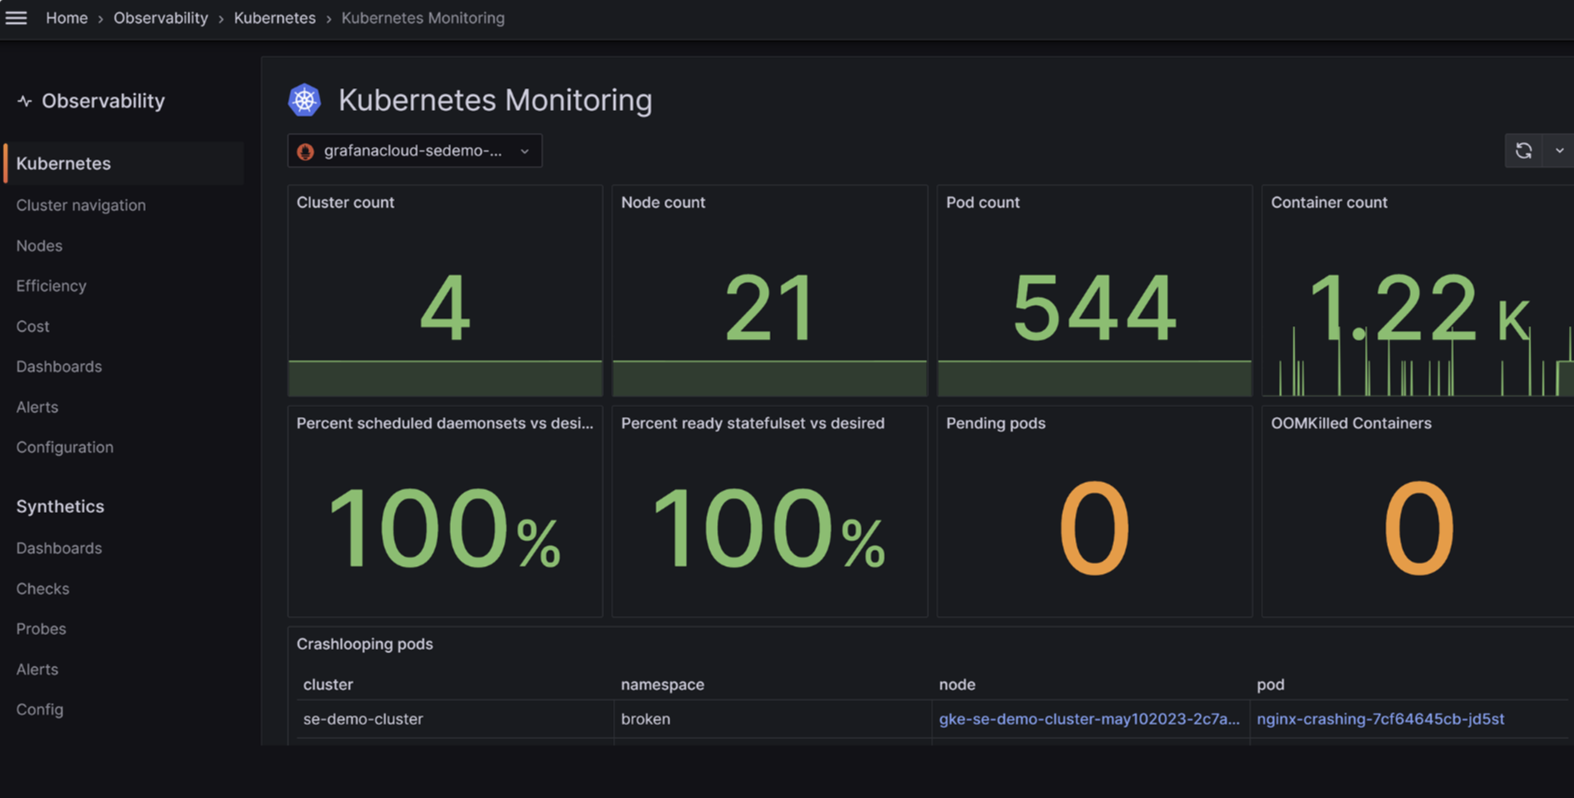
Additionally, Grafana's built-in alerting system, data-source compatibility, and robust authentication and authorization features enhance its utility. It plays a pivotal role in simplifying the complex task of monitoring Kubernetes environments, making it a preferred choice in the Kubernetes community for its reliability and flexibility.
Key features:
- Built-in alerting system
- User-friendly rich interface
- Robust authentication and authorization features
- Early warning of usage spikes and errors
- Versatile data visualization
4. Datadog
Datadog Kubernetes monitoring is a robust solution designed to provide real-time insights into the performance and health of Kubernetes environments. It allows users to seamlessly extract logs, metrics, events, and service states from their Kubernetes clusters, making it an essential tool for managing workloads effectively.
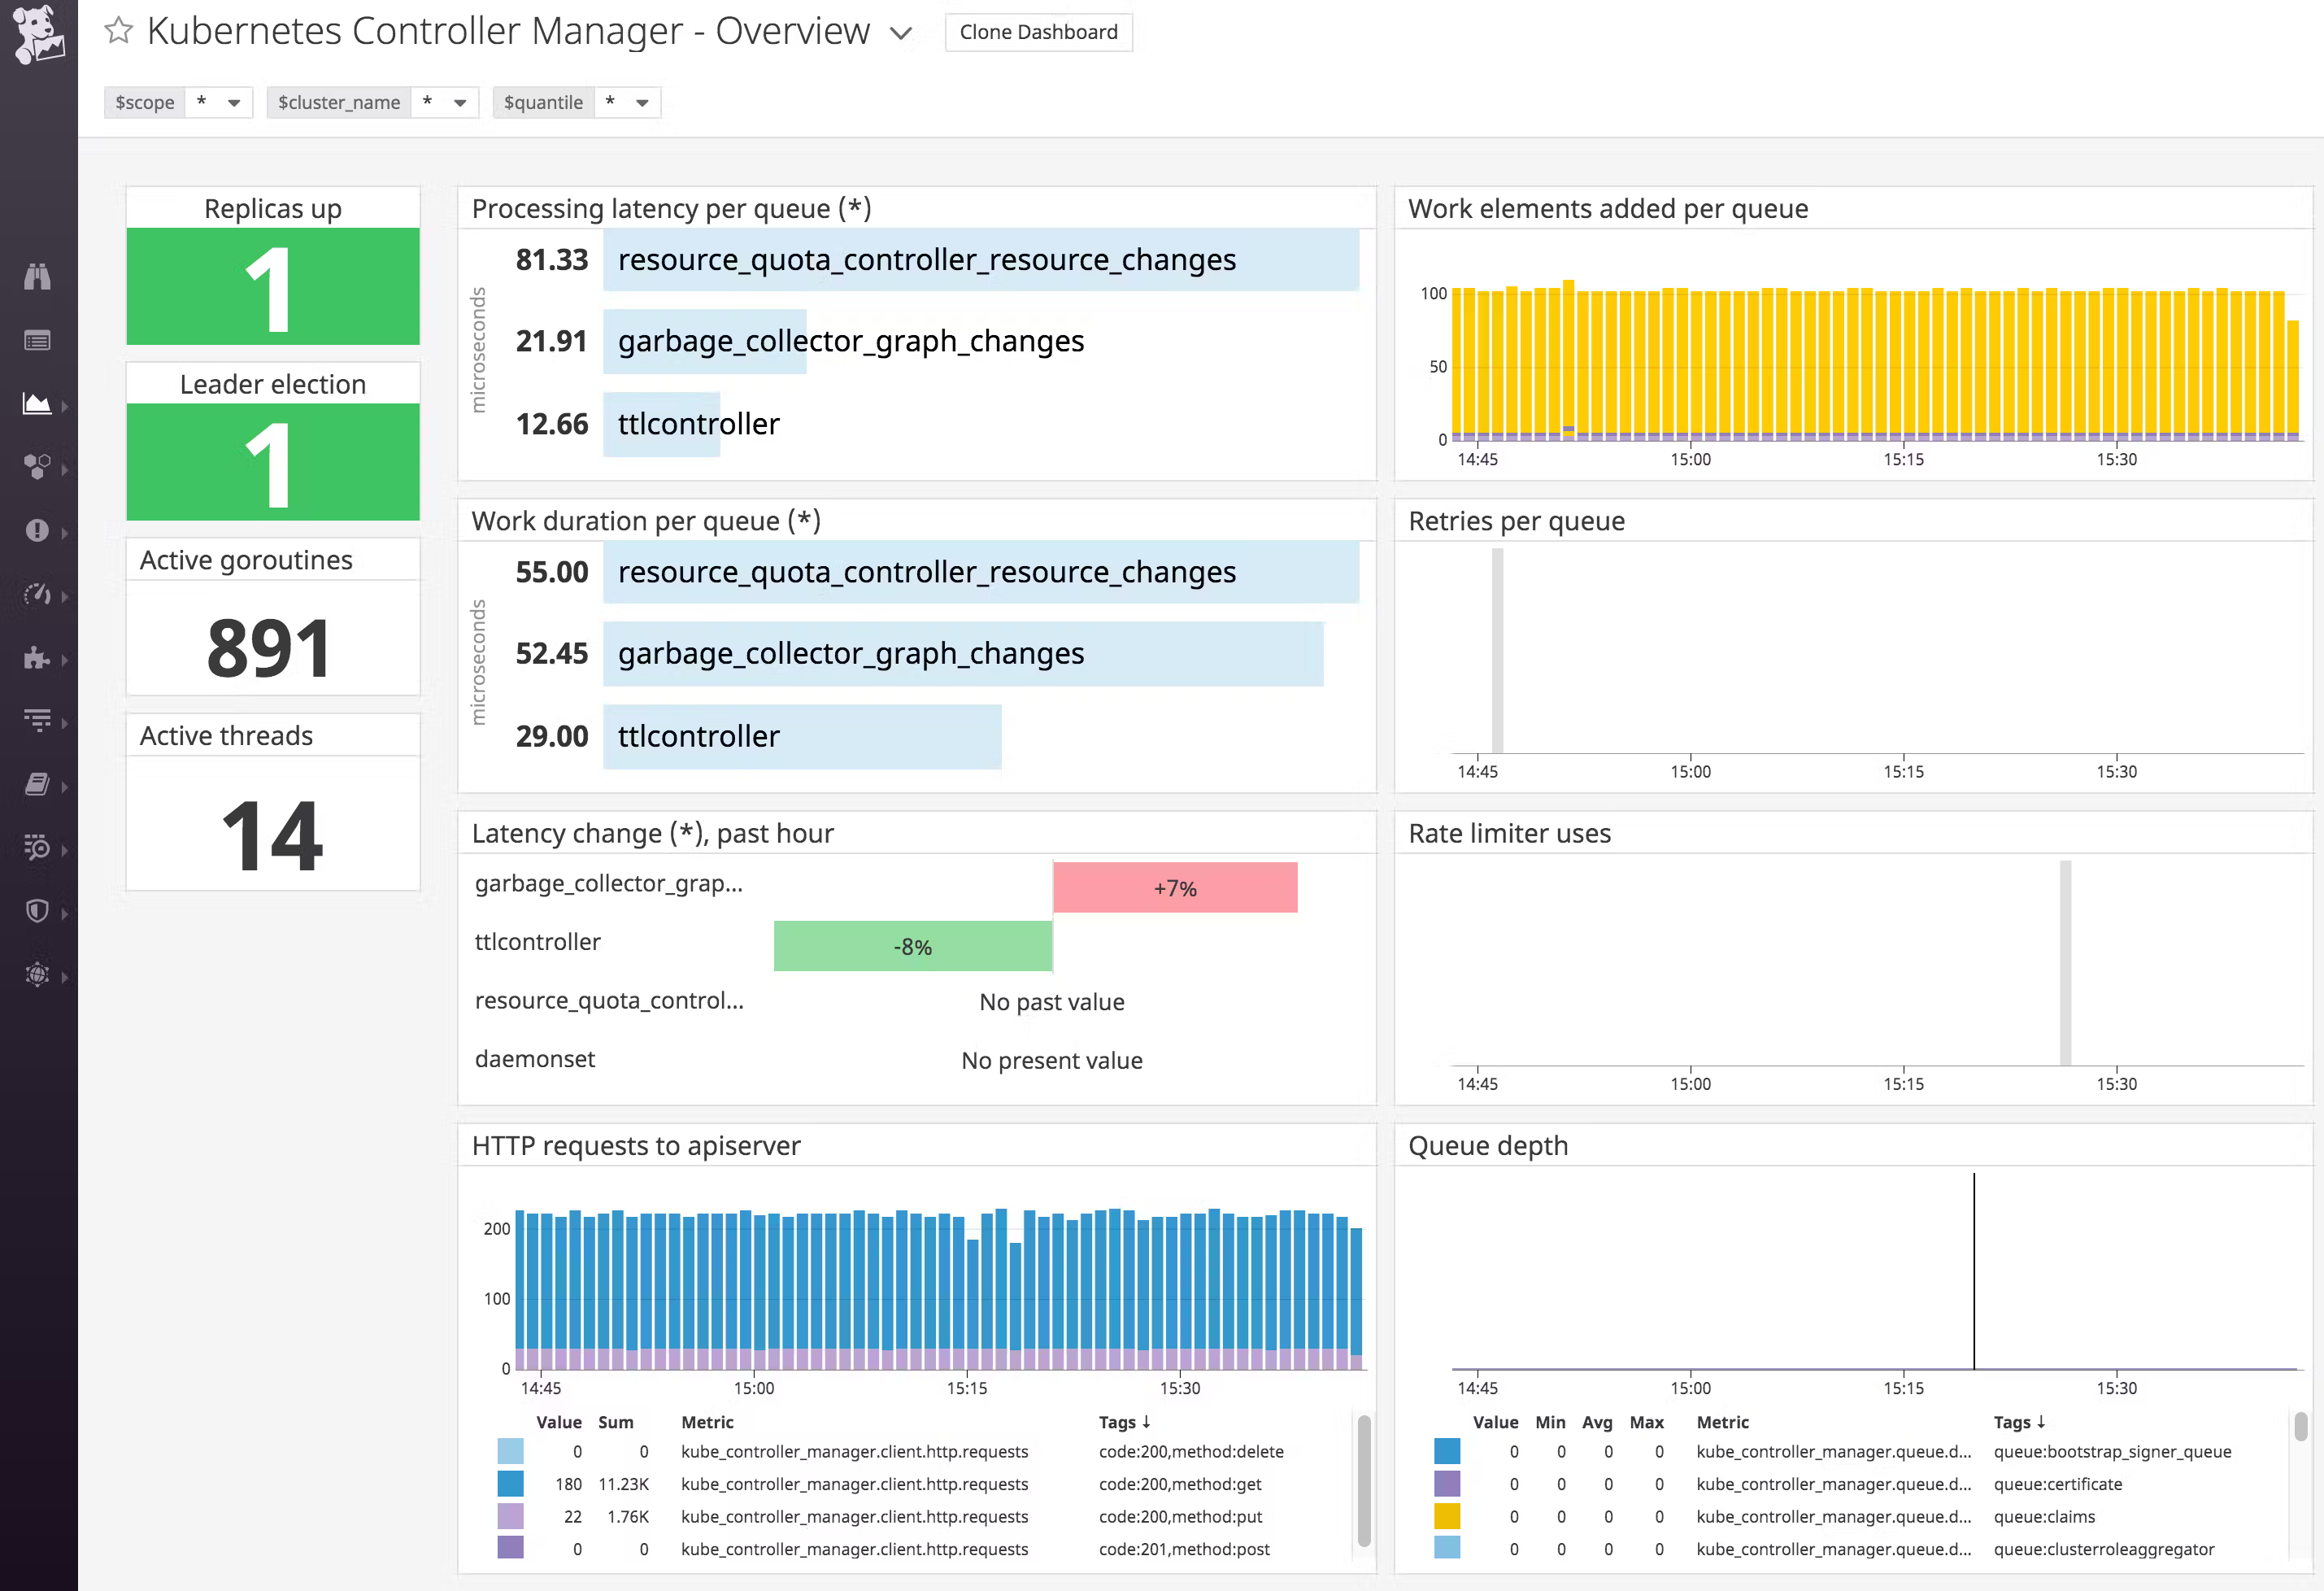
The platform is highly scalable, efficiently managing data from clusters of all sizes. With support for over 600 integrations, it accommodates various data sources. Additional functionalities include resource utilization insights, log aggregation, event tracking, auto-scaling guidance, and service discovery.
Key features:
- Simplified setup with the Datadog Agent
- Efficiently handles data from any cluster
- Provides detailed monitoring for compliance
- Monitors dynamic Kubernetes services efficiently
- Real-time insights for streamlined issue resolution
5. New Relic
New Relic Kubernetes monitoring is a robust and versatile solution that provides organizations with the ability to gain deep insights and monitor the performance of their Kubernetes clusters and workloads, whether they are hosted on-premises or in the cloud. It offers a holistic approach to managing Kubernetes environments by combining interactive visualizations, alerting capabilities, and comprehensive telemetry data integration.
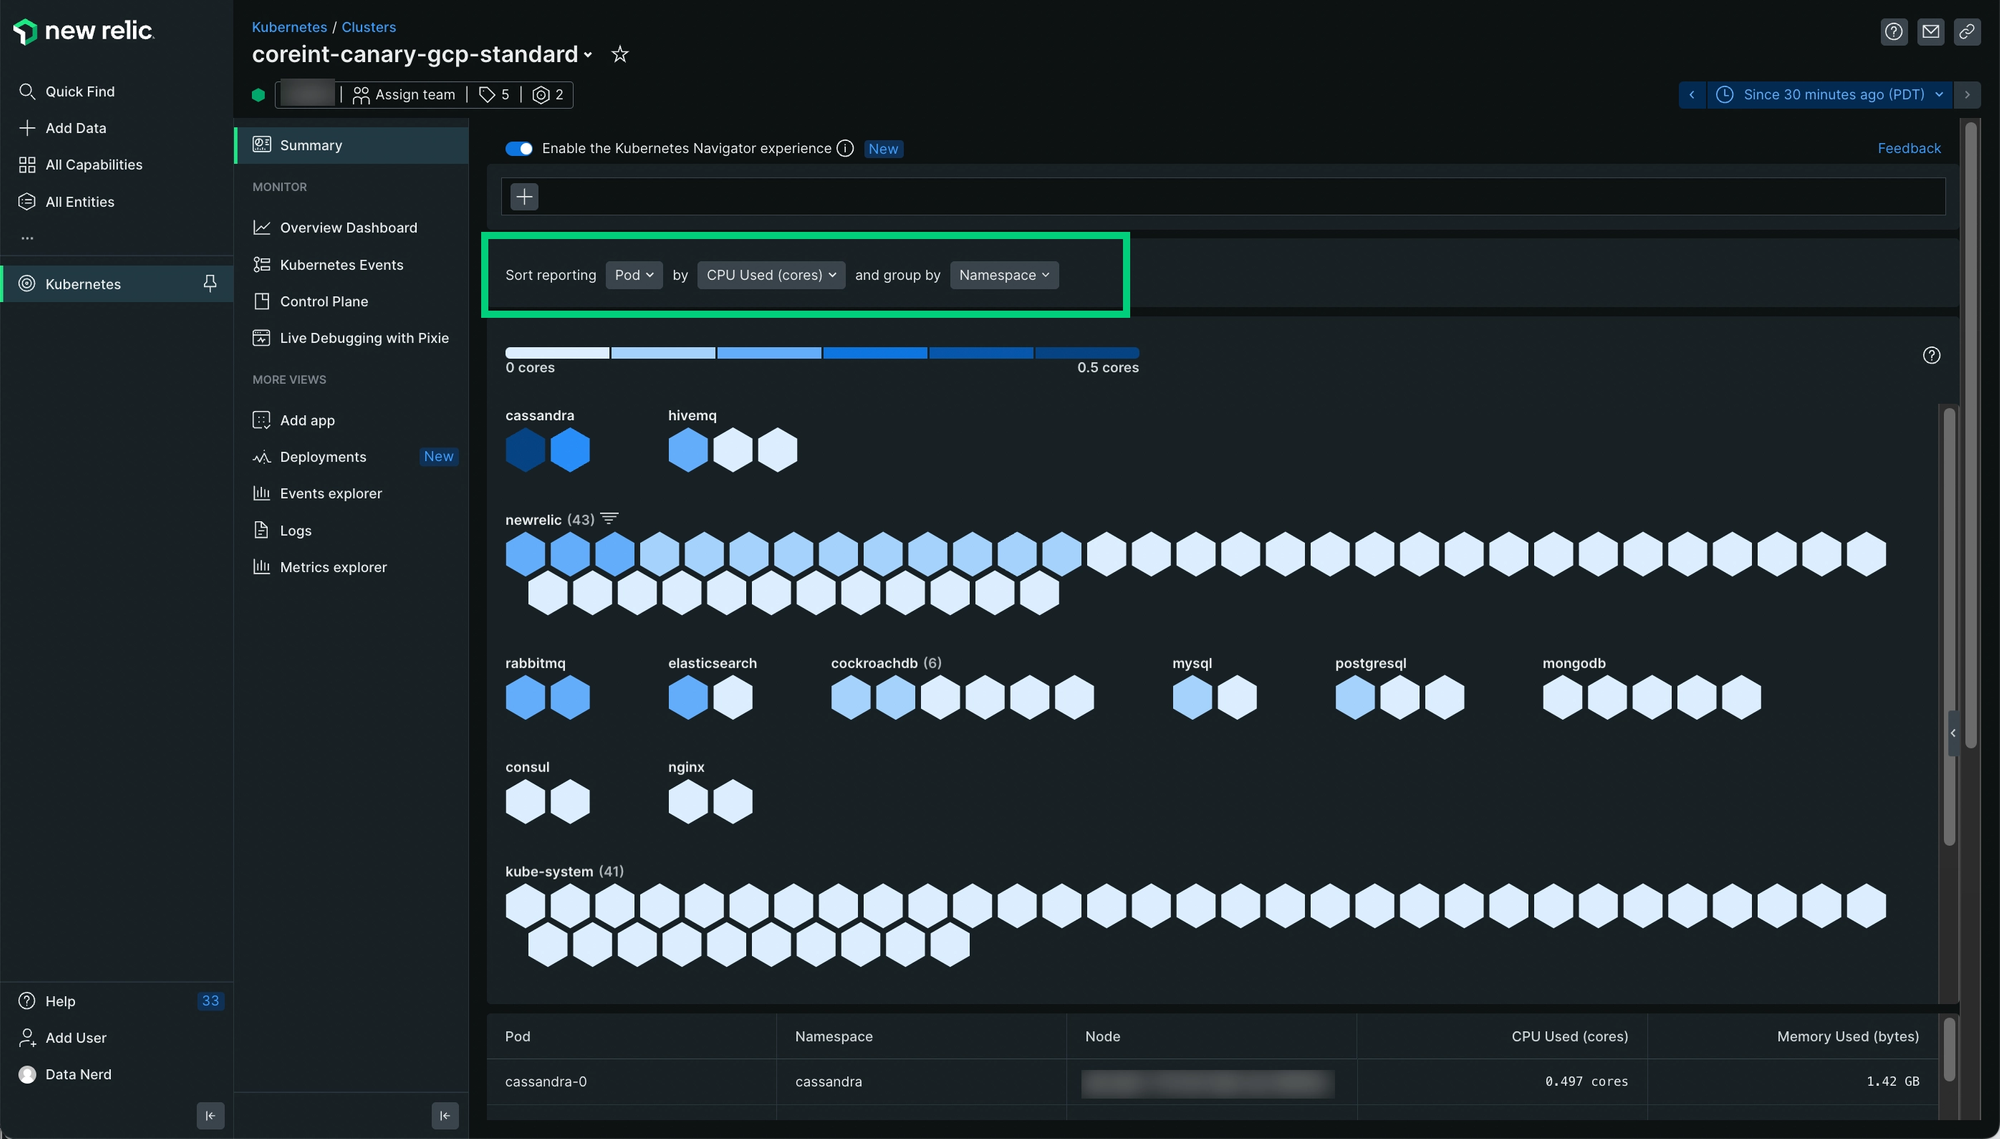
With New Relic Kubernetes monitoring, users can efficiently oversee their Kubernetes infrastructure, troubleshoot issues, and ensure optimal application performance. The solution comes with a user-friendly quickstart package that simplifies the deployment process, allowing users to quickly set up and access crucial performance data.
Its multi-dimensional representation and compatibility with various on-host integrations make it a valuable tool for organizations looking to maintain a healthy and well-managed Kubernetes environment.
Key Features:
- Interactive Visualizations for Data Exploration
- Proactive Alerting with 23 Pre-Configured Alerts
- End-to-End Observability Across Clusters
- Pixie Integration for Fine-Grained Telemetry Data
- Resource Monitoring for Core and Memory Usage
- Pod Management and Troubleshooting
- Multi-Dimensional Cluster Explorer
- Compatibility with On-Host Integrations
- Quick and Easy Deployment for Instant Visibility
6. Dynatrace
Dynatrace Kubernetes Monitoring is a comprehensive solution designed to simplify the management and monitoring of Kubernetes environments. It is highly adaptable, supporting native Kubernetes clusters and managed services across various cloud platforms such as OpenShift, EKS, AKS, GKE, IBM IKS, and more. Regardless of your specific configuration, Dynatrace seamlessly integrates into your Kubernetes infrastructure, ensuring it functions as a native, first-class element.
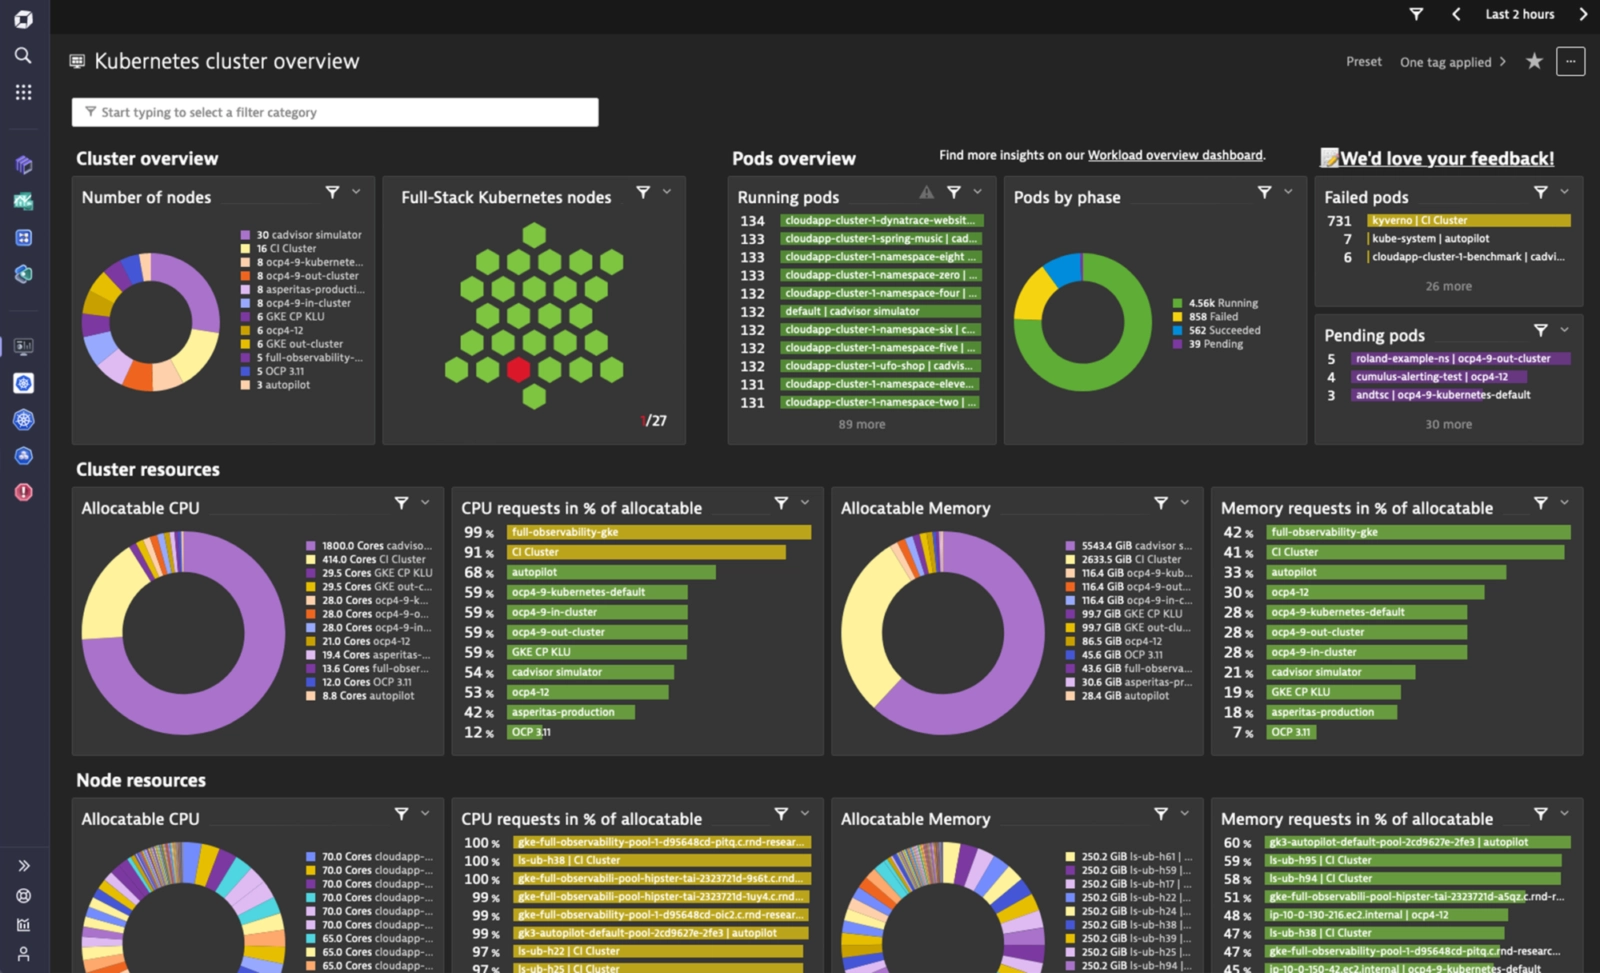
The platform excels at tracking cluster health, pod and node availability, application performance, and resource utilization. Its capabilities are geared towards continuous discovery, intelligent alerting, full-stack observability, GitOps support, and automated out-of-the-box alerting, all of which help maintain and optimize the health of your Kubernetes environment.
Dynatrace's robust features extend to performance analysis, log analytics, root cause analysis, continuous discovery, and even cloud-native security solutions to empower DevSecOps. However, users should be aware that while it offers these comprehensive features, it may involve a steep learning curve, and there might be associated costs.
Key features:
- AI-assisted issue identification
- Cloud-Native Security offers runtime security and threat detection
- Smart notifications for anomalies
- Real-time resource tracking
- Runtime security and threat detection
Conclusion
Monitoring tools play a pivotal role in the world of Kubernetes, helping organizations ensure the smooth operation and optimal performance of their containerized applications. In this conclusion, we'll look at the importance of various Kubernetes monitoring tools, including Atatus, Grafana, Sematext, Datadog, Dynatrace, and New Relic.
Atatus offers real-time application performance monitoring and error tracking, making it easier to identify and resolve issues swiftly. Grafana, on the other hand, excels in data visualization and analysis, providing insights into system performance through dynamic dashboards and alerts. Sematext offers comprehensive observability, combining logs, metrics, and traces to provide a holistic view of your applications, simplifying troubleshooting.
Datadog stands out with its wide range of integrations, facilitating the monitoring of both infrastructure and application performance. Dynatrace offers an AI-powered platform that auto-detects problems and provides insights to optimize performance. New Relic excels in delivering full-stack observability, allowing you to see the entire software stack and troubleshoot effectively.
The choice of monitoring tools depends on your specific needs, but each of these tools plays a critical role in helping organizations manage their Kubernetes environments effectively.
#1 Solution for Logs, Traces & Metrics
![]() APM
APM
![]() Kubernetes
Kubernetes
![]() Logs
Logs
![]() Synthetics
Synthetics
![]() RUM
RUM
![]() Serverless
Serverless
![]() Security
Security
![]() More
More