Top 10 MySQL Monitoring Tools in 2025
As a database administrator, ensuring the smooth running of your MySQL database is paramount. Keeping an eye on vital statistics such as uptime, query performance, and resource utilization is a crucial aspect of maintaining database health.
Fortunately, several monitoring tools are available in the market to help you keep track of these metrics. These tools provide you with insights that enable you to optimize database performance and prevent any potential threats.
However, with so many monitoring tools out there, it can be overwhelming to determine which ones to use. In this blog post, we will be introducing you to the top 10 monitoring tools that every database administrator should have in their toolkit.
These tools are designed to provide you with real-time monitoring, comprehensive alerting, and deep analytics capabilities to help you make informed decisions quickly. We will examine the features of each of these tools to help you choose the most suitable one for your organization.
Let’s get started!
Table Of Contents
How MySQL Monitoring Works?
Monitoring a MySQL database involves collection, storage and analyzing all the metrics, events and other related events from the database. We do so to maintain the efficiency and availability of our databases. Having a monitoring solution also helps in identifying the errors and getting these issues corrected promptly.
Data collection involves metrics (includes query execution times, number of connections, buffer pool usage, and many other performance and operational metrics) and logs ( logs contain valuable information about server operations, errors, slow queries, and other critical events).
The collected data (metrics, logs, events) is stored either locally or sent to a centralized monitoring system for storage, depending on the monitoring solution's architecture.
Monitoring systems typically analyze data in real-time to detect current issues or anomalies.
But, by storing historical data, monitoring systems allow for trend analysis, capacity planning, and studying performance over time.
Benefits of having MySQL Monitoring Tool
There are several benefits of having a monitoring tool in your kitty. Firstly, you are free of any trouble of manually managing all that data. Additionally, it gives you a report of overall metrics, how they are functioning, what needs tweaks, and so on.
And here are the other benefits:
- Visualization: Data is often visualized in dashboards, charts, and graphs, providing an easily interpretable overview of the database's health and performance. Some monitoring systems integrate with popular visualization tools like Grafana etc. and allows customization too.
- Alerting: Based on predefined thresholds or anomaly detection algorithms, the monitoring system can generate alerts for potential issues. Alerts can be delivered through various channels: email, SMS, push notifications, etc.
- Integration with Other Systems: Monitoring solutions often integrate with other tools, such as incident management platforms or orchestration systems, to automate responses or inform relevant teams about issues.
- Performance Tuning Recommendations: Advanced monitoring solutions can provide recommendations based on the analyzed data. For instance, they might suggest indexing certain columns or modifying specific system variables.
It's crucial to ensure that monitoring activities do not introduce security vulnerabilities. Secure connections, encrypted credentials, and role-based access controls are common features in monitoring tools.
To continue effective monitoring, especially as My SQL and its ecosystem evolve, it's essential to keep the monitoring tools and configurations updated.
Top MySQL Monitoring Tools
Now let’s look at some of the most popular MySQL Monitoring tools in the market:
- Atatus
- MySQL Enterprise Monitor
- Prometheus
- PRTG Monitor
- Datadog
- New Relic
- Sematext
- Percona MMT
- Dynatrace
- Solarwinds
#1 Atatus
Atatus is a robust MySQL monitoring tool with a wide range of features that are designed to help organizations optimize their database performance.
One of the key capabilities of Atatus is its ability to provide real-time visibility into critical metrics such as CPU usage, memory usage, query latency, and more. Additionally, the tool supports a wide range of database platforms, including MySQL, MariaDB, and Percona, making it an ideal choice for teams with diverse database environments.
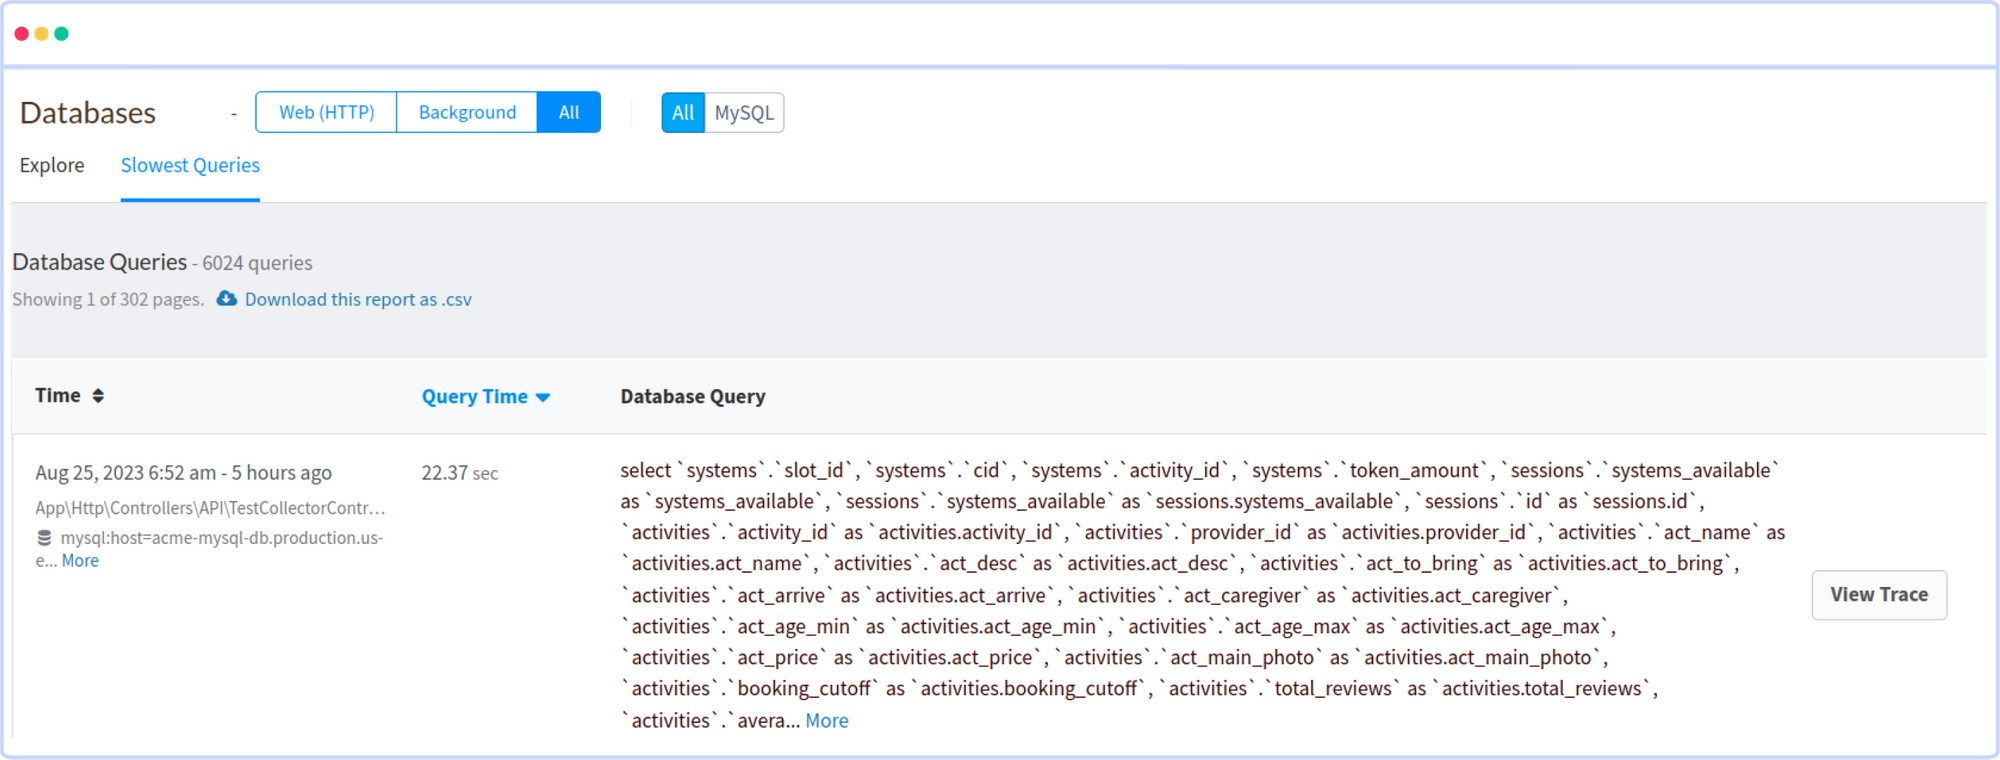
Atatus provides you an in-depth perspective of your SQL performance by uncovering slow SQL queries that occur within your requests, as well as transaction traces, to give you actionable insights.
With normalized queries, you can see a list of all slow SQL calls to see which tables and operations have the most impact, know exactly which function was used and when it was performed, and see if your modifications improve performance over time.
Atatus also offers advanced analytics and reporting capabilities, allowing users to identify and solve performance issues quickly and efficiently. With its powerful features and comprehensive monitoring capabilities, Atatus is an excellent choice for organizations looking to optimize their My SQL databases and ensure peak performance.
#2 MySQL Enterprise Monitor
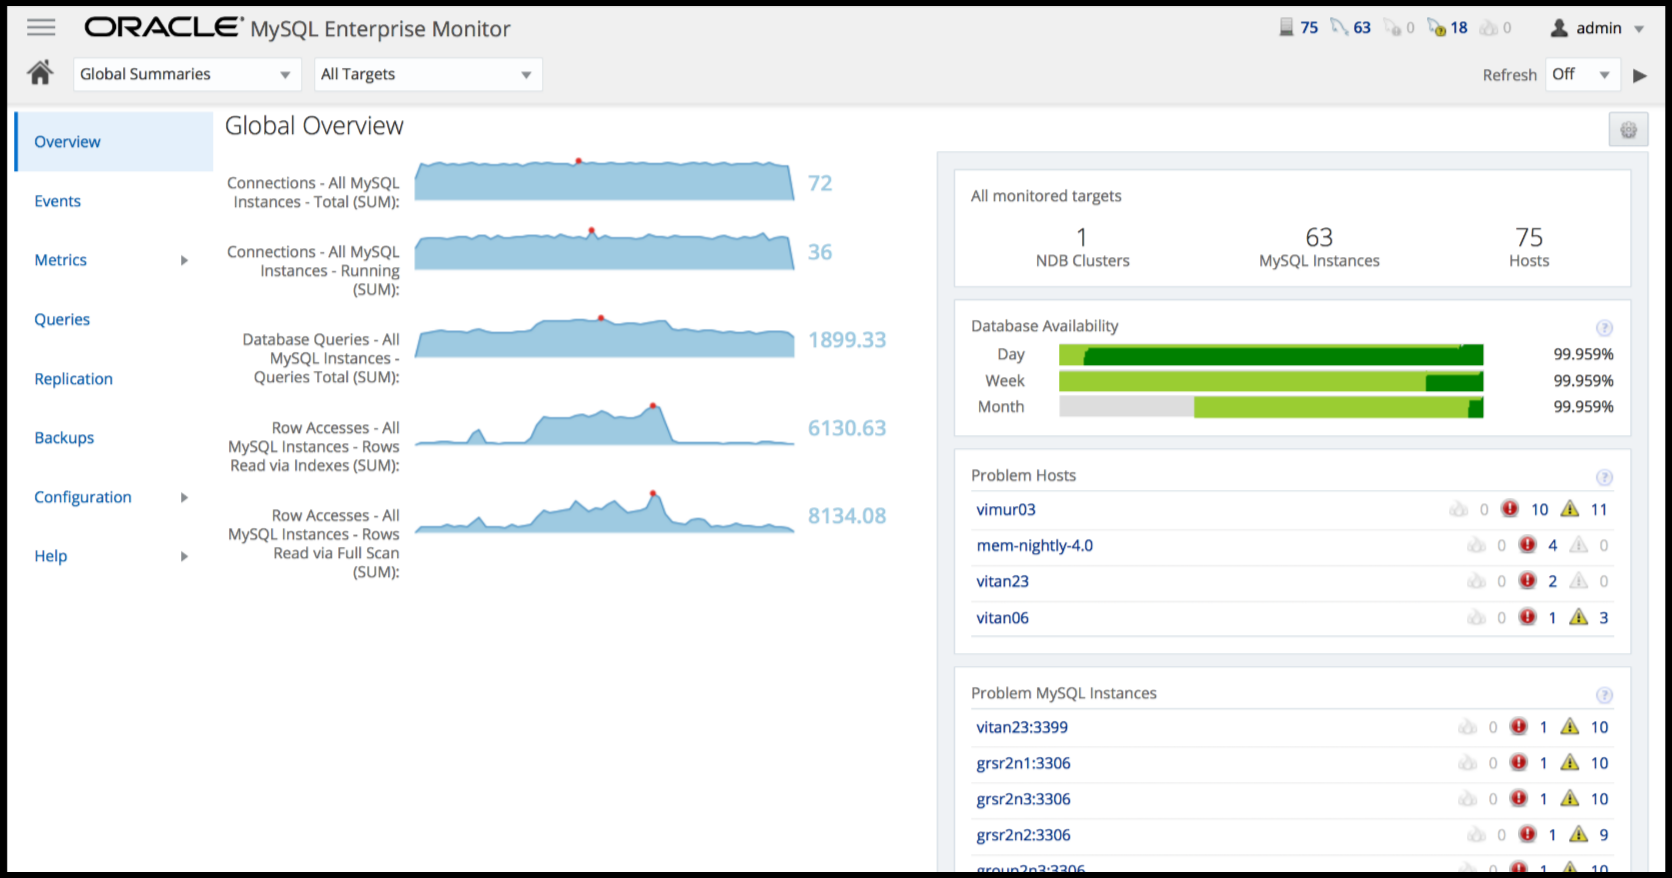
MySQL Enterprise Monitoring is a comprehensive monitoring and management solution specifically designed for MySQL databases. It is developed by Oracle, the company behind MySQL. MySQL Enterprise Monitoring provides tools and features that enable database administrators and IT professionals to monitor, analyze, and optimize the performance, availability, and security of their My SQL database instances.
Here's an overview of MySQL Enterprise Monitoring and its features:
- Real-time monitoring of MySQL database performance metrics, including query execution times, resource utilization (CPU, memory, disk), and more.
- Graphical visualizations and charts to help identify performance bottlenecks and trends over time.
- In-depth query analysis to identify and troubleshoot slow or poorly performing SQL queries.
- Configurable alerts based on predefined thresholds or custom rules.
- Security monitoring to detect unauthorized access and suspicious activities.
- Auditing capabilities to track database changes and user actions for compliance purposes.
- Historical performance data storage for analysis of trends and patterns.
- Monitoring of replication status and lag in master-slave configurations.
- Seamless integration with MySQL Support services to aid in troubleshooting and issue resolution.
- Integration with MySQL Enterprise Backup and MySQL Enterprise Scalability to streamline backup and scaling processes.
- Role-based access control to ensure the right personnel have access to monitoring data.
#3 Prometheus
Prometheus is an open-source monitoring and alerting toolkit that is widely used for monitoring various systems and applications, including MySQL databases.
Prometheus doesn't have built-in support for monitoring MySQL directly, but it provides a flexible architecture that allows you to collect, store, and visualize custom metrics using exporters and integrations.
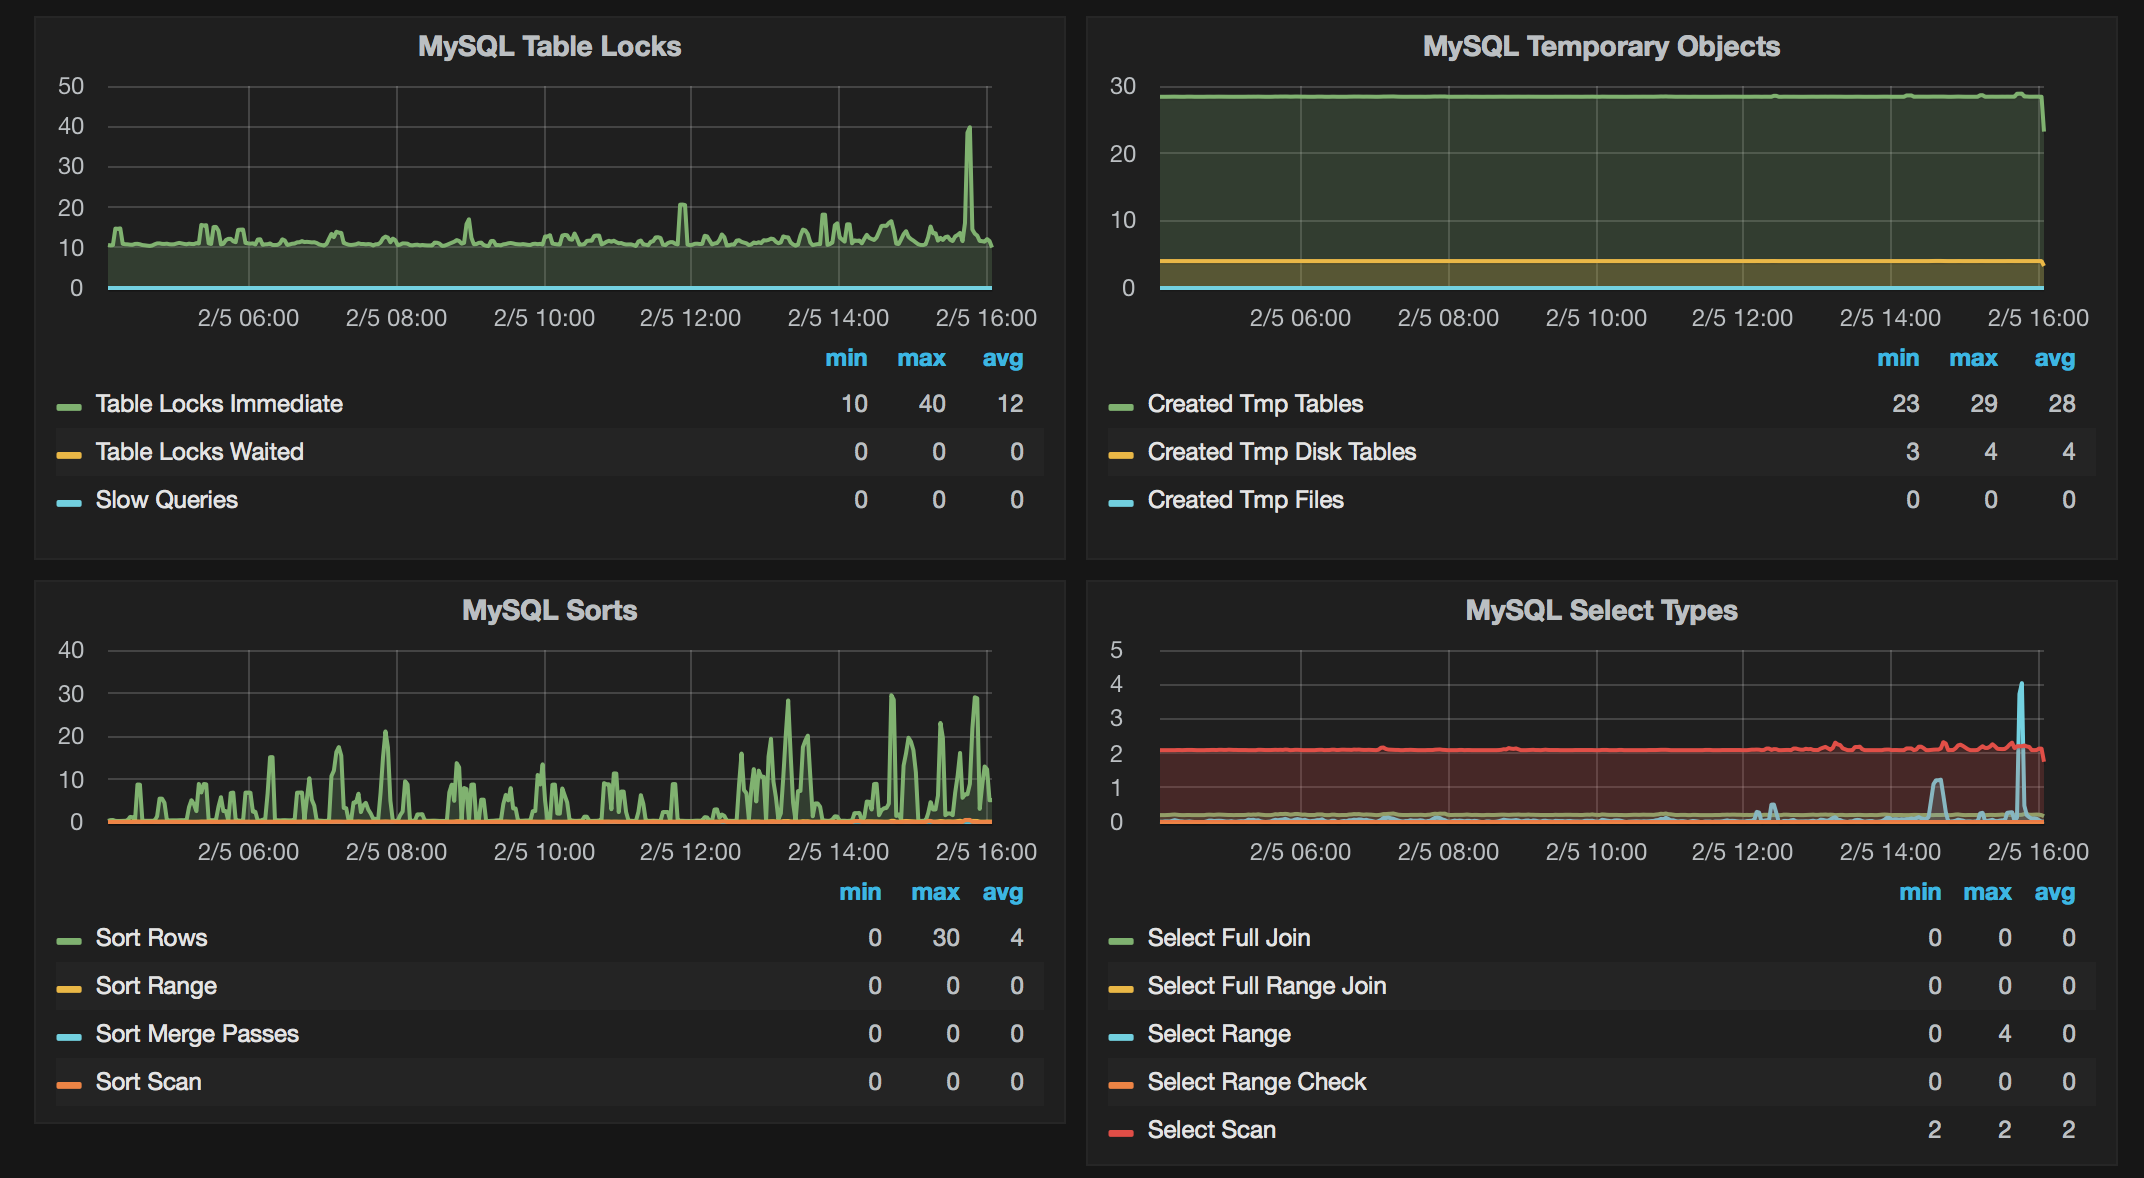
With the metrics collected and stored by Prometheus, you can use PromQL (Prometheus Query Language) to write queries and create visualizations. You can also integrate Grafana with Prometheus for more advanced and customizable dashboards.
Prometheus has a built-in alerting mechanism that allows you to define alerting rules based on metric thresholds. Configure alerting rules in Prometheus, and you can set up alert notifications to be sent when certain conditions are met.
#4 PRTG
PRTG Network Monitor is a network monitoring and management tool that offers various monitoring capabilities, including monitoring MySQL databases. PRTG stands for "Paessler Router Traffic Grapher," and it's designed to help IT professionals monitor their network infrastructure, servers, applications, and more. Here's a brief description of PRTG's MySQL performance monitoring capabilities:
PRTG can monitor various performance metrics of MySQL databases, such as query execution times, connections, throughput, and resource utilization like CPU and memory. It uses "sensors" to monitor specific aspects of your infrastructure. For MySQL, you can set up custom sensors to gather the desired metrics from your databases.
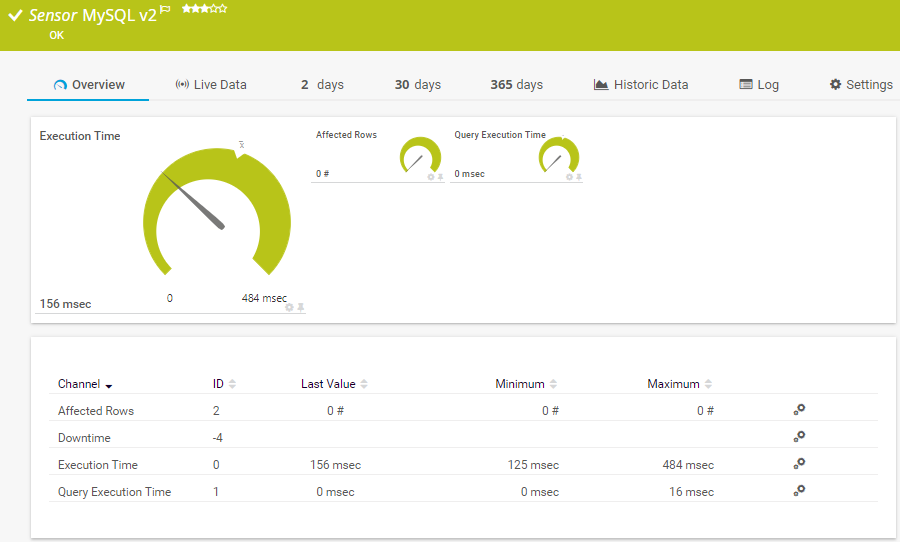
PRTG can execute custom SQL queries against your MySQL databases and monitor their execution times, helping you identify slow or problematic queries. It also stores historical data, so you can always go back and analyze it to find any error patterns.
PRTG is known for its user-friendly interface and straightforward setup, making it suitable for IT professionals without extensive monitoring experience. While PRTG focuses on network monitoring, it can be integrated with other systems and tools, potentially allowing you to combine MySQL performance data with broader network and application performance metrics.
Other features include customizable dashboards, alerts and notifications, remote monitoring, etc.
#5 Datadog
Datadog is a popular monitoring and analytics platform that offers a wide range of features for monitoring various systems and applications, including MySQL database monitoring. Here's how you can set up Datadog for MySQL monitoring:
The Datadog Agent is a lightweight software that collects and sends metrics and traces to the Datadog platform. Install the Datadog Agent on the servers where your MySQL databases are running.
Datadog provides an integration specifically for MySQL. To configure the MySQL integration you can follow the instructions given in their official docs to set up the integration. This usually involves specifying the connection details and credentials for your MySQL instances.
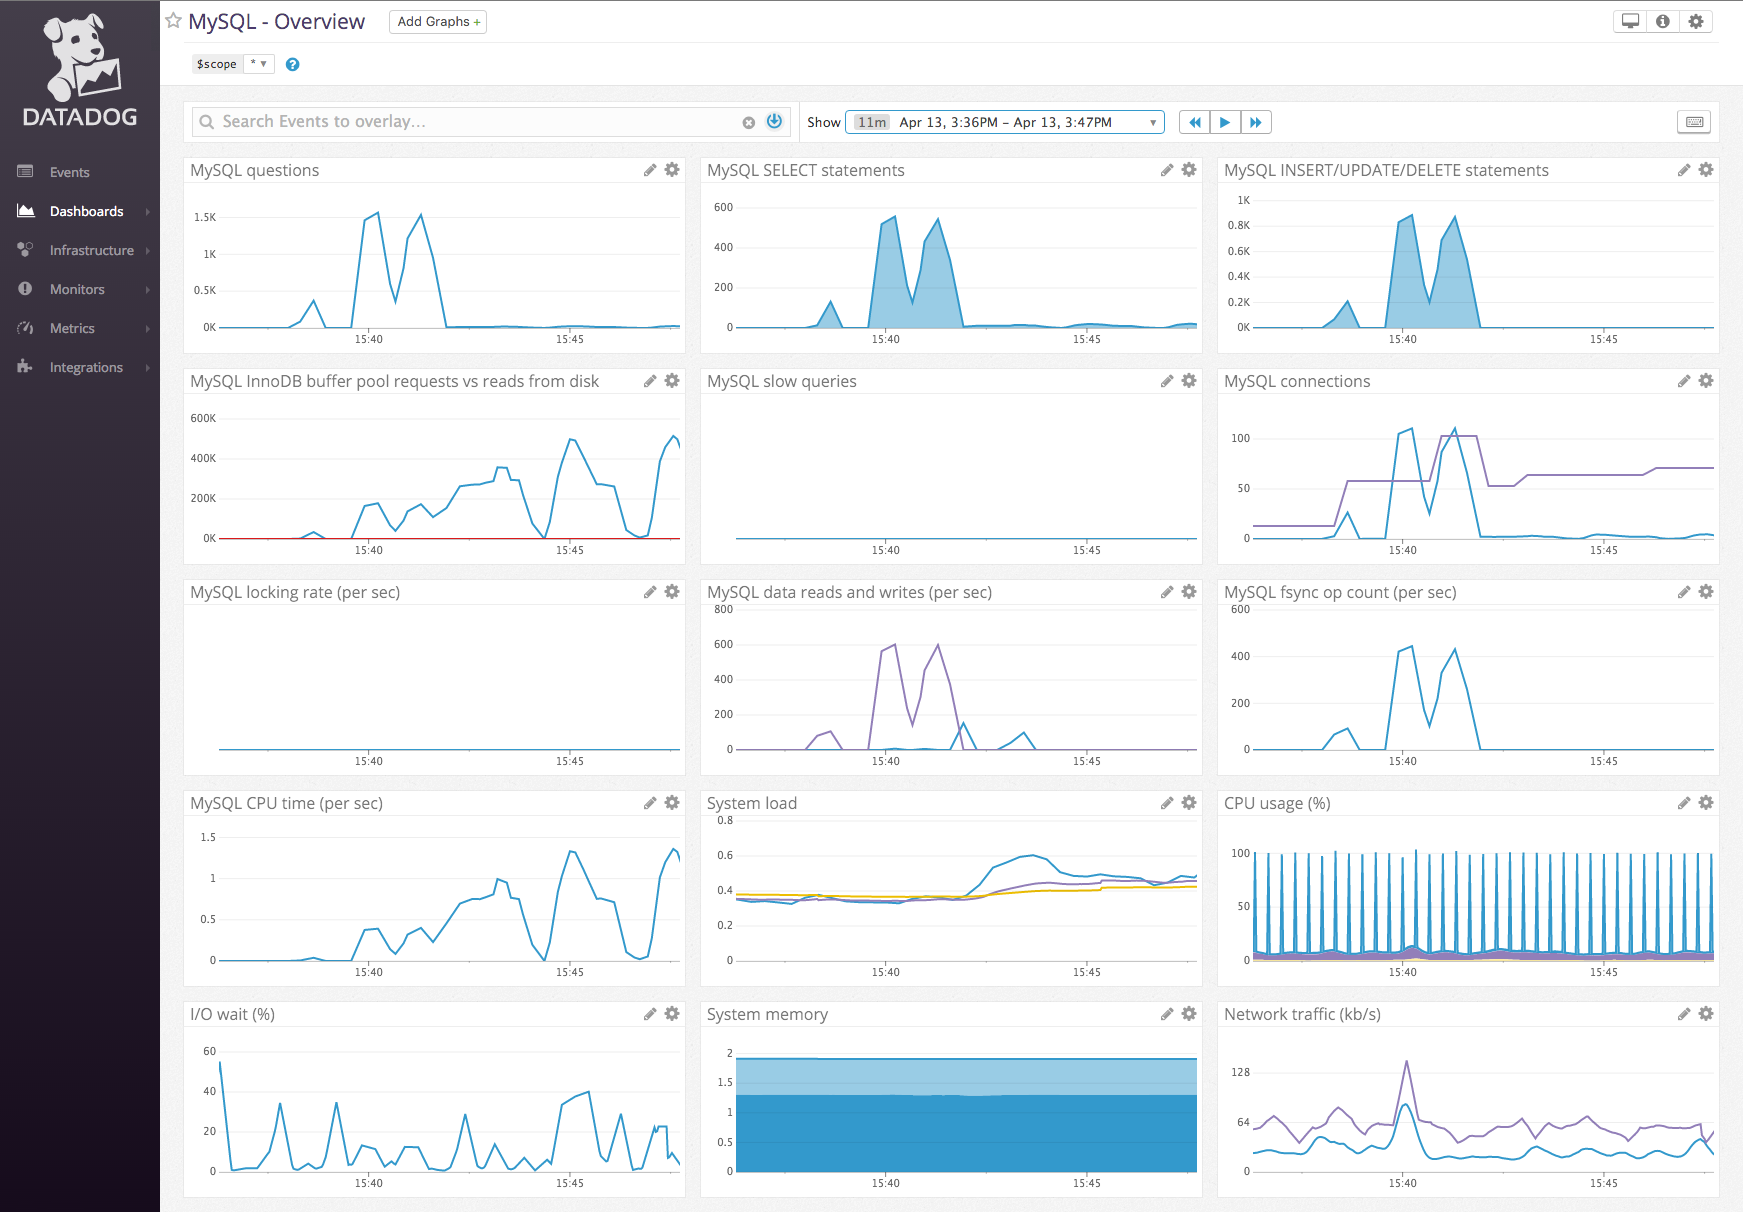
Once the integration is configured, Datadog will start collecting metrics from your MySQL databases. You can explore the pre-built MySQL dashboards provided by Datadog or create your own custom dashboards to visualize the metrics that are important to you. These dashboards can include metrics related to performance, connections, queries, and more.
Datadog allows you to set up alerting based on metric thresholds. For example, you can set up alerts for high CPU usage or slow query execution times. Datadog also provides anomaly detection capabilities that can automatically identify unusual patterns in your MySQL metrics. This can help you proactively detect and address potential issues.
Datadog also supports the ability to correlate MySQL metrics with other metrics and traces from your applications and infrastructure. This can provide a more comprehensive view of the health and performance of your entire stack.
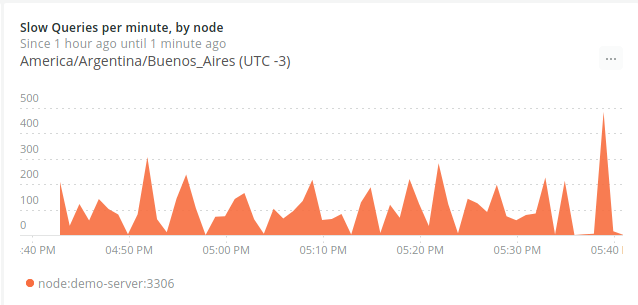
#6 New Relic
New Relic's MySQL monitoring capabilities allow you to gain visibility into the performance, health, and behavior of your MySQL instances.
Here's a brief description of what New Relic's MySQL monitoring tool offers:
- Performance Metrics
- Query Analysis
- Database Diagnostics
- Alerting and Notifications
- Anomaly Detection
- Custom Dashboards
- Historical Analysis
- New Relic can be integrated with data from other parts of your application stack, allowing you to correlate MySQL metrics with application performance, infrastructure health, and more.
#7 Sematext
Sematext's MySQL monitoring tool is designed to provide a holistic view of your MySQL database monitoring, focusing on performance optimization, anomaly detection, and troubleshooting.
Sematext's monitoring approach emphasizes real-time and historical data analysis, combined with detailed logging to facilitate troubleshooting and optimization.
Here's some of the exciting features that Sematext offers:
- In-depth Metrics: Sematext provides detailed metrics on the innards of MySQL, such as InnoDB metrics (buffer pool size, IO operations, etc.), replication status, and more.
- Dashboard Visualization: Sematext offers pre-built dashboards that provide insights into MySQL performance. These dashboards are interactive and allow you to drill down into specific metrics for a granular view.
- Log Integration: With Sematext's integrated log management capabilities, you can correlate MySQL performance metrics with logs for detailed troubleshooting.
- Transaction Tracing: For applications that rely heavily on databases, Sematext allows you to trace transactions and understand how application performance relates to database operations.
- Replication Monitoring: Monitor the status of MySQL replicas and understand replication lags, ensuring your distributed database systems run smoothly.
- Infrastructure Monitoring: Beyond just MySQL, Sematext can monitor the entire infrastructure, allowing you to understand how server performance impacts database operations.
- Integration and Extensibility: Sematext can be integrated with various third-party tools and platforms, offering a broader view of your entire IT ecosystem.
- Role-based Access Control: For organizations with multiple users or teams, Sematext provides fine-grained access control to ensure security and proper access to monitoring data.
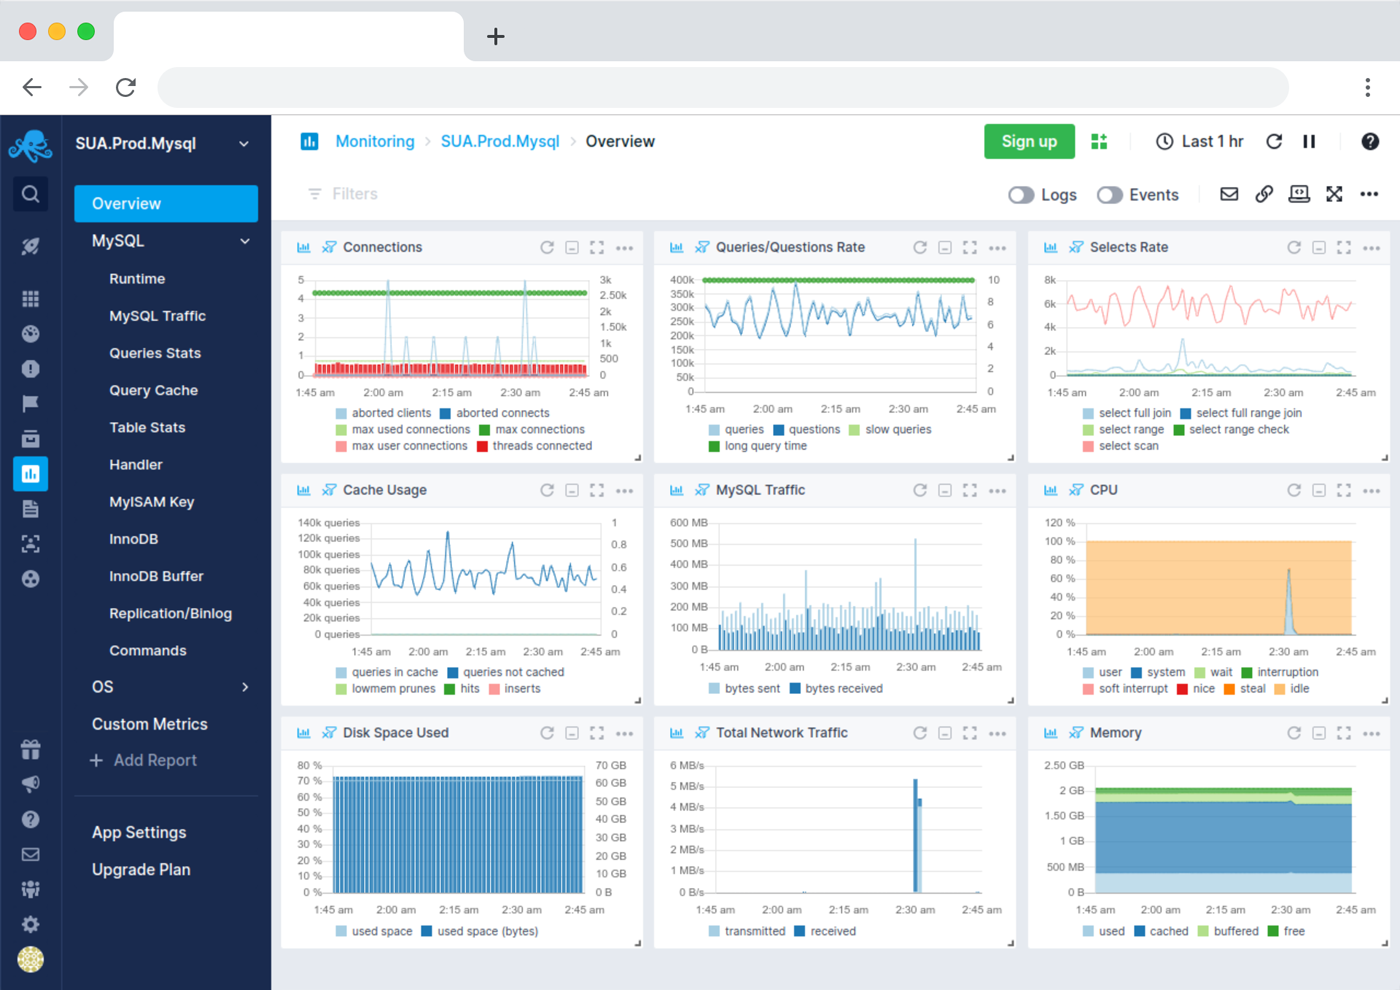
#8 Percona Monitoring and Management Tool
Percona Monitoring and Management (PMM) is an open-source monitoring and management platform specifically designed for managing and optimizing the performance of MySQL, MariaDB, and MongoDB databases.
It is developed by Percona, a leading company in the field of open-source database software and services. PMM provides a comprehensive set of tools for monitoring, diagnosing, and optimizing database performance.
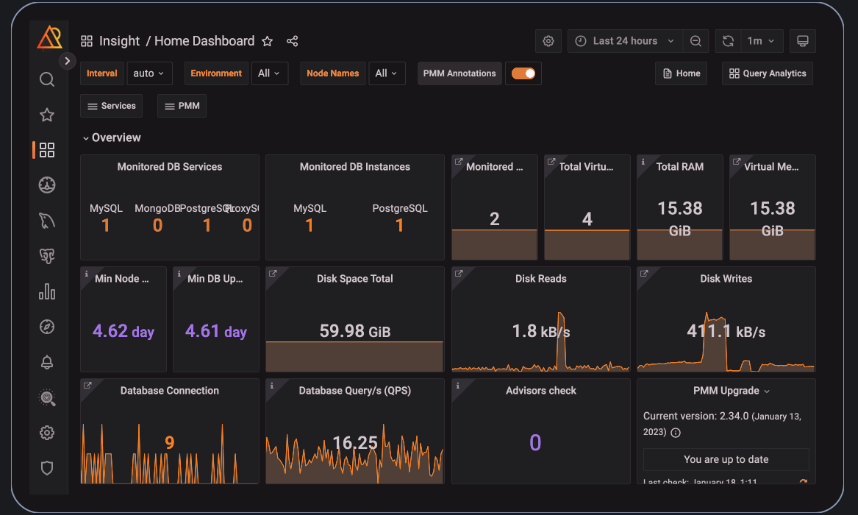
Real-time Monitoring: PMM offers real-time monitoring of your database instances, capturing various metrics related to performance, resource utilization, and query execution, along with query analysis.
- Resource Utilization Metrics: PMM captures metrics related to CPU usage, memory utilization, disk I/O, network traffic, and other system resources. This helps in identifying resource bottlenecks.
- Query Profiling: PMM enables detailed query profiling, allowing you to analyze the lifecycle of individual queries and understand how they impact database performance.
- Replication Monitoring: Monitor the status and performance of replication in your MySQL or MariaDB clusters. This includes lag analysis and health checks.
- Distributed Architecture Support: PMM supports monitoring distributed database architectures, making it suitable for complex setups.
- Integration with Grafana: PMM uses Grafana as its visualization and dashboarding engine, allowing for extended customization and integration with other data sources.
- Open-Source Framework: PMM is open source, allowing you to modify and extend it according to your specific needs.
- Support for MySQL, MariaDB, and MongoDB: PMM isn't limited to MySQL; it also supports MariaDB and MongoDB, making it versatile for different database technologies.
#9 Dynatrace
Dynatrace's approach to monitoring focuses on end-to-end observability, capturing data from the user interface level down to the infrastructure.
Dynatrace provides in-depth insights into the performance and health of MySQL databases and captures metrics allowing you to trace problems from the user impact down to the individual SQL statement causing the issue.
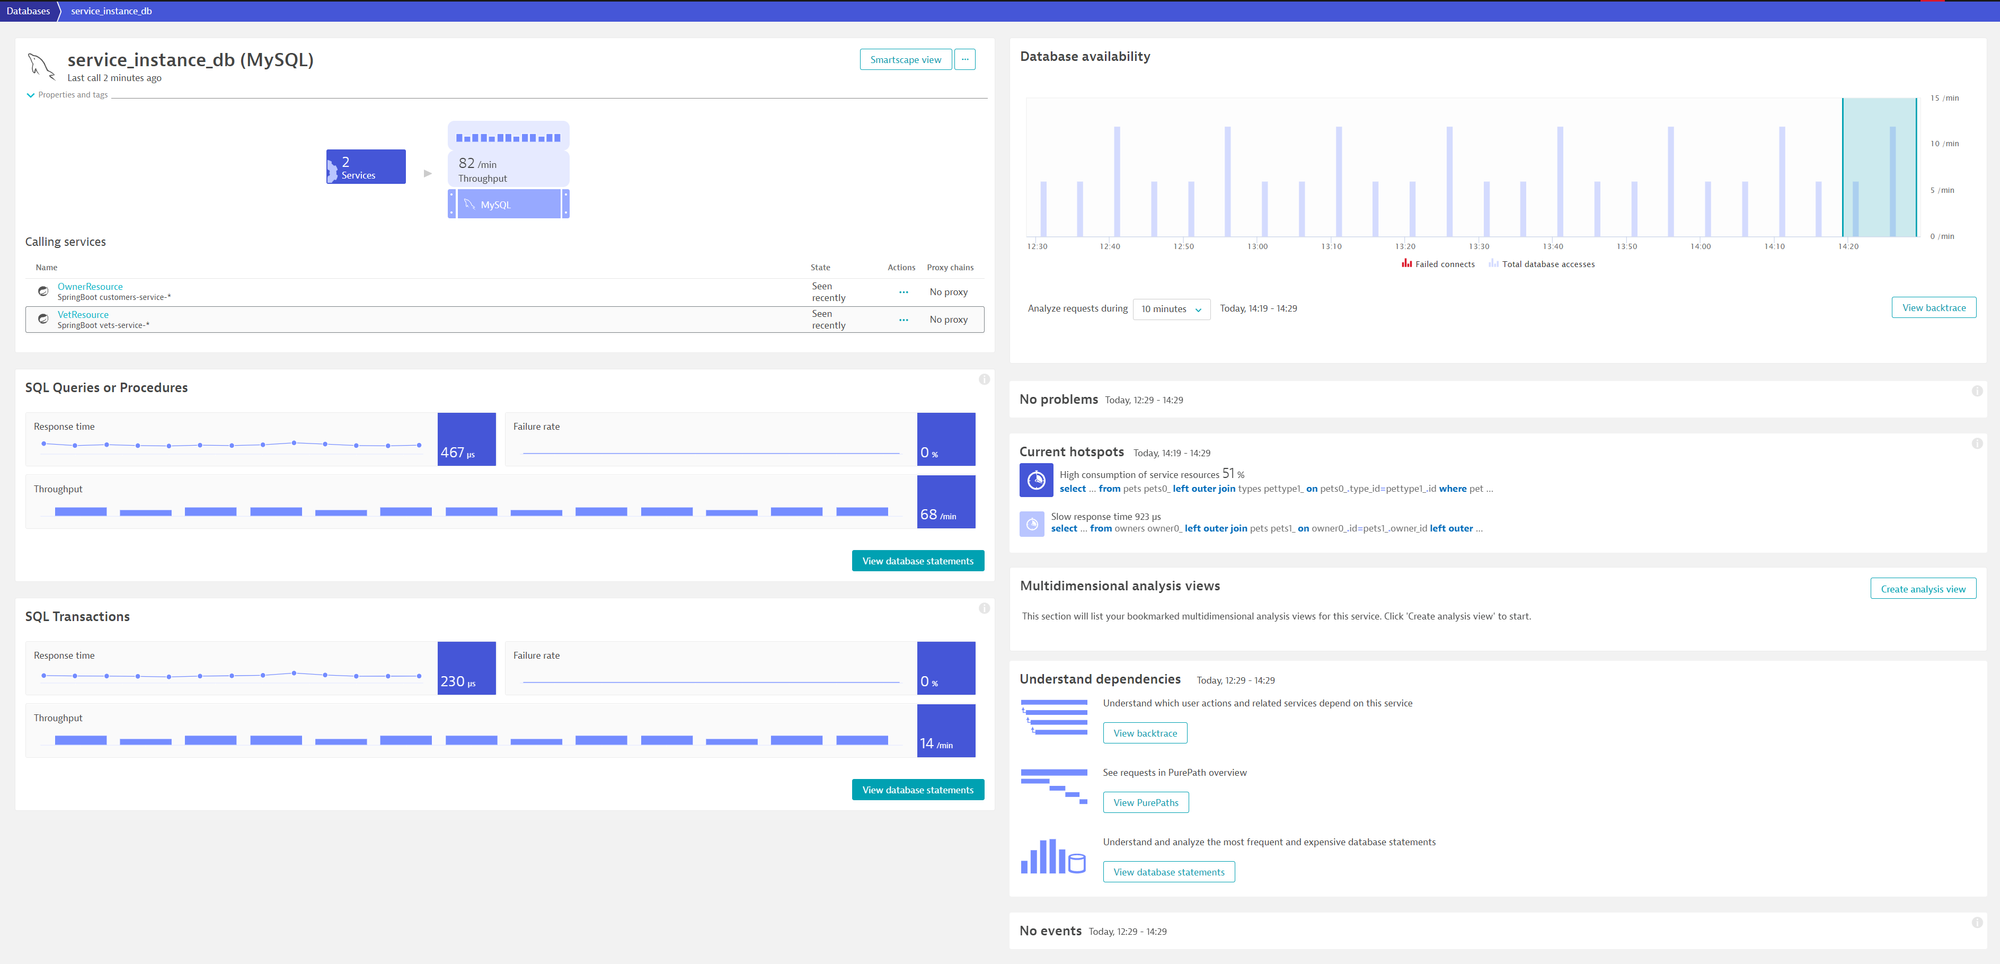
Beyond just query performance, Dynatrace provides visibility into the MySQL server's resource utilization, such as CPU, memory, and disk I/O, highlighting potential infrastructure-related issues.
One of Dynatrace's standout features is its ability to automatically discover and map out the services and components of a digital environment. This means you can quickly identify how MySQL databases interact with other elements of your system.
Dynatrace employs AI-driven analysis to automatically detect problems and anomalies in your monitored environments. When an issue arises, Dynatrace can often pinpoint the root cause, be it a slow-running query, resource contention, or another factors.
#10 SolarWinds
SolarWinds Database Performance Analyzer (DPA) is the tool commonly used for monitoring various databases, including MySQL. It provides features tailored to monitoring and optimizing the performance of MySQL databases.
DPA focuses on monitoring and analyzing SQL query performance in your MySQL databases. It provides insights into query wait times, helping you pinpoint the specific areas causing bottlenecks and delays in your MySQL database operations.
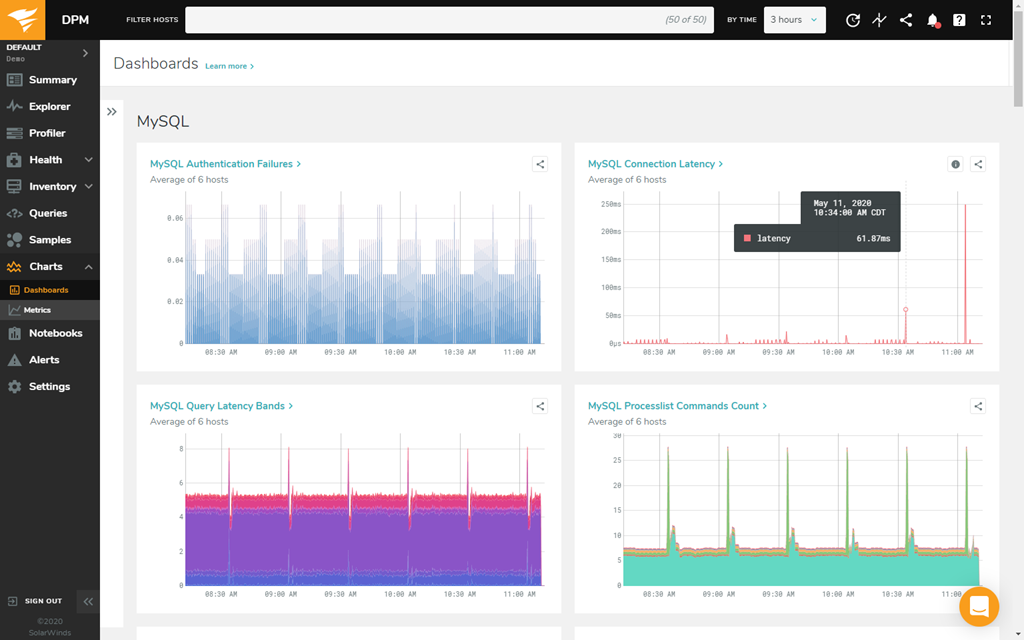
DPA not only identifies problematic queries but also provides recommendations for query optimization. It suggests ways to rewrite queries for better performance. Understand the reasons behind database wait times by analyzing the various wait events occurring in your MySQL databases. It also supports monitoring multiple MySQL databases across different instances and servers.
Apart from these, it also offers resource utilization monitoring, visualizations and dashboards, alerts and notifications, historical data analysis and integrations with other SolarWinds tools.
Summary
There are several MySQL monitoring tools to help businesses keep track of their database performance that we have looked at in this article.
Atatus, for example, offers real-time monitoring and tracing capabilities, allowing users to quickly identify bottlenecks and optimize query performance. Prometheus is another popular tool that provides flexible querying and visualization options, while Datadog offers a comprehensive monitoring platform with advanced alerting and collaboration features.
New Relic and Dynatrace also provide powerful monitoring capabilities and real-time insights into application performance. Solarwinds offers a suite of monitoring tools, including a MySQL monitor that provides real-time and historical data analysis. Other notable tools include MySQL Enterprise Monitor, Percona Monitoring and Management Tool, Sematext, and PRTG.
Each of these tools has its unique features and benefits, making it essential for businesses to carefully evaluate their needs before selecting a monitoring solution.
#1 Solution for Logs, Traces & Metrics
![]() APM
APM
![]() Kubernetes
Kubernetes
![]() Logs
Logs
![]() Synthetics
Synthetics
![]() RUM
RUM
![]() Serverless
Serverless
![]() Security
Security
![]() More
More


![New Relic vs Splunk - In-depth Comparison [2026]](/blog/content/images/size/w960/2024/10/Datadog-vs-sentry--19-.png)
![New Relic vs Sentry - Which Monitoring Tool to Choose? [2026]](/blog/content/images/size/w960/2024/10/VS--1-.png)