What is Code Profiling? – A Detailed Explanation
Few lines of code, no matter how great your development team is, run at peak performance when they're originally developed. To discover the most effective technique to make code run quicker, it must be evaluated, debugged, and reviewed.
How can software engineers and quality assurance engineers ensure that their code is fast, efficient, and ultimately valuable?
The approach is to evaluate an application's code and discover and resolve performance bottlenecks using code profiling.
We will cover the following:
- What is Profiling?
- Profiling Collection Methods
- How does Profiling Works?
- What Exactly does Code Profiling do?
- Types of Code Profiling
- Why Should You Use a Profiling Tool?
- Challenges in Profiling
- Why We Need a Profiling Tool?
What is Profiling?
Profiling is the process of collecting program parameters while it is running. The execution duration and number of calls of specific functions and program code lines are measured during profiling. The programmer can use this tool to locate and optimise the slowest code portions.
Many programs, particularly indicators, only conduct calculations when a new tick appears. As a result, you must wait for new ticks in real-time to evaluate performance. You can provide the appropriate load and assess the program performance even on weekends when markets are closed when profiling using historical data.
Profiling Collection Methods
The performance of an application can be measured in a variety of ways. The profiler results will vary depending on the collection method employed.
At a high level, profiling in Visual Studio can be divided into the following collecting methods:
- Instrumentation
The instrumentation profiling approach captures extensive information about an application's work during a profiling run. It accomplishes this by injecting code at the start and end of each routine to track when the routine begins and ends. When a function, such as writing to a file, calls into the operating system, the technique can also detect it. - Sampling
During a profiling run, the sampling profiling approach collects statistical data about the work that an application conducts. It works by gathering data on the application at a regular interval or sampling frequency, then analysing the data to develop a model of how much time was spent in the application. - Concurrency
Multithreaded applications are profiled using the concurrency profiling method. When competing threads in an application are forced to wait for access to a shared resource, for example, it collects extensive call stack information. - Memory
Memory profiling gathers information about memory allocation and trash collection in great detail. It gathers data on the kind, size, and a number of objects generated in an allocation or destroyed during trash collection, for example. - Tier Allocation
The Tier Allocation profiling method gathers statistics about synchronous SQL Server database function calls. This profiling information can be combined with information gathered through instrumentation, sampling, concurrency, or memory approaches.
How does Profiling Works?
For profiling, the "Sampling" approach is utilised. The profiler freezes an MQL program (1000 times/second) and records the number of times a pause occurs in each code area. This involves looking at call stacks to see how much each function contributes to the overall code execution time.
You'll get information on how many times execution was interrupted and how many times each of the functions occurred on the call stack at the end of profiling:
- Total CPU [unit, %]
The number of times the function was called in the call stack. - Self-CPU [unit of measurement, %]
The total number of "pauses" that happened within the provided function. This variable is critical for locating bottlenecks: statistics show that pauses occur more frequently when more processor time is required.
(Note: Sampling is a simple and precise approach. Unlike other approaches, sampling does not make any changes to the code being studied, which could slow it down.)
What Exactly does Code Profiling do?
Developers typically utilise code profilers to uncover performance issues without having to touch their code.
These are the questions that profilers can answer:
- How many times is each function in my code called?
- How long does each of these procedures take?
- How long does each of these approaches take?
Memory allocations and trash collection are also tracked by profilers.
Some profilers can even keep track of critical methods in your code, allowing you to see how frequently SQL statements and web services are used. Furthermore, certain profilers can track web requests and train those transactions in order to better understand the performance of transactions in your code.
Code profilers can go all the way down to a single line of code. Most developers, on the other hand, only utilise profilers when they're looking for a CPU or memory problem, and they have to go out of their way to locate them.
This is due to the fact that many profilers cause applications to operate a hundred times slower than they would otherwise. While most people consider profilers as a situational tool that isn't meant to be used every day, when you need it, code profiling can be a lifesaver.
Profilers are excellent for locating the code's hot route. A good example of when to utilise a code profiler is to figure out what is utilising 20% of your code's overall CPU consumption and then figure out how to enhance it.
Profilers are also useful for detecting memory leaks early on and analysing the speed of dependent calls and transactions. Profilers assist you in identifying strategies that can lead to long-term progress.
Types of Code Profiling
Code profilers are divided into three types:
#1 Server-side Profilers
In pre-production or production environments, a server-side profiler monitors the performance of key methods. These profilers track transaction time, such as how long it takes for a web request to complete, how long a query takes, while also providing improved visibility into errors and logs. An application performance management tool, or APM for short, is an example of a server-side profiler.
#2 Desktop Profilers
These profilers are slow and have a lot of overhead, making your software operate much slower than it should. This type of profiler often keeps track of the performance of each line of code within each procedure.
Memory allocations and trash collection are also tracked by these profilers to help with memory leaks. Desktop profilers are excellent at locating the hot path, determining which methods are being called, and determining which processes use the most CPU.
#3 Hybrid Profilers
These profilers integrate crucial statistics from server-based profiling with data at the code level on your desktop for daily use. These profilers give you server-level information as well as the ability to track important methods, transactions, dependency calls, errors, and logs.
Why Should You Use a Profiling Tool?
There are a number of reasons to use a profiling tool. Perhaps you're one of the 81 percent of businesses polled by Digital Focus that use (or plan to use) an agile software development process.
Short development cycles, which typically span from two to eight weeks, are one of agile development's defining qualities. These brief cycles give limited room for code restructuring or performance improvements. As a result, programmers must ensure that code runs efficiently from the start of a project.
You might also be attempting to stay up with your customers' dwindling attention spans. Surfers might wait up to 8 seconds for a website to load, according to Business Week in 1999.
By 2006, Akamai had discovered that surfers only waited 4 seconds. According to Akamai, more than a third of online consumers who had a bad experience abandoned the site entirely, and 75% said they were unlikely to shop there again. That kind of negative publicity is unaffordable for any business.
Perhaps you're dealing with a rise in client traffic and need to make sure your system can handle it. For example, between 2005 and 2006, Amazon sales climbed by 26%. An increase of this magnitude demonstrates how important optimization is in the day-to-day operations of successful online merchants.
When one user executes a function or routine, it may reply rapidly, but what happens when hundreds or even thousands of users execute it at the same time?
Even for huge applications, code that hasn't been optimised can swiftly devolve into a performance nightmare when put under stress.
Challenges in Profiling
Despite the benefits of profiling tools, programmers have been hesitant to use them. Traditional profilers, they claim, are intrusive and difficult to use. In some circumstances, programmers discovered that some profilers impacted performance data by adding so much overhead to application execution. Instead of solving the problem, the profilers worsened it.
Low Impact
However, a new generation of profiling technologies has recently started to emerge. This generation of profilers avoids many of the flaws that affected previous generations, and it actually speeds up the optimization process.
The perfect profiling tool fits seamlessly into your development process and allows you to measure the performance of your code with precision and accuracy.
Ease of Use
Developers should select an appropriate profiler to diagnose application performance issues in their code fast and simple. If a user needs a long list of commands to complete a simple task, they will go elsewhere for a simpler solution. Developers also don't have time to configure unduly intricate tools because of the rising requirement to create high-performance applications in less time.
A profiler is supposed to help speed up the software development process, not slow it down even more. A tool like this should have a short learning curve and allow developers to start using it right away.
Multiple Measurements
An ideal profiler would let a developer profile his code in a number of ways. A developer can be confident that his code works well in a variety of areas, such as memory allocation, operating system resource utilisation, and overall application performance, with such a diverse profiling tool. Switching between these various measurements must also be quick, simple, and straightforward in order for engineers to have enough time to perform them.
Detailed Reporting
A profiler's knowledge is worthless unless it can describe it in a thorough, easy-to-understand manner. The data from the profiler, whether it's HTML pages or Microsoft Word documents, must be simple to understand. Furthermore, the reporting system must be strong, giving all of the information a developer requires while remaining flexible enough to allow the data to be filtered to display only the information that is relevant.
Why We Need a Profiling Tool?
Code optimization is difficult; it takes effort, thought, and investigation from developers. Without the right tools, programmers are forced to resort to slower, less efficient methods of optimising their applications.
Some developers do "pre-optimization," in which they predict where performance issues may arise and change their code to eliminate them before they occur. This method is problematic because a developer will frequently assess a possible bottleneck inaccurately.
They may only look at their own code, rather than the entire codebase, and so miss integration concerns. They may lack insight into the expected behaviour of their target users, or they may concentrate on a rarely used section of code.
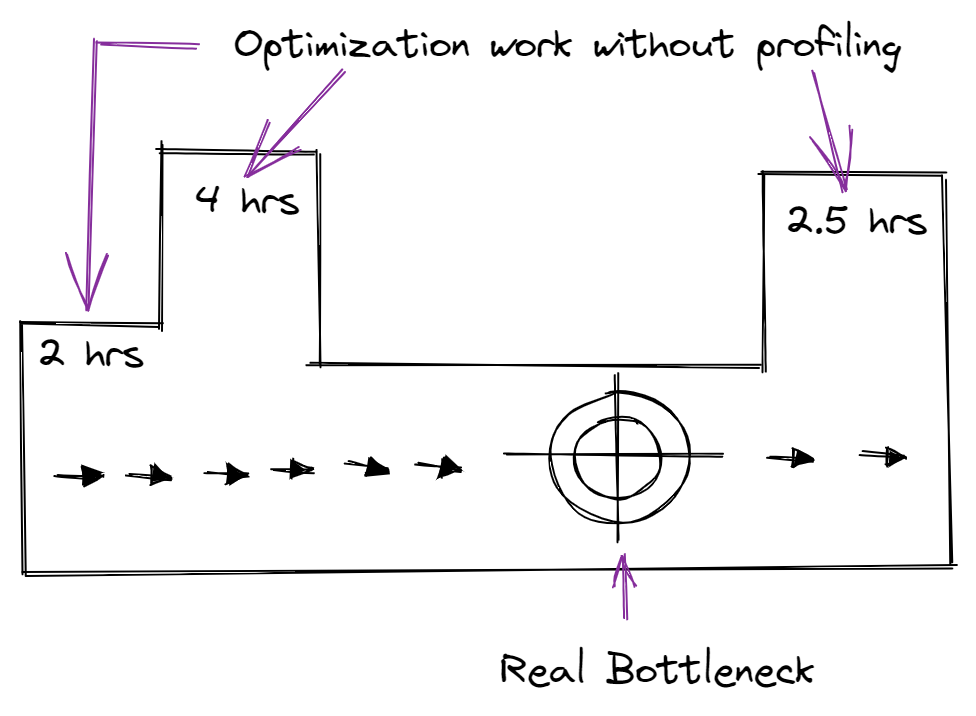
Despite its good intentions, this approach frequently fails to identify actual performance bottlenecks. Blind optimization loses time without a profiling tool to help find bottlenecks, as demonstrated in the diagram below.
It's also a terrible idea to choose not to optimise code. No end-user wants to use a slow application on a regular basis. They'll start hunting for an alternate application if they get frustrated enough.
Disgruntled customers frequently express their dissatisfaction on blogs and other message boards, pushing potential customers away from one company's products and toward another. Such harm to a company's reputation might be irreversible, costing the organisation tens of thousands of dollars in lost revenue.
"If you can improve one percent every day, over the course of a month, you'll improve by thirty percent," a previous mentor once told me. Continuous improvement over time is what actually makes a difference.
Conclusion
The success of a software company is dependent on the performance of its applications. Customers perceive an application as responsive and dependable when code executes swiftly and effectively; they see it as a time saver.
Customers, on the other hand, have a quite different reaction when code wanders into excessive loops, calls unneeded functions, or trips over itself in any other way. They may find the application slow or unresponsive, and consider it a waste of time to use it. If left unchecked, this leads to disgruntled users, a tarnished corporate reputation, and millions of dollars in income lost.
Code profiling is a powerful tool for determining where a component, method, or line of code is consuming the most resources, such as CPU and memory. This enables developers to understand the profiled application's runtime behaviour and provide practical suggestions for performance improvements.
Monitor Your Entire Application with Atatus
Atatus is an Observability Platform that lets you review problems as if they happened in your application. Instead of guessing why errors happen or asking users for screenshots and log dumps, Atatus lets you replay the session to quickly understand what went wrong.
We offer Application Performance Monitoring, Real User Monitoring, Serverless Monitoring, Logs Monitoring, Synthetic Monitoring, Uptime Monitoring, and API Analytics. It works perfectly with any application, regardless of framework, and has plugins.

Atatus can be beneficial to your business, which provides a comprehensive view of your application, including how it works, where performance bottlenecks exist, which users are most impacted, and which errors break your code for your frontend, backend, and infrastructure.
If you are not yet a Atatus customer, you can sign up for a 14-day free trial .
#1 Solution for Logs, Traces & Metrics
![]() APM
APM
![]() Kubernetes
Kubernetes
![]() Logs
Logs
![]() Synthetics
Synthetics
![]() RUM
RUM
![]() Serverless
Serverless
![]() Security
Security
![]() More
More

![Application Performance Monitoring (APM) Guide: Monitor and Optimize Application Performance - [2026 Update]](/blog/content/images/size/w960/2025/10/APM-GUIDE---Monitor-and-Optimize-Application-Performance.png)