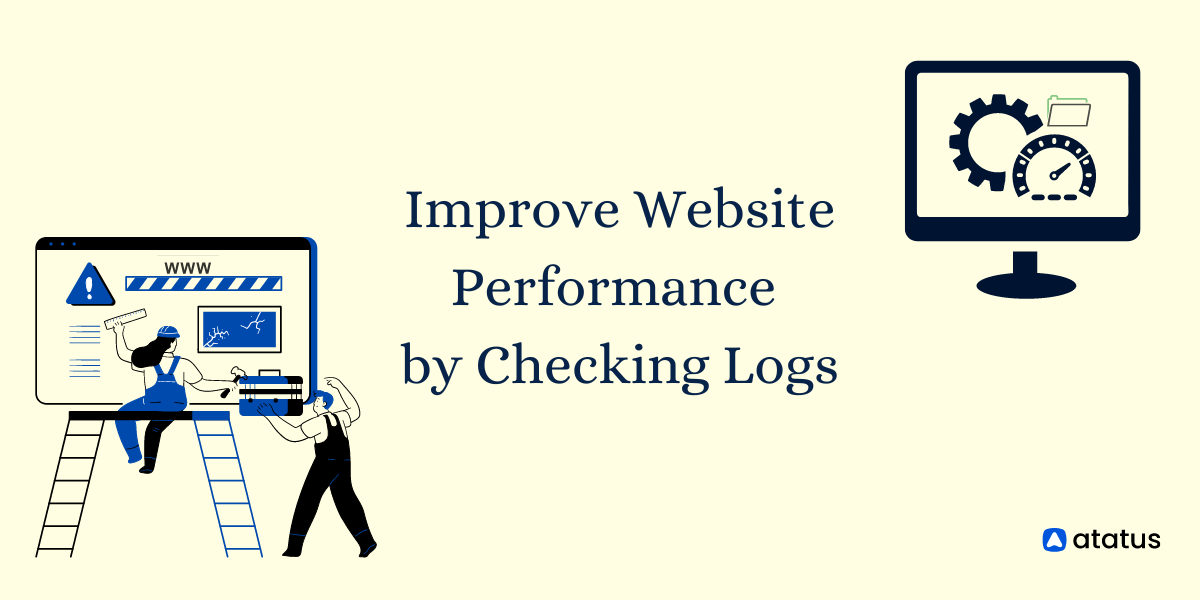
Improve Website Performance by Checking Logs
In the early days of log analysis, application developers would use their logging libraries to write logs to files stored on a disk.
After years of relying on those libraries, they found that they were unable to monitor the performance of their applications anymore because they didn’t understand the way their logging libraries worked.
This led to a shift from using log files stored on a disk to using Syslog.
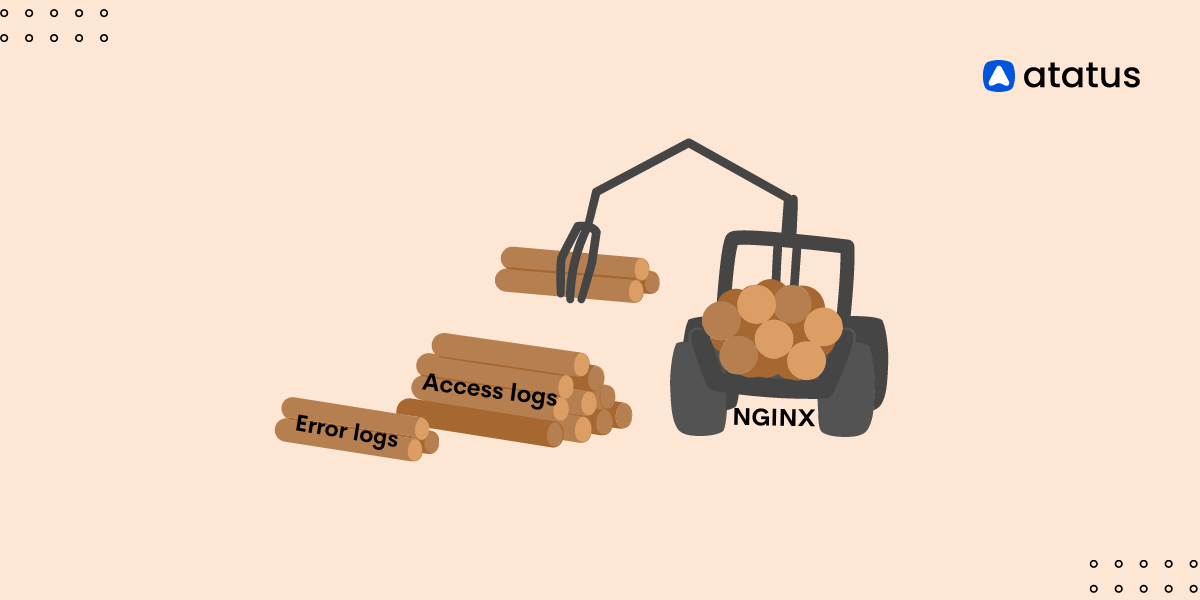
Logging websites is a powerful way of collecting information about your web application for debugging purposes.
It doesn't matter if it's a hobby project or professional software, proper logging using the right methods can provide a lot of value, and improve the user experience at the same time!
Logs are an important component of every website. They can help you identify and troubleshoot problems, monitor your traffic to improve your performance, and even figure out which pages are the most popular.
Table of Contents
- Why does your website need logs?
- Basics of Log Levels
- The Intensity of Website Logs
- Creating Intentional Log Messages
Why does your website need logs?
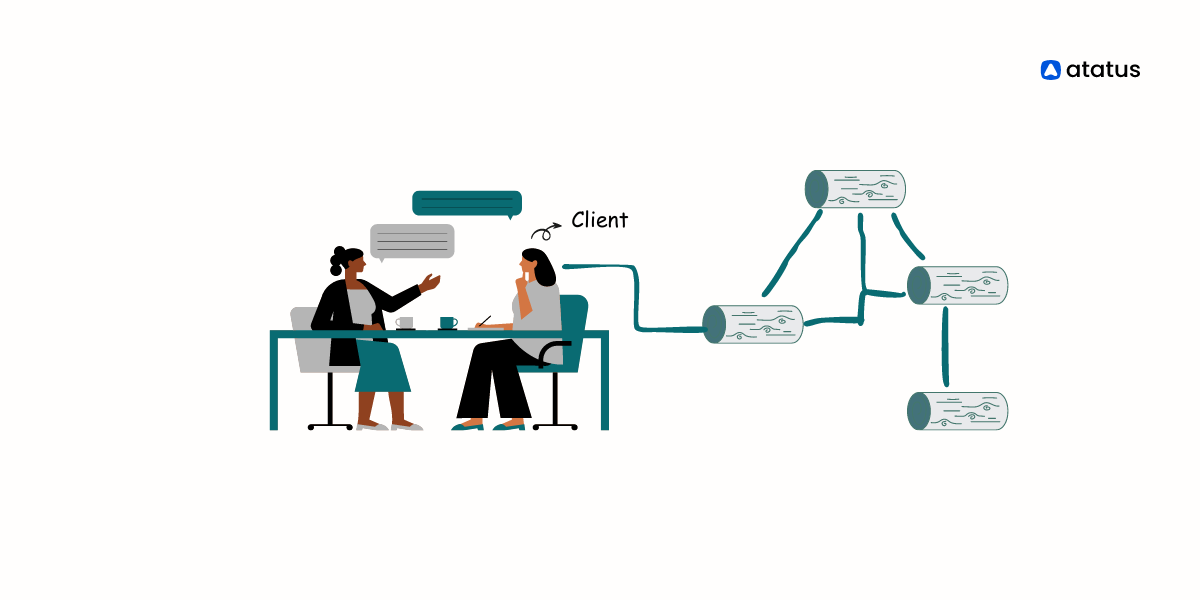
Logs are a record of what happens on your site. They contain information like how many visitors you had, how long they stayed and where they came from.
This data can determine what's working on your site and what isn't working so you can improve your performance.
For instance, if you're getting a lot of traffic from one particular search engine but not from others, then you know where to focus your efforts when it comes time to optimize your site for search engines.
If you get a lot of traffic from social media, then it's probably worth investing some time into improving those links so that you can get more visitors from social media in the future.
Basics of Log Levels
Log levels show the severity of an error message and provide a way for you to control what gets logged when there are errors in your application.
The first step to using your log levels correctly is understanding what they are. They're called levels for a reason; they form a hierarchy of importance.
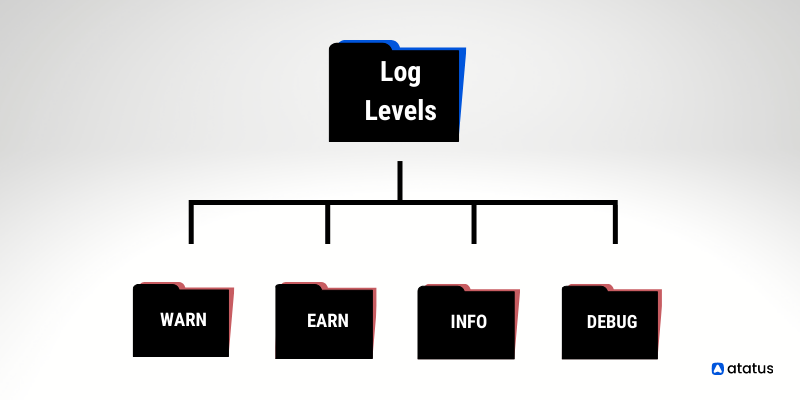
Log levels are classified into four categories: ERROR, WARN, INFO and DEBUG.
ERROR-The term ERROR means something went wrong inadequately; it's reserved for the worst of problems.
WARN - This is next on the list; these are errors that should be fixed but aren't critical enough to warrant halting the application.
INFO - The info log level captures data about informational actions performed by the system or by users. Also depicts normal activity within the website.
DEBUG - It is at the bottom of the list; it's only used when you need a little more information about why something happened or how it happened.
If your log levels are set up incorrectly, you'll do not know what's happening in your application and you might not fix any bugs that pop up.
The Intensity of Website Logs
Logging websites is a vital part of web development. It's the only way to know what your site is doing. And it can be used for a variety of purposes:
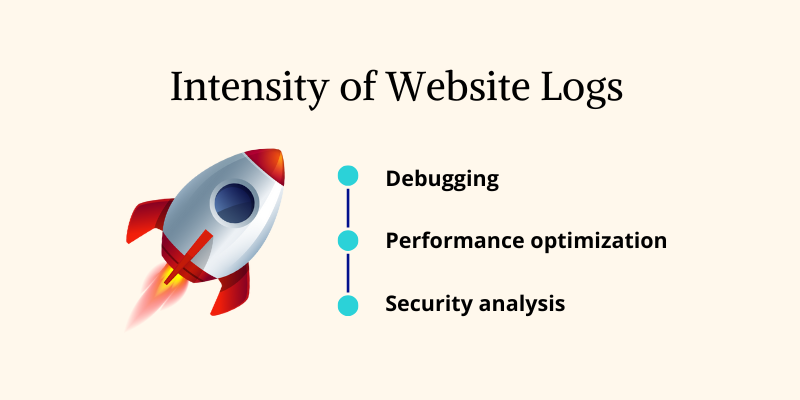
a.) Debugging
When something is broken, you need to know what happened and when it happened.
b.) Performance optimization
If the time to load a page goes from 2 seconds to 3 seconds, that's probably not a big deal.
If it goes from 2 seconds to 20 seconds, that's a serious problem! You need to find out why this is happening so you can fix it.
c.) Security analysis
In the event of a security breach or other malicious activity on your site, gather as much information as possible about what happened so you can determine if there was any damage or if there will be more malicious activities in the future.
Creating Intentional Log Messages
Imagine looking at your website's logs and finding only vague and ambiguous information. Here are a few tips to help you write better log messages:
i.) Use the right level of detail.
If you're logging a user's action, try to include as much information as possible about that action. Don't log that a user has registered if their email address is not included in the message.
ii.) Write to your audience.
If you're writing for other developers, then it's probably best to use technical terminology and avoid being too verbose or concrete. If you're writing for end-users, then keep it simple and clear.
iii.) Keep your logs clean!
It's not uncommon for developers to log things like "Failed to save user" instead of something more meaningful like "Failed to save user because they don't exist". This can make debugging difficult and wastes valuable space in your log files!
iv.) Clear and easy
Good log messages are clear and easy to understand, with a good level of detail. They should be written for your audience, and they should include important details.
Wrap-Up
Checking logs is necessary for every application, but is especially important when building a website.
That’s why we provided you with some best practices and an aid to help you deal with your error messages.
Remember to always be careful what you log and double-check your implementation.
Good logging can not only save you time by identifying issues quickly, but also provide valuable insight into how your application works.
Getting trustworthy, actionable insights from your logs can be a challenge, but it doesn't have to be.
If you plan on implementing logging for your website (and you should), then make sure to keep your logs clean and to the point.
Log Analysis With Atatus
With the Atatus Logs Monitoring platform's cost-effective, scalable approach to centralized logging, you can gain complete visibility across your entire architecture. All log data is processed in one place and can be visualized.
All high-priority incidents are reported immediately by endowing Atatus. Using error logs, custom queries, or trigger conditions, you can configure advanced alerts.

Depending on your log analysis, you may receive notifications of certain events. Logging events and slow traces can be correlated with APM errors and slow traces to simplify troubleshooting. Discover more and resolve problems faster.
Analyze, search, and filter your logs on the fly in your production environment to troubleshoot problems. From a single interface, tail across systems similar to "tail -f".
Atatus offers a free 14-day trial to streamline your log management!
#1 Solution for Logs, Traces & Metrics
![]() APM
APM
![]() Kubernetes
Kubernetes
![]() Logs
Logs
![]() Synthetics
Synthetics
![]() RUM
RUM
![]() Serverless
Serverless
![]() Security
Security
![]() More
More