Log Observability and Analytics Guide
Monitoring and analyzing log files to identify and resolve issues make up log observability. Log analytics is the process of extracting insights from log data.
Logs are a valuable source of information for IT operations teams, as they provide insight into what is happening on a system or network.
Logs can monitor system performance, troubleshoot problems, and identify security incidents. Logs are a vital part of application performance management. They provide a glimpse into what is happening in the system.
They can be generated automatically or by an application when it receives an event. Logs are collected and stored for later use.
- What is log data and its importance?
- Log Management
- How to deal with logs?
- Generate and collect log
- Log Aggregation
- Retention and storage of logs
- Querying logs
What is log data and its importance?
Log data is a record of events that occur when an application is running. Logs are generated by the operating system, databases, application servers, and other components within the software stack.
They are rendered by applications and systems and they manage information about what happened on the system, when it happened, and how it happened.
The log data is then analyzed by log analytics tools, which provide insights into what's happening with the application or system.

These insights can then decide on how to improve the performance of the application or system.
Log data can measure the performance of applications and identify problems with those applications. Log analytics is analyzing log data to identify issues in applications.
Some organizations use log data to monitor their IT infrastructure and identify potential security risks. It can also be used for debugging purposes when an error occurs during normal operation.
Log Management
A log management software service collects, analyzes, and stores the logs for almost any type of system.
This can be helpful in assessing a system’s performance and detecting when there is an issue with the system.
The fields that the logs are collected out of can be specified by an organization, which helps them maintain their own standards for the data. By specifying an organization, you help us to maintain our own standards for the data.
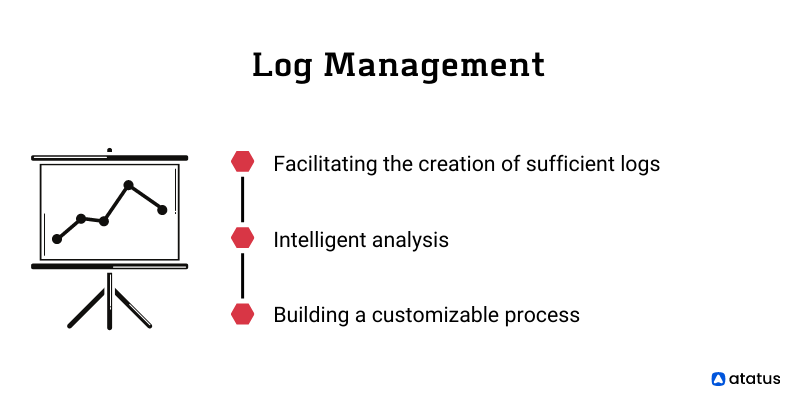
The log management practice helps organizations manage their logs by performing these tasks
- Facilitating the creation of sufficient logs to establish baseline metrics for an organization's system.
- Conducting an intelligent analysis of the logs.
- Building a customizable process for collecting, analyzing and storing logs.
How to deal with logs?
Understanding log steps is vital for log analysis and observability.
- The first step in logging is to identify the event that needs to be logged. It can be anything ranging from when a particular variable is updated to whether an error is generated or what type of connection is made by the user.
- The second step is to decide what data should be logged with this event, which could be an error or a warning message or a success message or any other type of information that might be relevant for later use.
- The subsequent step is deciding when this event should happen, for example, when errors occur or when warnings are issued.
- The fourth step is deciding how often this event should happen, for example, every time there's an error or every 5 minutes, etcetera.
- The next step is deciding where these logs should be written.
- The sixth step is deciding how long these logs should be kept.
- The seventh step is deciding who to send these logs to (or if they should be sent).
- The successive step is deciding what to do with the logs - whether they should be forwarded, deleted, or converted into graphs, etcetera. The irrevocable step is getting a log parser to parse these logs.
Generate and collect log
Log observability is a crucial component of any production system as they provide the ability to monitor and debug an application.
The system generates logs by default for almost all applications and components. The application, platform, or network must deposit logs somewhere in order to enable them.
As soon as the applications generate logs, the next logical step is to collect them for analysis.
Ideally, create a workflow to permit drawing all of this log data into one place, but it's much easier to use an application that does it for the business.
Log Aggregation
In order to diagnose logs and observe behaviour, log aggregation is significant. It is easier to analyze the performance of your system by identifying trends.
Log analysis is performed in one database, but, as mentioned above, the lack of standardization between applications will make it difficult to do so.
An important benefit of aggregating logs is that it eliminates the "noise" created by a complex system.
There are many errors in your log repository, including known errors and those caused by your latest release. Trying to find a trend by digging through gigabytes of logs will not be helpful.
Log aggregation uses machine learning to cluster logs, turning noisy dumps of data into insightful insights.
Log aggregation's template features let you customize insights and boost your observability platform.
Retention and storage of logs
The term log retention is used for archiving event logs, such as security log entries, in terms of how long you should retain the log entries.
Companies can store information about security-related activities with these entries, which refer to all cybersecurity.
Information technology specialists can acquire vital insight into their networks' activities by retaining records.
As a starting point, it's hard to know exactly which logs you want to keep and for how long. Costs also increase as you keep logs for longer time frames.
Regulations and external factors, such as cyber threats, are often considered in determining the retention period.
Longer log retention is becoming increasingly common as hackers spend longer in systems before being detected.
Querying logs
Logs provide the ability to monitor and debug an application. It’s important to make sure you have a good understanding of how your logs are created and how they’re stored in your production application.
In order to analyze the logs, then first query them. The simplest way to analyze log data is by querying the logs, but sometimes this is exactly what is needed.
In the tradition of log queries, the query structure allows you to return the results of a set number of corresponding searches.
Despite its simplicity, this can prove challenging. A log format, for instance, may be structured or unstructured. Each application will display logs differently.
Creating a broader cross-system search is more difficult because both AWS and Azure adhere to different logging standards.
Conclusion
Analyzing logs is an essential part of log management. Cyber-forensics also makes this tool valuable, as it allows for monitoring, alerting, measuring productivity, and responding to security incidents.
To summarize, log management enables troubleshooting, analysis, visualization, reporting, and alerting by making logs available. A log management solution is necessary for these.
Besides log management, observability solutions and application performance monitoring are also typically used with log management.
Analyzing computer-generated records called logs comprises reviewing, interpreting, and understanding these records.
An array of programmable technologies generates logs, such as networking devices, operating systems, and applications. Messages in a log describe the activities happening within a computer system over a period.
Log Monitoring with Atatus
With Atatus Logs Monitoring platform's cost-effective, scalable approach to centralized logging, you can gain complete visibility across your entire architecture. All log data is processed in one place and can be visualized.

All high-priority incidents are reported immediately by endowing Atatus. Using error logs, custom queries, or trigger conditions, you can configure advanced alerts.
Depending on your log analysis, you may receive notifications of certain events. Logging events and slow traces can be correlated with APM errors and slow traces to simplify troubleshooting. Discover more and resolve problems faster.
Analyze, search, and filter your logs on the fly in your production environment to troubleshoot problems. From a single interface, tail across systems similar to "tail -f".
Streamline your log analysis with the Atatus 14-day free trial!
#1 Solution for Logs, Traces & Metrics
![]() APM
APM
![]() Kubernetes
Kubernetes
![]() Logs
Logs
![]() Synthetics
Synthetics
![]() RUM
RUM
![]() Serverless
Serverless
![]() Security
Security
![]() More
More

![New Relic vs Splunk - In-depth Comparison [2026]](/blog/content/images/size/w960/2024/10/Datadog-vs-sentry--19-.png)
![Splunk vs Prometheus: A Side-by-Side Comparison [2025 Guide]](/blog/content/images/size/w960/2024/08/Datadog-vs-sentry--13-.png)
