Best New Relic Alternatives & Competitors in 2026
New Relic is a strong APM and observability platform, but it’s not always the right fit for every team. As applications grow, many users start feeling the pinch of rising costs. Others get stuck dealing with a complicated setup, a busy interface, or features they’re paying for but never actually use. After a while, these things add up, especially for teams that just want simple monitoring, predictable bills, and a tool that doesn’t slow them down.
New Relic certainly has its advantages, but for mid-sized and growing companies, these pain points often outweigh the benefits. That’s why so many teams are now exploring alternatives that offer a cleaner experience and more transparent pricing. To make that search easier, we’ve rounded up the top New Relic alternatives that solve these issues and fit a wide range of use cases.
Why are people looking for New Relic alternatives?
A lot of engineering teams are finding it harder to stick with New Relic. The same complaints keep popping up: unexpected bills, sudden pricing jumps, a slow or confusing interface, and the feeling that the platform has become heavier than it needs to be. These frustrations are pushing teams to look for monitoring tools that are simpler, faster, and easier on the budget.
On Reddit, the frustration is consistent. One DevOps engineer shared how their bill jumped from $900 to more than $8,000 overnight because of unexpected log-ingestion behavior.
NewRelic unethical billing
byu/jaxn indevops
Another thread calls out how difficult it has become to forecast New Relic’s cost structure and how the licensing model keeps shifting in ways that lock teams into higher spend.
New Relic users - what does it NOT do well?
byu/kodbuse indevops
Teams want observability that doesn’t punish growth. They want faster troubleshooting, predictable billing, and tooling that scales without the operational drag.
Here are the top New Relic alternatives worth considering in 2026, based on real user pain points and platform capabilities.
Top New Relic Alternatives in 2026
- Atatus
- Datadog
- Dynatrace
- AppDynamics
- Grafana
- ManageEngine
- Sentry
- SolarWinds
- Sumo Logic
- Instana (IBM)
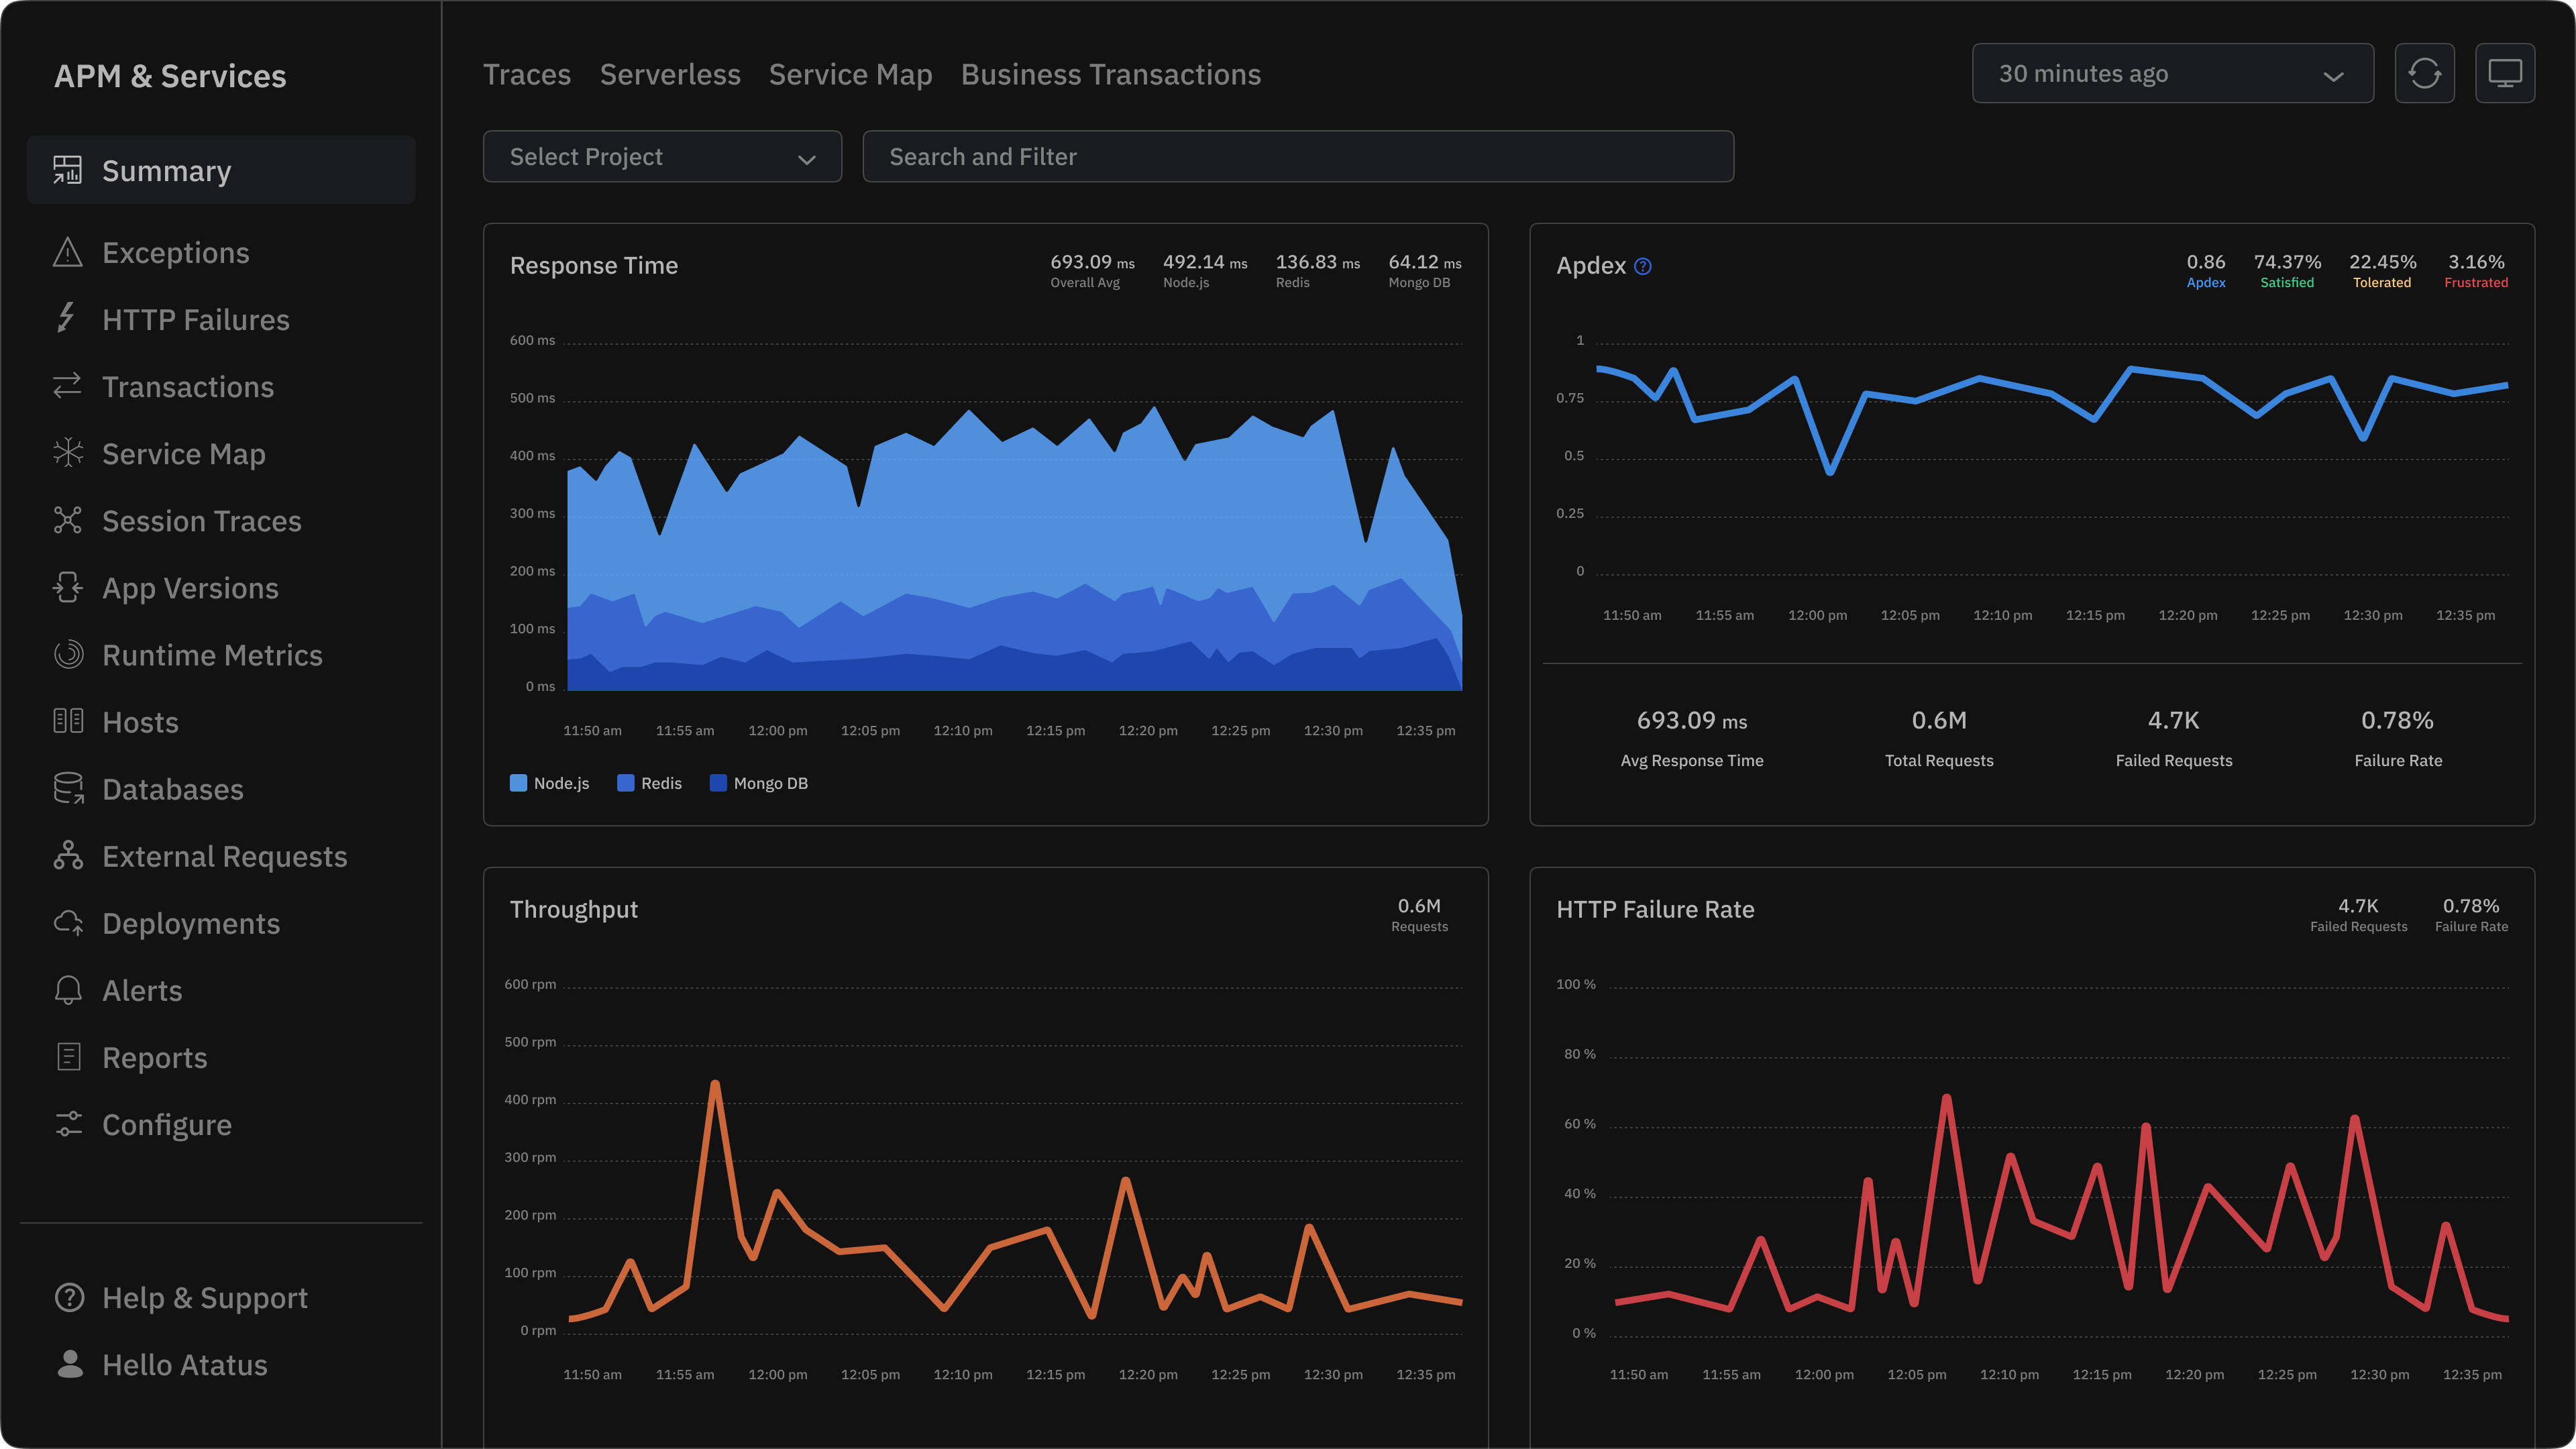
#1 Atatus (Enterprise-Ready Full Stack Observability)
Atatus is a lightweight, cost-predictable observability platform built for teams that want powerful APM, logs, RUM, and infrastructure monitoring without surprising bills.
Key Features
- End-to-end distributed tracing, code-level visibility, and transaction breakdown
- Centralized log monitoring and per-GB pricing; filter and search logs in real time
- Real User Monitoring (RUM), session tracking & synthetic checks for uptime and API performance
- Infrastructure monitoring (server/host) and Kubernetes support
- Alerts, dashboards, and custom reporting with role-based access and tagging
- Easy onboarding, automatic agent instrumentation, and multi-language SDK support
Pricing
- Transparent usage-based pricing tiers per module: host-hour pricing for APM & infra, GB/month pricing for logs. Public pricing listed here.
- 14-day free trial available per module.
Pros
- Clear, usage-based billing with predictable cost scaling
- Fully integrated platform (APM, logs, infra, RUM), minimizing vendor sprawl
- High ease-of-use and fast time to value (agents, dashboards, alerting) per user reviews
- Strong support & customer service deployment feedback on G2
- Scalability designed for enterprise needs without hidden fees
Cons
- Fewer advanced analytics or anomaly-detection capabilities
- Smaller ecosystem of integrations compared to giants
Ideal For
Mid-sized to enterprise engineering organizations looking to consolidate APM, logs, and real-user monitoring under a predictable pricing model.
G2 Real-Time Review
“Users consistently point to its strong uptime, smooth interface performance, and the simplicity of navigating day-to-day tasks.”
#2 Datadog
Datadog is a fully-fledged observability platform for cloud-native teams, offering deep integration across metrics, logs, traces, and security.
Key Features:
- Distributed tracing with APM
- Host and container metrics
- Log ingestion, search, and analytics
- Continuous profiler
- Real User Monitoring (RUM) and synthetic monitoring
- Security monitoring and anomaly detection
Pricing:
- APM: $31/host/month for the base plan
- Indexed Spans: extra cost, e.g., $1.70 per million (for some plans)
- Log ingestion: $0.10 per GB (varies by plan)
- Note: Modular pricing and costs can escalate quickly with scale.
Pros:
- Rich feature set and tight integration across observability domains
- Proven for large-scale, cloud-native environments
- Excellent dashboards and visualizations
- Strong support and community
Cons:
- Pricing complexity and potential for cost overruns
- As some users report, host-based billing can be punitive with auto-scaling.
- Log and trace ingestion can be expensive
Is Datadog Worth the Cost? 💸
Get a detailed breakdown of its pricing, hidden fees, and whether it’s the best value for your needs.
See Detailed Comparison HereIdeal For:
Organizations with large, dynamic cloud infrastructure that need a mature, all-in-one observability solution.
G2 Real-Time Review:
Many customers love Datadog’s comprehensive telemetry and integrations, but warn about unexpected cost increases if usage isn't tightly managed.
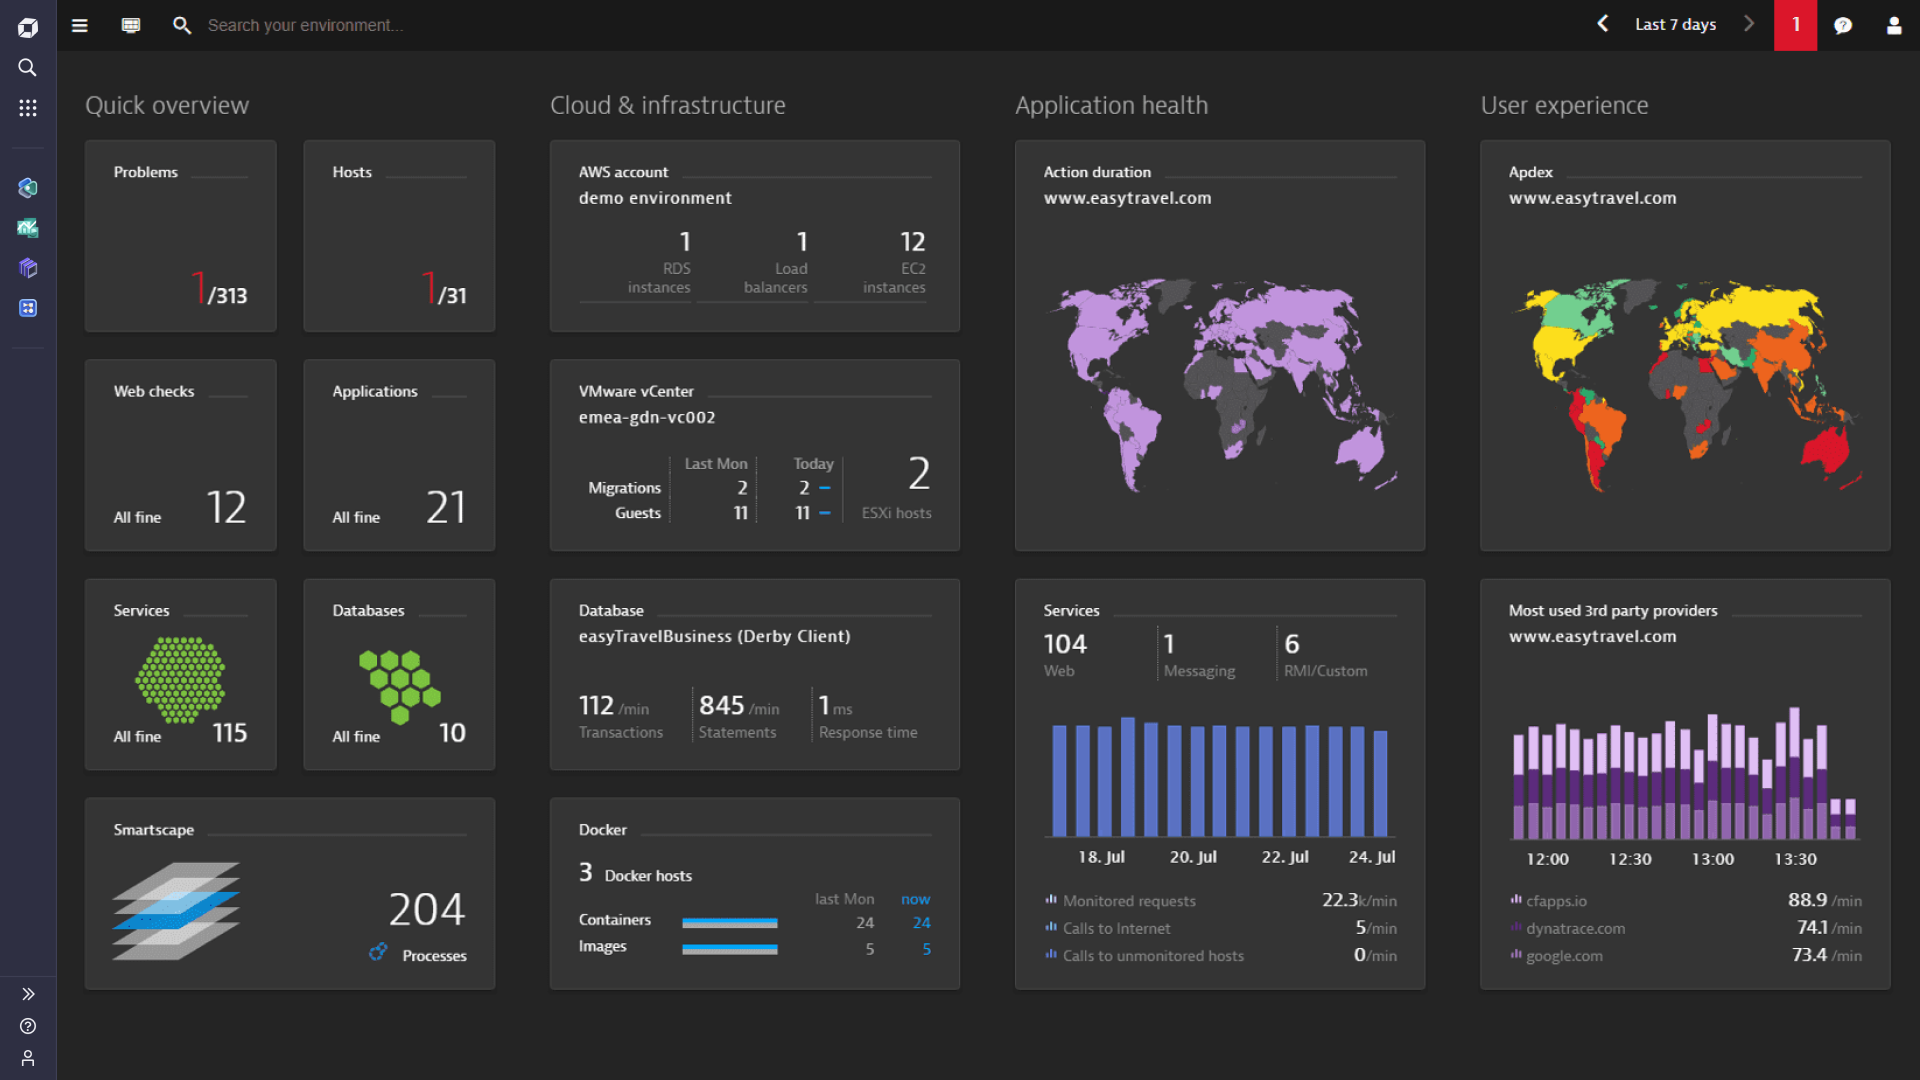
#3 Dynatrace
Dynatrace is an AI-powered, enterprise-grade observability platform with automatic topology mapping and deep root-cause analysis.
Key Features:
- OneAgent for auto-discovery of services, hosts, and containers
- Davis AI for automated root-cause detection
- Full-stack APM + infrastructure monitoring
- Kubernetes platform monitoring
- Code-level profiling and live code debugging
- Log analytics with pay-per-query or bundled models
Pricing:
- Full-Stack: $0.01 per memory-GiB-hour
- Infrastructure-only: $0.04/hour per host
- Kubernetes pods: $0.002/hour per pod
- Log ingest: $0.20 per GiB, query: $0.0035 per GiB scanned
Explore Dynatrace Pricing here
Pros:
- Highly automated: minimal manual setup for topology mapping
- Powerful AI that surfaces root causes and anomalies
- Flexible, usage-based pricing gives control
- Strong for hybrid environments and microservices
Cons:
- Can be expensive at scale or with a large memory footprint
- Complexity in advanced configurations
- Data retention costs for logs can add up
Looking for a Dynatrace Alternative? 💡
Cut your monitoring costs without compromising on power. Atatus delivers full-stack visibility at up to 4× lower cost than Dynatrace.
See Why Teams Switch from Dynatrace Transparent pricing. No surprises.Ideal For:
Large, distributed enterprises that need deep visibility and automated intelligence.
G2 Review:
Users praise Dynatrace for accurate problem detection and intelligent analysis, though some mention a steep learning curve. (G2)
#4 AppDynamics
AppDynamics is an enterprise APM solution optimized for business transaction monitoring and correlating performance with business KPIs.
Key Features:
- Business transaction mapping
- Distributed tracing
- Infrastructure & database monitoring
- Real-time user experience tracking
- Capacity planning and resource optimization
- Integration with Cisco and enterprise stacks
Pricing:
Pros:
- Excellent for correlating technical metrics with business metrics
- Rich transaction diagnostics
- Good support for enterprise-scale operations
Cons:
- Costly for small to medium deployments
- Complex setup and steep learning curve
- Less flexible for non-enterprise or cloud-native use cases
Switching from AppDynamics to Atatus? ➡️
Many teams are moving away from AppDynamics due to slow setup, rigid dashboards, and complex pricing. Atatus offers faster onboarding, flexible dashboards, and straightforward costs.
Learn Why Teams Make the Switch Transparent pricing. Real results.Ideal For:
Large enterprises that require transaction-level insights tied to business metrics.
G2 Review:
Customers often mention its strength in business transaction visibility, but note that licensing can be complex and expensive.
#5 Grafana
Grafana is an open-source, highly customizable visualization layer that can be paired with metrics, logs, and traces from many backends.
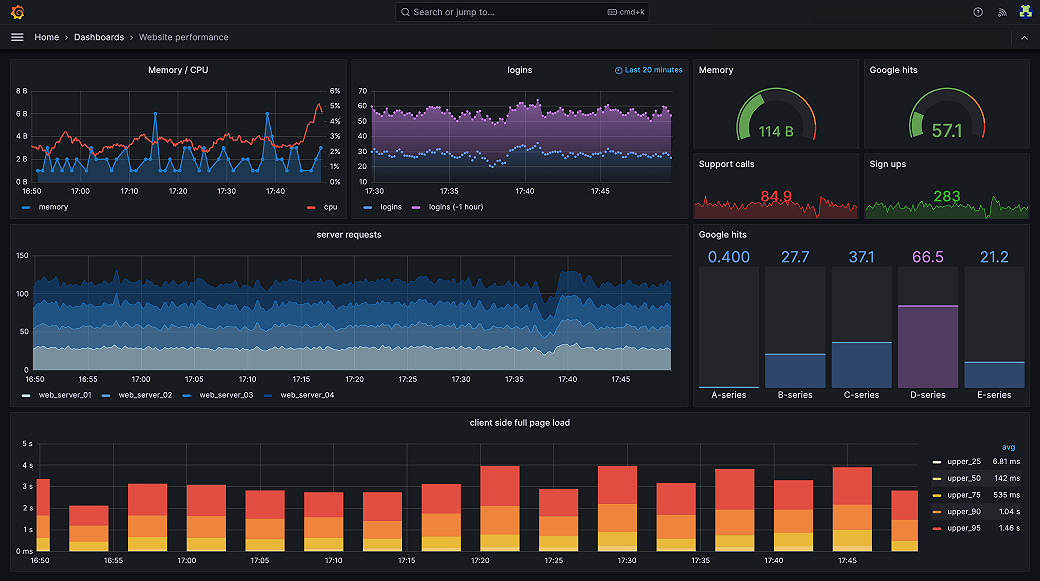
Key Features:
- Custom dashboards and panels
- Support for Prometheus, Loki (logs), Tempo (traces), and many others
- Alerting engine built in
- Grafana Cloud or self-hosted
- Plugin ecosystem for data sources and panels
- Variable-driven dashboards and templating
Pricing:
- OSS version: free (self-hosted)
- Grafana Cloud: usage-based; detailed tiers depend on data volume and retention
Pros:
- Extremely flexible and powerful visualization
- No vendor lock-in when self-hosted
- Strong community and plugin ecosystem
- Scales from small teams to large organizations
Cons:
- Requires manual setup of data ingestion (Prometheus, Loki, Tempo, etc.)
- Not a full APM out of the box (needs to be paired)
- Maintenance overhead in self-hosted mode
Ideal For:
Teams that want a flexible, open-source dashboarding solution and are comfortable with building their observability pipeline.
G2 Review:
Users consistently highlight Grafana’s powerful dashboards and customization, though some note the setup takes effort.
#6 ManageEngine
ManageEngine is a reliable enterprise monitoring solution focusing on application, server, database, and infrastructure health at a competitive price.
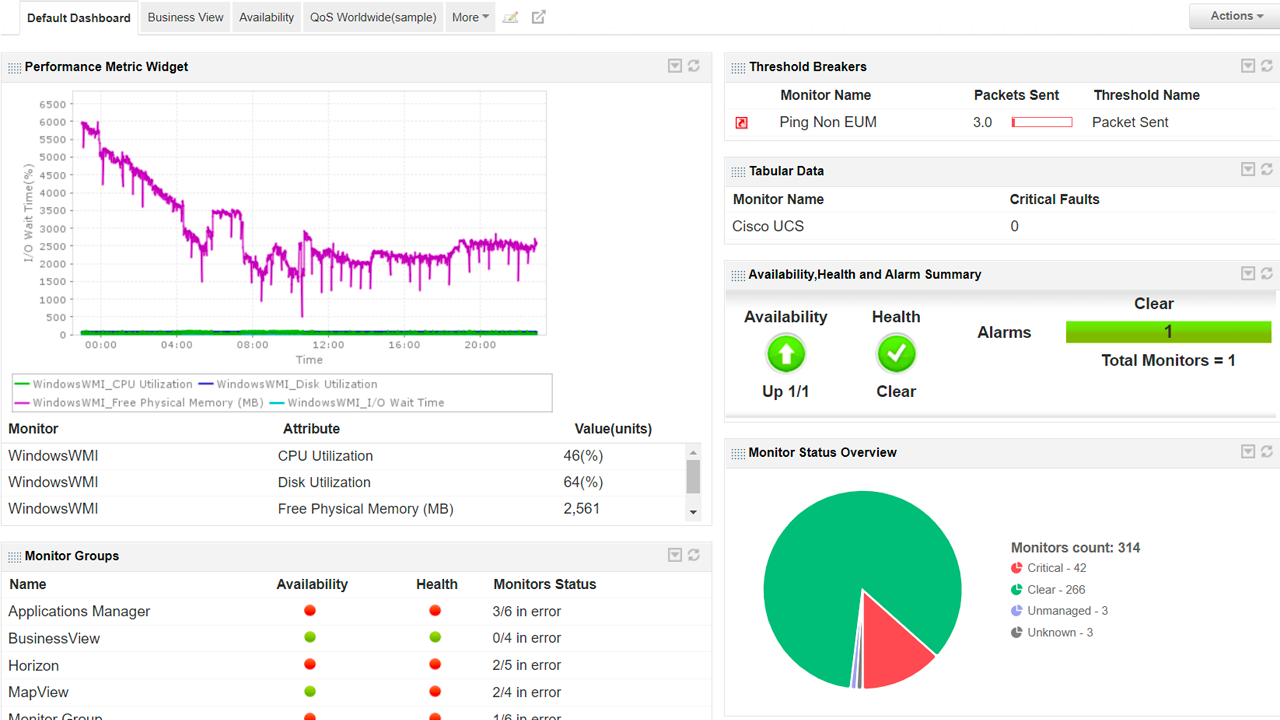
Key Features:
- Application performance tracking
- Server and database monitoring
- Network device monitoring
- Real-time alerts and customizable dashboards
- Hybrid/on-prem & cloud support
- Dependency mapping
Pricing:
- Based on the number of “monitored applications” and servers, typically enterprise-tier pricing (custom).
Pros:
- Cost-effective for enterprise monitoring
- Flexible deployment: on-prem or cloud
- Good legacy application support
- Mature product with solid support
Cons:
- UI may feel dated compared to newer SaaS observability tools
- Less focus on distributed tracing / modern microservices out of the box
- Scaling large environments may require careful planning
Ideal For:
Enterprises with mixed infrastructure (legacy + cloud) that need solid, affordable monitoring.
G2 Real-Time Review:
Users appreciate its stability, coverage across infrastructure and application, and good ROI relative to legacy monitoring tools.
#7 Sentry
Sentry is a developer-focused error tracking and performance monitoring, ideal for application-level observability and tracing.
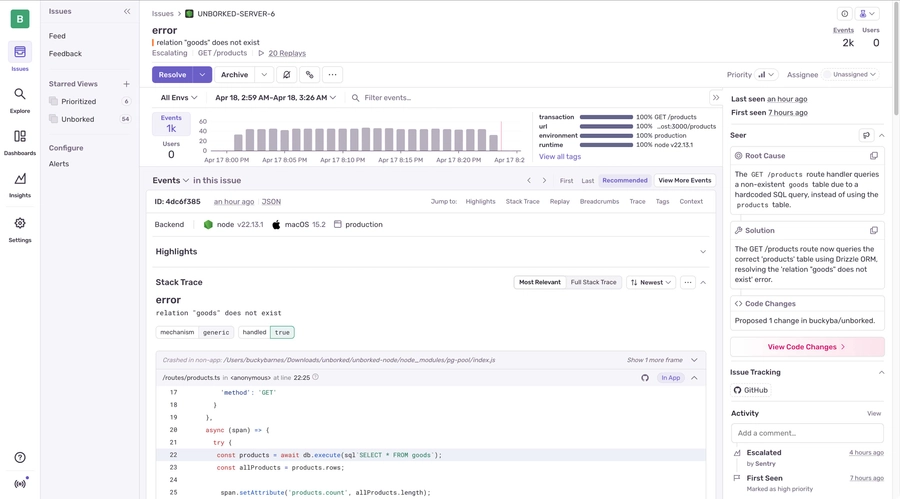
Key Features:
- Error and exception tracking
- Performance monitoring/traces
- Release health & version tracking
- Breadcrumbs for context in errors
- Integration with many frameworks & languages
- Self-hosted or SaaS
Pricing:
- Free-tier available
- Paid plans based on event volume, data retention, and number of users (varies by plan)
Pros:
- Very developer-friendly, integrates into the dev workflow
- Excellent for tracing slow transactions & error root cause
- Lightweight, minimal overhead
- Open-source option available
Cons:
- Not as strong on infrastructure or log monitoring
- May lack some enterprise-scale capabilities
- Retention and volume-based costs can grow
Looking Beyond Sentry? ➡️
Sentry is great for error tracking, but it doesn’t provide full-stack observability. Atatus brings logs, metrics, traces, and errors together in one platform to give you complete visibility across your entire system.
Discover Why Teams Switch from Sentry Save costs • Simplify setup • Get 360° visibilityIdeal For:
Dev teams that need insight into code-level errors, performance regressions, and release impact.
G2 Real-Time Review:
Developers often praise Sentry’s ability to pinpoint errors quickly, but some mention costs rising with error volume.
#8 SolarWinds
Traditional IT-focused monitoring tool that combines APM and infrastructure monitoring, optimized for hybrid environments.
Key Features:
- Server & application monitoring
- Dependency mapping
- Synthetic monitoring (via AppOptics)
- Profiling / code-level insights (AppOptics)
- Custom dashboards and alerting
- Hybrid deployment support
Pricing:
- SolarWinds APM buyer’s guide indicates per-host and container-based pricing.
- Often licensed per host; container pricing varies
Pros:
- Familiar and mature toolset for legacy IT teams
- Lower cost for infrastructure-heavy environments
- Good support for traditional on-prem workloads
- Proven track record in enterprise monitoring
Cons:
- Less SaaS-native than modern observability tools
- UI can feel less modern or flexible
- Scaling to cloud-native workloads may be cumbersome
Ideal For:
Organizations with a strong on-prem server footprint and older applications, or those looking to modernize gradually.
G2 Real-Time Review:
Users find SolarWinds solid for infrastructure and server monitoring, but say that the APM features don't match more modern observability platforms.
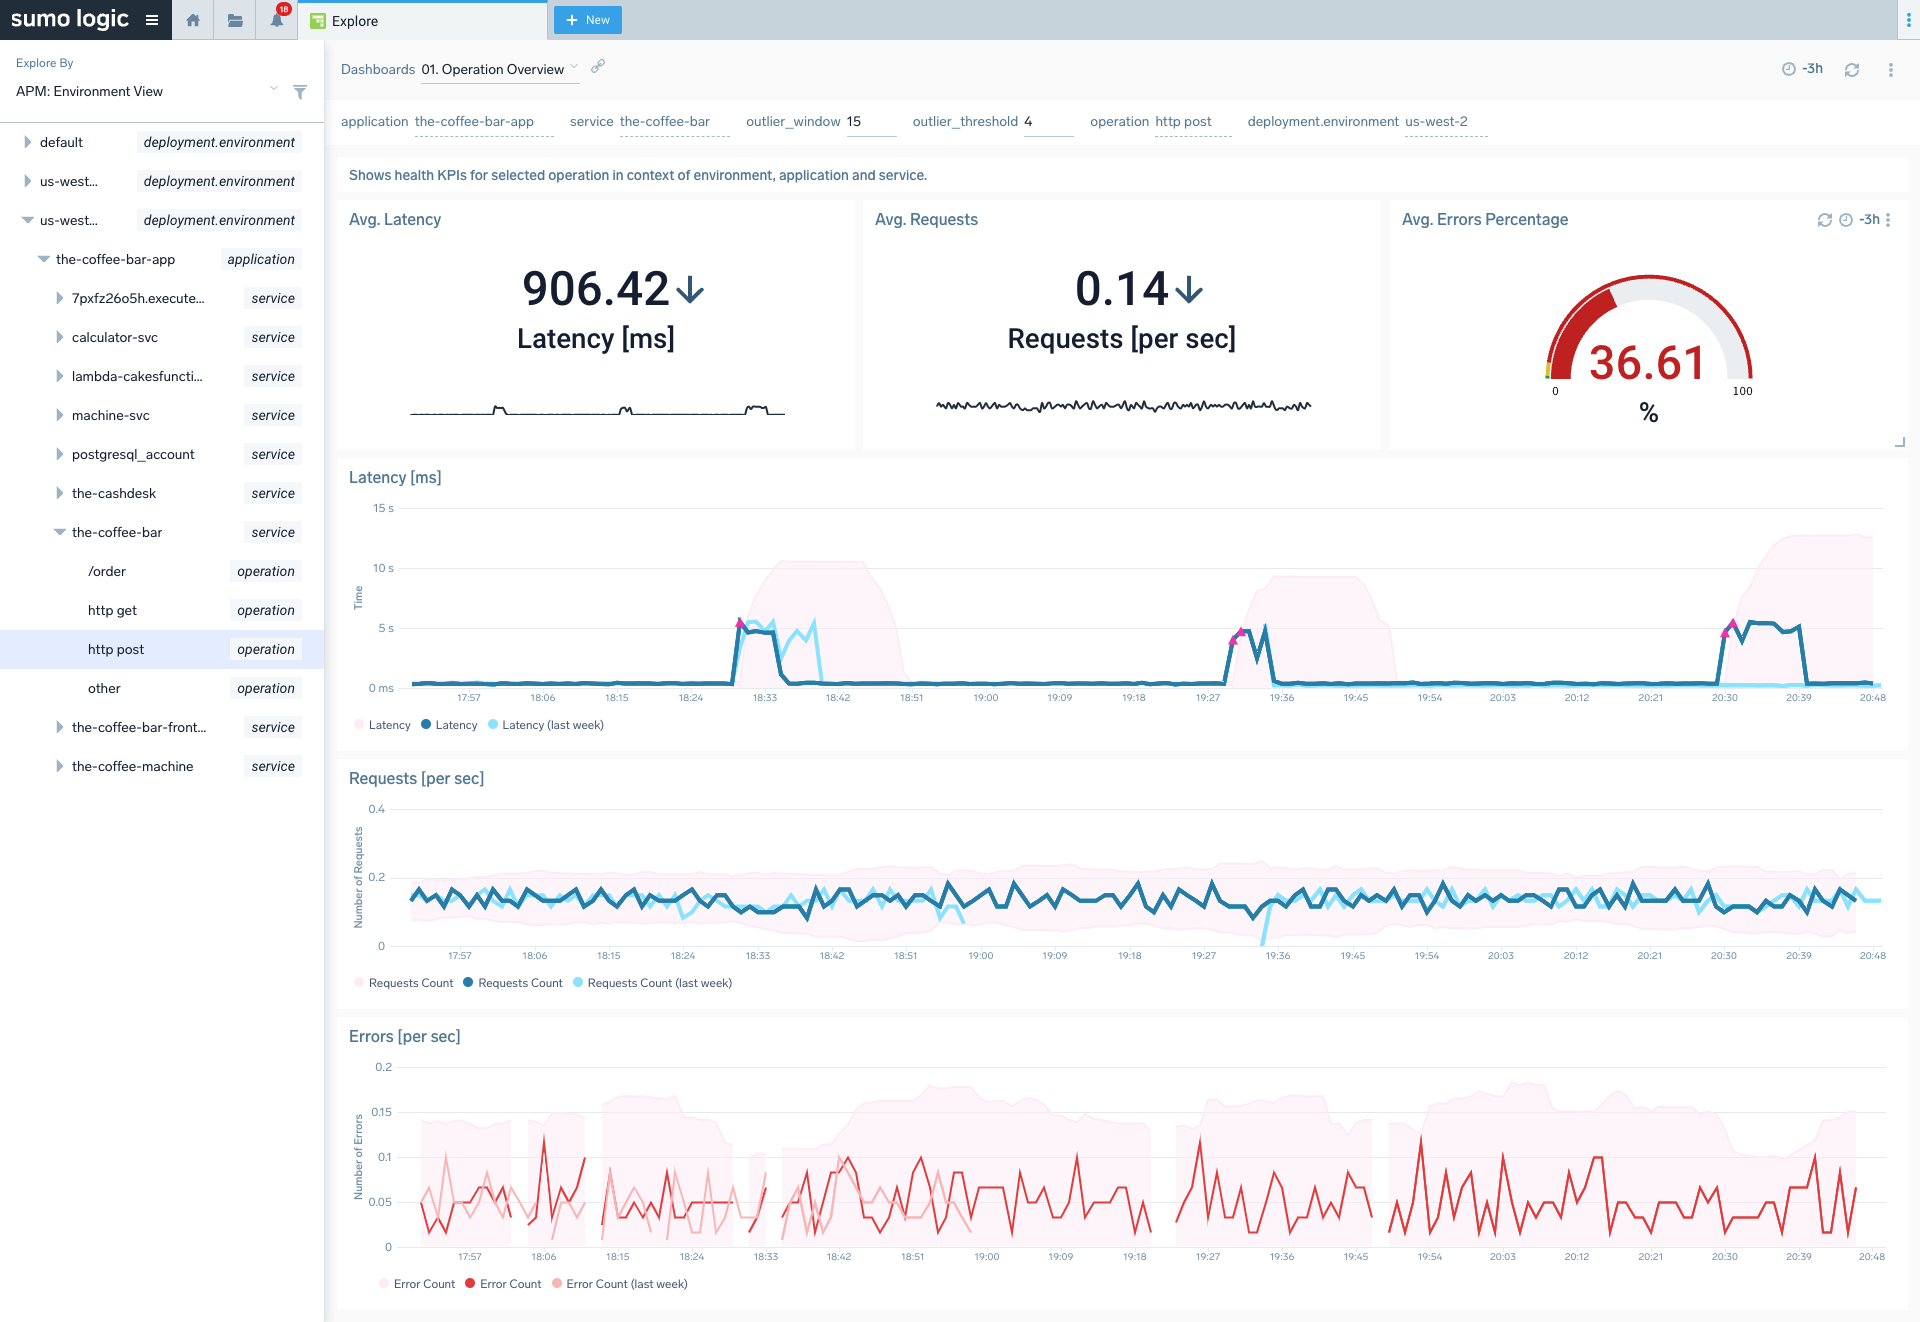
#9 Sumo Logic
Sumo Logic is a cloud-native analytics platform focused on log management, security analytics, and observability at scale.
Key Features:
- Log ingestion and indexing
- Real-time analytics and alerting
- Metrics and distributed tracing
- Machine learning–powered anomaly detection
- Dashboards and customized queries
- Security and compliance modules
Pricing:
- Based on data volume, retention, and query usage (custom pricing for enterprise)
Pros:
- Scalable log analytics and observability
- Strong for security analytics and compliance
- SaaS delivered, minimal infrastructure maintenance
- Useful ML insights for anomalies
Cons:
- Potentially high cost for large log volumes
- Complexity in managing queries and retention
- Not optimized for lightweight APM-only use cases
Ideal For:
Large enterprises that need a combined observability + security analytics platform with strong log capabilities.
G2 Real-Time Review:
Users highlight Sumo Logic’s powerful log analytics and flexibility, but some warn of high costs when scaling ingestion.
#10 Instana (IBM)
An automated APM solution from IBM, built for dynamic microservices environments and containerized workloads.
Key Features:
- Automatic service discovery via agent
- Real-time distributed tracing
- Infrastructure and cloud observability
- Code-level insights and profiling
- Automated root-cause analysis
- Support for modern architectures (Kubernetes, serverless)
Pricing:
- Usually custom, IBM offers enterprise pricing based on data volume, hosts, and services used
Pros:
- Very good for microservices and containerized environments
- Minimal manual instrumentation required
- Powerful real-time tracing
- Excellent for root-cause analysis
Cons:
- It can be expensive for smaller teams
- Less transparent pricing publicly
- Steeper learning curve for non-DevOps users
Ideal For:
Large organizations running microservices or modern cloud-native workloads who want deep automated observability.
G2 Real-Time Review:
Reviewers like Instana’s auto-discovery and tracing, but note that the enterprise price can be steep.
Final Thoughts
If you’re struggling with New Relic billing surprises, complex pricing, or difficulty justifying ROI, switching to a more cost-transparent and predictable observability platform is a smart move.
- Choose Atatus if you want a simple, affordable, usage-based APM + logging + infra monitoring suite.
- Pick Datadog or Dynatrace if you need enterprise-grade scale, advanced analytics, and deep-trace visibility.
- Go open-source with Prometheus + Grafana, if you value control and flexibility over vendor lock-in.
By evaluating your telemetry volume, host count, and long-term growth plan, you can pick a New Relic alternative that actually delivers value without the billing nightmares.
Try Atatus - Your high-value New Relic alternative
Access real-time observability with powerful dashboards and fast setup while avoiding unpredictable bills. Get complete visibility across apps, logs, metrics, and traces and start seeing value in minutes.
Start Monitoring in Minutes Free trial • Transparent usage pricingFAQs About New Relic Alternatives
1) Why are people looking for New Relic alternatives?
Users are moving away due to rising costs, complex billing, locked-in pricing tiers, and performance overhead. Many teams want simpler pricing and faster, lighter agents.
2) Which tool is the closest to New Relic in terms of features?
Atatus matches New Relic most closely with APM, logs, infra metrics, distributed tracing, RUM, and uptime monitoring in a single platform without the pricing complexity.
3) What is the best alternative to New Relic in 2026?
There’s no one-size-fits-all “best,” but Atatus often leads the pack for teams prioritizing predictability, full-stack observability, and usage-based pricing. According to Atatus, it can be up to 4× more cost-effective than New Relic while offering APM, logs, infrastructure monitoring, and RUM. That said, other top contenders include Datadog (for mature, cloud-native environments), Dynatrace (for enterprise-grade AI-driven root-cause analysis), and ManageEngine Applications Manager (for low-surprise licensing and hybrid/on-prem support).
4) Which monitoring tools are cheaper than New Relic?
Some of the more affordable or cost-predictable New Relic alternatives are:
- Atatus: Transparent usage-based pricing, no per-user surprises. ManageEngine Applications Manager: Their licensing is based on infrastructure or applications, not on data volume, helping to control cost spikes.
- SolarWinds AppOptics / APM Integrated Experience: They position themselves as “affordable monitoring without breaking the bank.”
- Open-source options (e.g., Prometheus + Grafana): No licensing fees; costs come from infrastructure and maintenance rather than data ingestion.
5) What’s the best alternative to New Relic for PHP applications?
For PHP workloads, Atatus stands out thanks to deep transaction tracing, DB visibility, error tracking, logs, and infra monitoring optimized specifically for PHP environments.
#1 Solution for Logs, Traces & Metrics
![]() APM
APM
![]() Kubernetes
Kubernetes
![]() Logs
Logs
![]() Synthetics
Synthetics
![]() RUM
RUM
![]() Serverless
Serverless
![]() Security
Security
![]() More
More


