
Top 6 Dynatrace Competitors and Alternatives for Modern Observability in 2026
If you're reading this, something about Dynatrace probably isn't working for you anymore, the invoice landed higher than expected, a new engineer spent their first week just figuring out the UI, or you're paying for host-unit pricing on workloads that barely move the needle. You're not alone. Teams evaluate Dynatrace alternatives for a handful of very specific, very common reasons: cost predictability, implementation speed, dashboard flexibility, and Kubernetes/cloud-native support that doesn't require a consulting engagement to configure.
This guide gives you an honest, side-by-side look at the six most-searched Dynatrace alternatives including where Dynatrace itself still wins, so you can make a defensible decision, not just a fast one. We built Atatus specifically to solve the problems that send people looking for a Dynatrace alternative in the first place: transparent per-host pricing, a setup measured in minutes instead of weeks, and one unified view across APM, infrastructure, logs, traces, RUM, and Kubernetes. Where that's genuinely the right fit for you, we'll say so. Where it isn't, we'll say that too.
Table of Contents:
- Signs you've outgrown Dynatrace
- Dynatrace vs. Atatus at a glance
- 6 Dynatrace alternatives, compared in depth
- Why teams switch from Dynatrace? (the ROI case)
- Migrating from Dynatrace to Atatus
- Questions to ask before you choose
- FAQ
Signs you've outgrown Dynatrace
Not every team needs to switch. But if two or more of these sound familiar, it's worth actively evaluating alternatives rather than renewing on autopilot:
- Your bill grows faster than your infrastructure. Host-unit and DEM-unit pricing can scale in ways that are hard to predict at budgeting time.
- New engineers take days, not hours, to get comfortable. Dynatrace's depth is powerful, but it comes with a real learning curve for teams without a dedicated observability engineer.
- You're paying for capabilities you don't use. Enterprise-bundled pricing often includes AI/root-cause modules smaller teams never fully activate.
- Dashboard and query customization feels limiting compared to what your team actually wants to build.
- You're running Kubernetes-heavy or serverless workloads and want monitoring that was designed cloud-native from the start, not retrofitted.
- You want one bill and one login for APM, logs, RUM, and infrastructure instead of managing multiple modules and SKUs.
💬 Not sure if switching is worth it yet? Book a 20-minute call and we'll map your current Dynatrace setup against Atatus, no pressure, no generic sales deck.
Dynatrace vs. Atatus
| Dynatrace | Atatus | |
|---|---|---|
| Pricing model | Host-unit + DEM-unit consumption pricing; can be complex to forecast | Transparent per-host / per-user plans, published pricing page |
| Setup time | Days to weeks for full-stack rollout | Minutes to hours with agent-based install |
| Learning curve | Steep — extensive config options, dedicated training often needed | Low — guided onboarding, pre-built dashboards |
| Full-stack coverage | APM, infra, logs, RUM, synthetics (via separate modules) | APM, infra, logs, traces, RUM, synthetics, Kubernetes, error tracking — unified |
| AI-powered insights | Davis AI (deep causal AI engine) | AI-assisted anomaly detection and alerting |
| Kubernetes monitoring | Strong, but adds setup complexity | Native, streamlined K8s dashboards out of the box |
| Best for | Large enterprises needing deep causal AI and unified DEM | Growing engineering teams that want enterprise-grade visibility without enterprise overhead |
To be transparent: Dynatrace's Davis AI causal engine is genuinely deep, and very large enterprises with dedicated observability teams may still find it the right fit. This comparison is about where most mid-market and growth-stage teams land in practice.
6 Dynatrace alternatives, compared in depth
Here's how each of the six most commonly evaluated Dynatrace competitors actually stacks up, not just what they say about themselves.
#1 Atatus - Best value for full-stack observability
Best for: Engineering teams that want Dynatrace-level visibility across APM, infrastructure, logs, traces, RUM, and Kubernetes without enterprise pricing or a multi-week rollout.
Pros
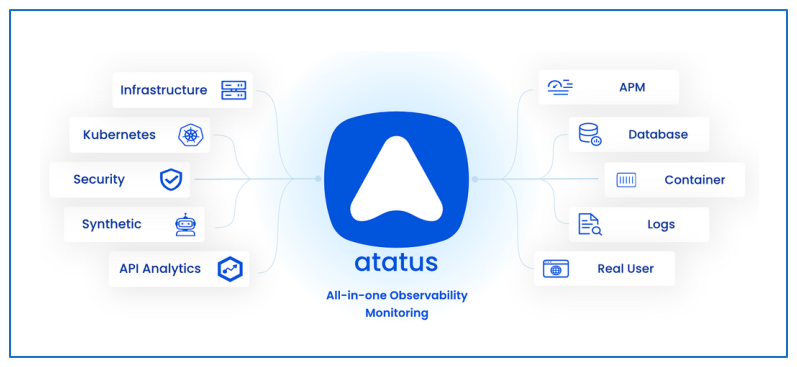
- Unified platform: APM, infra, logs, traces, RUM, API analytics, synthetics, and Kubernetes in one login
- Fast, agent-based setup; teams are typically seeing data the same day
- Transparent, published pricing with no hidden consumption units
- Clean, low-friction dashboards that don't require training to read
- OpenTelemetry-compatible ingestion
Cons
- Newer causal-AI capabilities than Dynatrace's long-established Davis AI engine
Not an Atatus customer yet?
Get enterprise-grade application performance monitoring, infrastructure monitoring, log management, and real user monitoring without the complexity or unpredictable costs. Try Atatus free or talk to our team about migrating from Dynatrace.
2. Datadog
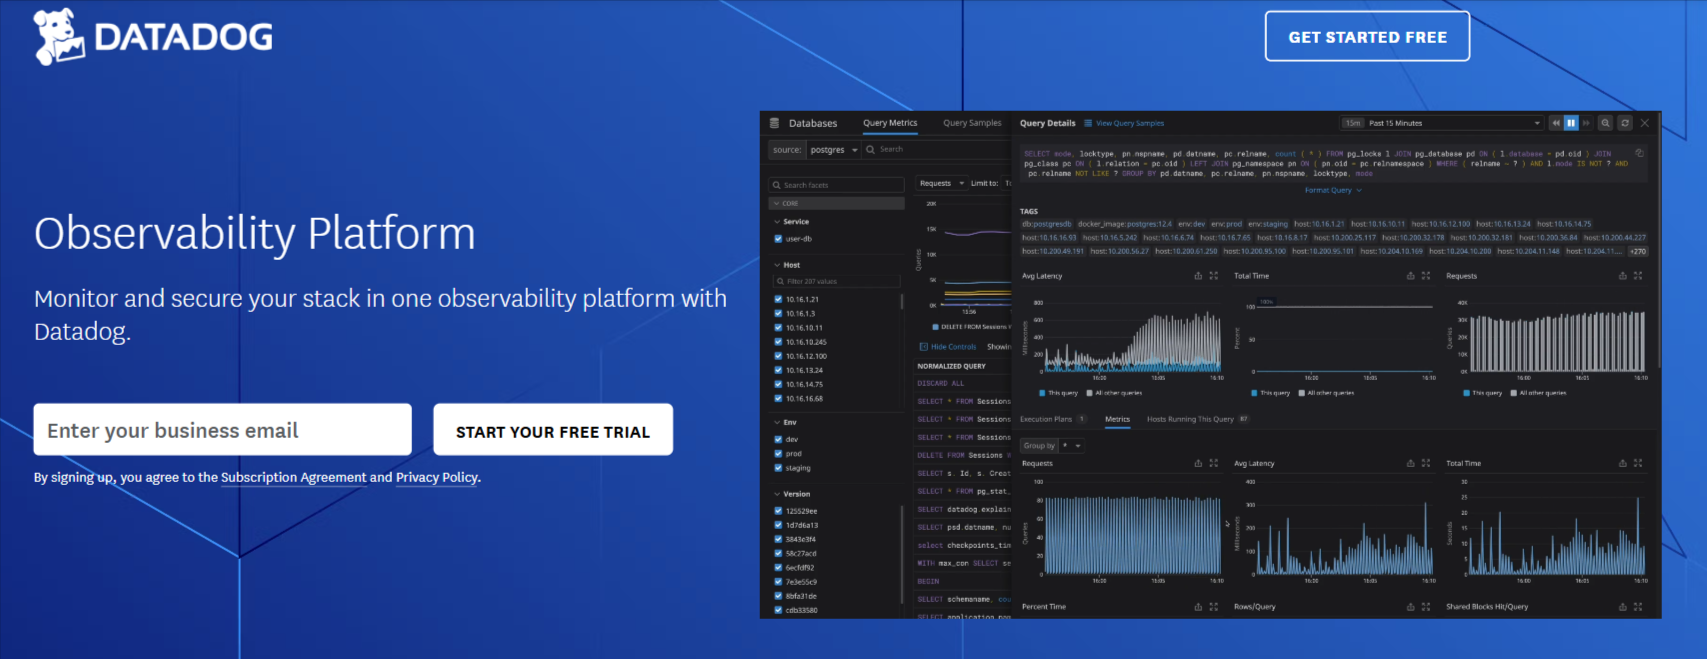
Datadog, an alternative to Dynatrace, is a popular monitoring and analytics platform that covers a wide range of observability needs, from infrastructure to application performance. It is especially favoured by organizations operating in cloud-native environments.
Best for: Cloud-native teams already deep in AWS/GCP/Azure who want one vendor for infra, APM, and security monitoring.
Pros
- Very broad integration catalog (600+)
- Strong AI-powered anomaly detection (Watchdog)
- Scales well across highly distributed systems
Cons
- Per-feature, per-host billing can escalate quickly as you add modules
- Cost forecasting is a common complaint at renewal time
- Dashboard sprawl can get hard to govern at scale
3. New Relic
New Relic, a good alternative to Dynatrace, is one of the most established players in the observability space, offering in-depth insights into application performance and infrastructure.
Best for: Teams prioritizing deep APM and custom dashboarding over unified infra/log coverage.
Pros
- Excellent code-level APM depth
- Highly customizable dashboards (NRQL)
- Consumption-based pricing can be cost-efficient for smaller data volumes
Cons
- Costs can climb quickly as data ingest grows
- Query language (NRQL) has its own learning curve
- Fewer native infra/Kubernetes conveniences than more unified platforms
4. Splunk
Splunk is best known for its log management and analytics capabilities but has expanded its offerings to provide a more complete observability solution. It is frequently used by teams focusing on security, compliance, and operational intelligence.
Best for: Security- and compliance-driven organizations with heavy log volumes.
Pros
- Best-in-class log search and analytics
- Strong security/compliance tooling
- Scales to very high data volumes
Cons
- Among the most expensive options at scale
- Requires dedicated expertise to manage and tune
- Steepest learning curve of the group
5. AppDynamics
AppDynamics, a Cisco-owned product, offers enterprise-grade application performance monitoring (APM) and monitoring of distributed systems.
Best for: Large enterprises needing deep business-transaction monitoring (Cisco-owned).
Pros
- Strong business-transaction-level visibility
- Deep code-level diagnostics
- Mature full-stack monitoring capabilities
Cons
- Enterprise-tier pricing, often bundled through Cisco contracts
- Feature depth can be more than smaller teams need
- Setup typically needs vendor or partner involvement
6. Elastic Observability
Elastic Observability leverages the popular Elastic Stack (formerly known as ELK Stack) for log, metric, and trace analysis, providing a unified view of your system’s health.
Best for: Teams already invested in the Elastic Stack wanting an open, flexible foundation.
Pros
- Open-source foundation, high flexibility
- Strong search/analytics engine at scale
- Centralized logs, metrics, and traces
Cons
- Requires real operational investment to run and tune
- Self-managed option needs dedicated infra ownership
- Steeper setup curve than SaaS-first alternatives
Why teams switch from Dynatrace?
Across the switching conversations we have with engineering leaders, a few reasons come up consistently:
- Reduced observability spend - moving from consumption-based host/DEM pricing to transparent per-host plans.
- Faster onboarding - new engineers reach dashboard fluency in hours, not days, thanks to a simpler UI and pre-built views.
- Less engineering effort to maintain - fewer modules to configure and govern across teams.
- Easier troubleshooting - a single correlated view across logs, traces, and metrics instead of pivoting between modules.
- Better developer productivity - less time spent learning query languages and dashboard tooling, more time shipping.
- Faster incident resolution - unified context (logs + traces + infra) shortens the path from alert to root cause.
Migrating from Dynatrace to Atatus
Migration risk is usually the single biggest reason teams delay switching, even when they're already convinced on price and features. Here's what the process actually looks like.
Migration steps
- Discovery call: map your current Dynatrace setup — hosts, services, dashboards, alert rules — with an Atatus solutions engineer.
- Parallel install: deploy the Atatus agent (or OpenTelemetry collector) alongside your existing Dynatrace OneAgent — no need to remove Dynatrace on day one.
- Validation period: run both platforms in parallel for a short window to confirm data parity across APM, infra, and logs.
- Dashboard & alert recreation: rebuild critical dashboards and alert thresholds in Atatus (see below).
- Cutover: once your team is confident, decommission Dynatrace agents and finalize on Atatus.
Data migration considerations
- Historical Dynatrace data (long-term trend history) typically isn't ported automatically — plan for a parallel-run window rather than a full historical import.
- OpenTelemetry-instrumented services generally migrate with minimal code changes since both platforms support OTel ingestion.
- Custom metrics and business transactions may need manual mapping if they rely on Dynatrace-specific tagging conventions.
Agent installation
Atatus agents install per-host or per-service (language-specific APM agents for Node.js, Java, Python, .NET, Ruby, Go, PHP, and more, plus a Kubernetes DaemonSet for cluster-wide monitoring). Most teams complete initial agent rollout in hours, not days.
Dashboard recreation
Atatus provides pre-built dashboard templates for common stacks, plus a drag-and-drop dashboard builder so your team can recreate Dynatrace views without starting from a blank canvas. [INSERT: link to dashboard import/template gallery if available].
Support provided
- Dedicated onboarding support during migration (not just a knowledge base)
- Solutions engineer assistance for alert-rule and dashboard parity
- Documentation and API access for teams that want to automate parts of the migration
Estimated migration timeline
| Team size / complexity | Typical timeline |
|---|---|
| Small team, single stack | 1–3 days |
| Mid-size team, multiple services | 1–2 weeks |
| Large/enterprise, multi-cluster Kubernetes | 2–4 weeks (parallel-run recommended) |
Common concerns
- "Will we lose visibility during the switch?" No — the recommended parallel-run approach means Dynatrace stays active until you've validated Atatus data.
- "What about our custom alert rules?" These are recreated with a solutions engineer during onboarding, not left for your team to reverse-engineer alone.
- "Is this a multi-month project?" For most mid-market teams, no — full cutover typically lands within 1–2 weeks.
Considering the switch but want a clear picture of effort and timeline first?
Get a personalized migration assessment from our experts. We'll review your current Dynatrace setup, estimate the migration effort and timeline, and help you transition to Atatus with minimal disruption.
Questions to ask before you choose
- Is pricing based on hosts, data volume, or a hybrid consumption model and can I model my costs at 2x current scale?
- How long does a realistic implementation take for a team our size?
- Does the platform unify APM, infra, logs, traces, and RUM, or will I be paying for and managing separate modules?
- Does it support OpenTelemetry natively, so I'm not locked into a proprietary agent long-term?
- What does onboarding and migration support actually look like self-serve docs, or a dedicated engineer?
- How steep is the learning curve for engineers who aren't observability specialists?
FAQ
Is migrating from Dynatrace difficult?
Not typically. A parallel-run migration where Atatus runs alongside Dynatrace during validation, minimizes risk and downtime. Most mid-market teams complete a full cutover within 1–2 weeks.
How long does migration take?
It depends on team size and complexity: 1–3 days for a small single-stack team, 1–2 weeks for a mid-size team, and 2–4 weeks for large, multi-cluster Kubernetes environments.
Can Atatus import my dashboards?
Dashboards are recreated using pre-built templates and a drag-and-drop builder rather than a direct 1:1 import, since dashboard structures differ between platforms. Our onboarding team helps rebuild critical views during migration.
Does Atatus support Kubernetes?
Yes. Atatus includes native Kubernetes monitoring via a cluster-wide agent, with pre-built dashboards for nodes, pods, and workloads.
Does Atatus support OpenTelemetry?
Yes. Atatus accepts OpenTelemetry-instrumented data, which also simplifies migration for services already instrumented with OTel under Dynatrace.
How does pricing compare to Dynatrace?
Dynatrace uses host-unit and DEM-unit consumption pricing that can be difficult to forecast as usage grows. Atatus publishes transparent per-host/per-user pricing on its pricing page, see the comparison table above for a side-by-side view.
Is there a free trial?
Yes, Atatus offers a 14-day free trial with no credit card required. Start your trial here.
#1 Solution for Logs, Traces & Metrics
 APM
APM
Kubernetes
Logs
Synthetics
RUM
Serverless
Security
More


![Datadog vs Splunk: A Side-by-Side Comparison [2026]](/blog/content/images/size/w960/2024/12/Untitled-design--41-.png)