An Introduction to PromQL: How to Write Simple Queries

PromQL is a flexible language designed to make it easy for users to perform ad-hoc queries against their data. By default, Prometheus indexes all of the fields in each metric except for source and target, which are not indexed by default.
Prometheus is an open-source tool that lets you monitor Kubernetes clusters and applications. It collects data from monitoring targets by scraping metrics HTTP endpoints.
Once Prometheus has scraped data, you can perform queries on it using PromQL, Prometheus’s built-in query language.
PromQL queries are used to retrieve data from your Prometheus servers. They can be used for different purposes:
- Retrieving data from a single server
- Retrieving data across multiple servers
- Interpreting the data returned by the PromQL query
- PromQL syntax
What is PromQL?
PromQL is a query language for Prometheus, an open-source monitoring system. It allows users to select and aggregate time-series data to generate meaningful information about their systems.
It is easy to use and provides a flexible way to query data. With PromQL, you can ask questions such as "what is the average response time for my services?" or "how many requests are currently being served?"
It is a vital tool that can help you to better understand your system performance and identify potential issues.
It can be used to generate a wide variety of reports. It can be used to track system performance, identify bottlenecks, and pinpoint areas of improvement. In addition, PromQL can be used to generate custom reports that are not possible with other monitoring systems.
PromQL syntax follows the same rules as SQL. The main difference is that you can use different operators in PromQL than you can in SQL.
Features of Prometheus
Prometheus is a powerful monitoring system that can be used to track and query data. However, it can be challenging to learn PromQL, the query language used by Prometheus. In this tutorial, we will share five tips to help you become a Prometheus.
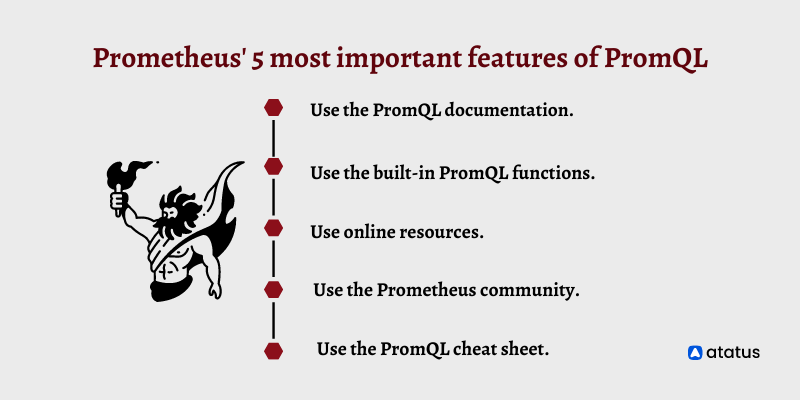
1. Use the PromQL documentation.
The best way to learn PromQL is to consult the official documentation. This will give you a clear understanding of the syntax and semantics of the language.
2. Use the built-in PromQL functions.
Prometheus comes with several built-in functions that can be used to manipulate data. These functions can be very helpful when you're trying to figure out how to query data.
3. Use online resources.
Several online resources can be used to learn PromQL. These resources can be very helpful in understanding how to use the language.
4. Use the Prometheus community.
The Prometheus community is a great resource for learning PromQL. Some active users are willing to help you with your questions.
5. Use the PromQL cheat sheet.
The PromQL cheat sheet is a great resource for learning the basics of PromQL. This cheat sheet provides a quick reference for the most important parts of the language.
Metric Types
There are four main metric types in Prometheus: Counter, Gauge, Histogram, and Summary. Each has its own benefits and drawbacks, so it's important to understand when to use each one.
- Counter
- Gauge
- Histogram
- Summary
1. Counter
A counter is a cumulative metric that represents a single monotonically increasing counter whose value can only increase or reset to zero on restart. They are the simplest of the metric types and are used to track how many times something occurs.
For example, you could use a counter to track the number of requests made to a web server.
How can I query counter?
To calculate the average request duration within the last 10 minutes:
rate(request_duration_sum[10m])
/
rate(request_duration_count[10m])
2. Gauge
A gauge is a metric that represents a single numerical value that can arbitrarily go up and down. By default, any new time series added to a Prometheus server are registered as gauges.
Gauges are used to track instantaneous values, such as the number of currently active users on a system or the current temperature in a room.
How can I query a gauge?
To query the average of the queue size:
avg_over_time(queue_size[5m])3. Histogram
A histogram samples observations (usually things like request durations or response sizes) and counts them in configurable buckets. It also provides a sum of all observed values.
It tracks how often values occur within a certain range. For example, a histogram could be used to track the response time of requests to a web server.
Histograms with base metrics of basename> expose multiple time series during scraping:
- An observation bucket's cumulative counters, exposed as
<basename>_bucket{le="<upper inclusive bound>"} - Sum of all observed values, exposed as
<basename>_sum - the count of events that have been observed, exposed as
<basename>_count(identical to<basename>_bucket{le="+Inf"}above)
How can I query a histogram?
To query the request duration sum of last 5 minutes:
rate(request_duration_sum[5m]) / rate(request_duration_count[5m])histogram_quantile(0.95, sum(rate(request_duration_bucket[5m])) by (le))4. Summary
Summaries track the same information as histograms, but also provide information about the median and 90th percentile of values which is used to monitor latencies.
Using summary, you can monitor the REST endpoint, for example. A 95th percentile is calculated if 95% of the calls are 120 milliseconds faster than the average, and 5% are 120 milliseconds slower.
With a base metric name of <basename> exposes multiple time series:
- Quantile streams
(0 ≤ φ ≤ 1)of observed events, exposed as<basename>{quantile="<φ>"} - Summation of all observed values, exposed as
<basename>_sum - Based on the number of events observed, this value is displayed as
<basename>_count
How do I query a summary?
To query the request duration summary of last 5 minutes:
rate(request_duration_summary_sum[5m]) / rate(request_duration_summary_count[5m])To query the request duration summary of last 5 minutes with quantile:
request_duration_summary{quantile="0.95"}To visualize:
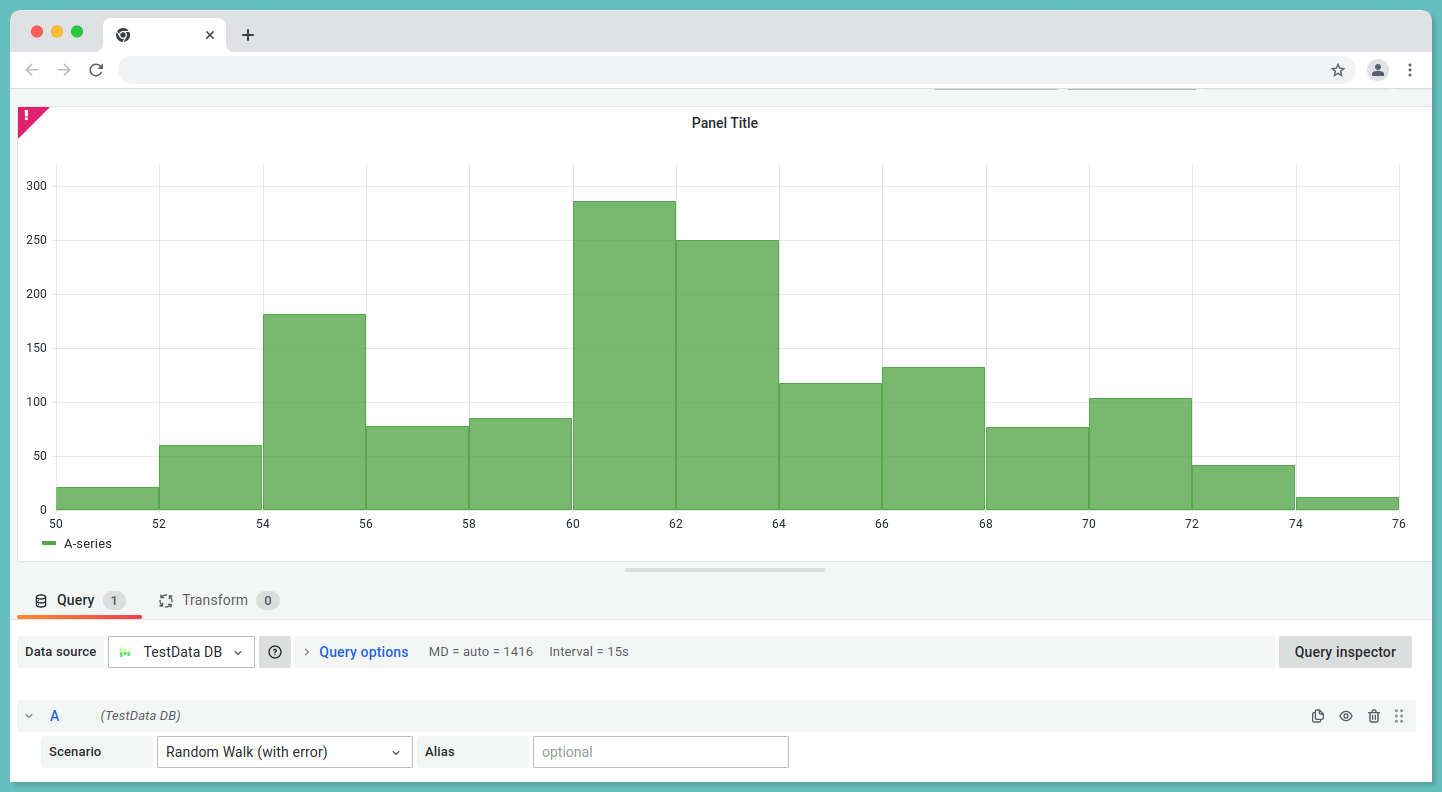
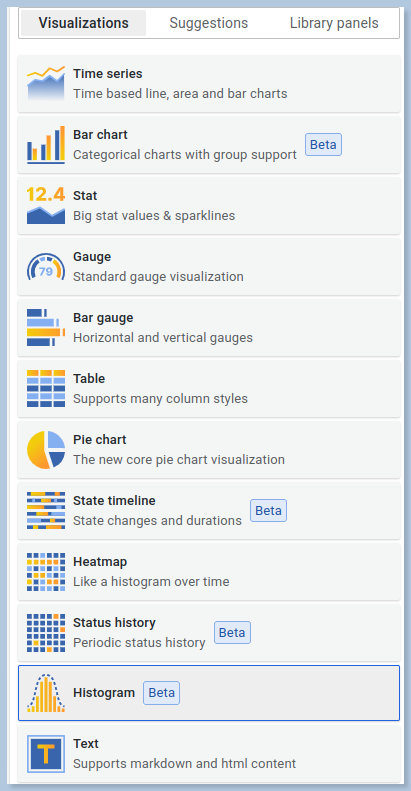
- Create a New Dashboard.
- In the top right corner, you will be able to view the chart visualization such as bar chart, time series and so on.
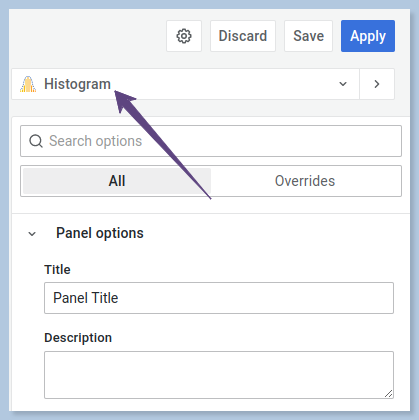
- Click on the drop down and select the type of the chart as you prefer from the options provided in Grafana.
Data types of PromQL
There are four different data types in PromQL.
- Scalar
- Range Vector
- Instant Vector
1. Scalar
Scalar data is the most basic data type in PromQL. It consists of a single value, such as a number, string, or boolean. In PromQL, a scalar is represented by a floating-point number.
Scalar data is useful for representing simple values, such as the number of requests per second, the size of a response, or the amount of time spent in a query.
e.g, 32.162. Range Vector
A range vector represents a set of time series data points where every timestamp maps to a “range” of data points, recorded some duration into the past.
You can use range vectors to calculate things like the average value of a metric over a time period. It is most commonly used in Graphs.
3. Instant Vector
Data does not come to Prometheus at the same time. Time series with an instant vector have a single sample for each series and share the same timestamp.
Another way of putting it is that an instant vector encompasses zero or more time series. The time series will have one sample, which includes both the value and timestamp of the time series.
Prometheus Operators
Prometheus supports basic binary, logical and aggregation operators.
Binary Operators
Binary operators are an important part of PromQL, and can be used to perform mathematical operations on PromQL expressions. There are three different types of binary operators:
- Arithmetic binary operator
- Comparison binary operator
- Logical/set binary operator
i.) Arithmetic binary operator
Arithmetic operators helps you to perform addition, subtraction, division, multiplication, exponentiation and modulus operations. It takes two operands and perform the operation based on the operator.
Prometheus supports the following arithmetic operators:
- (+) - addition
- (-) - subraction
- (*) - multiplication
- (/) - division
- (%) - modulus
- (^) - exponentiation or power
// addition
prometheus_http_requests_total + 2

// subtraction
prometheus_http_requests_total - 2

// multiplication
prometheus_http_requests_total * 2

// division
prometheus_http_requests_total / 2

// modulus
prometheus_http_requests_total % 2

// exponentiation
prometheus_http_requests_total ^ 2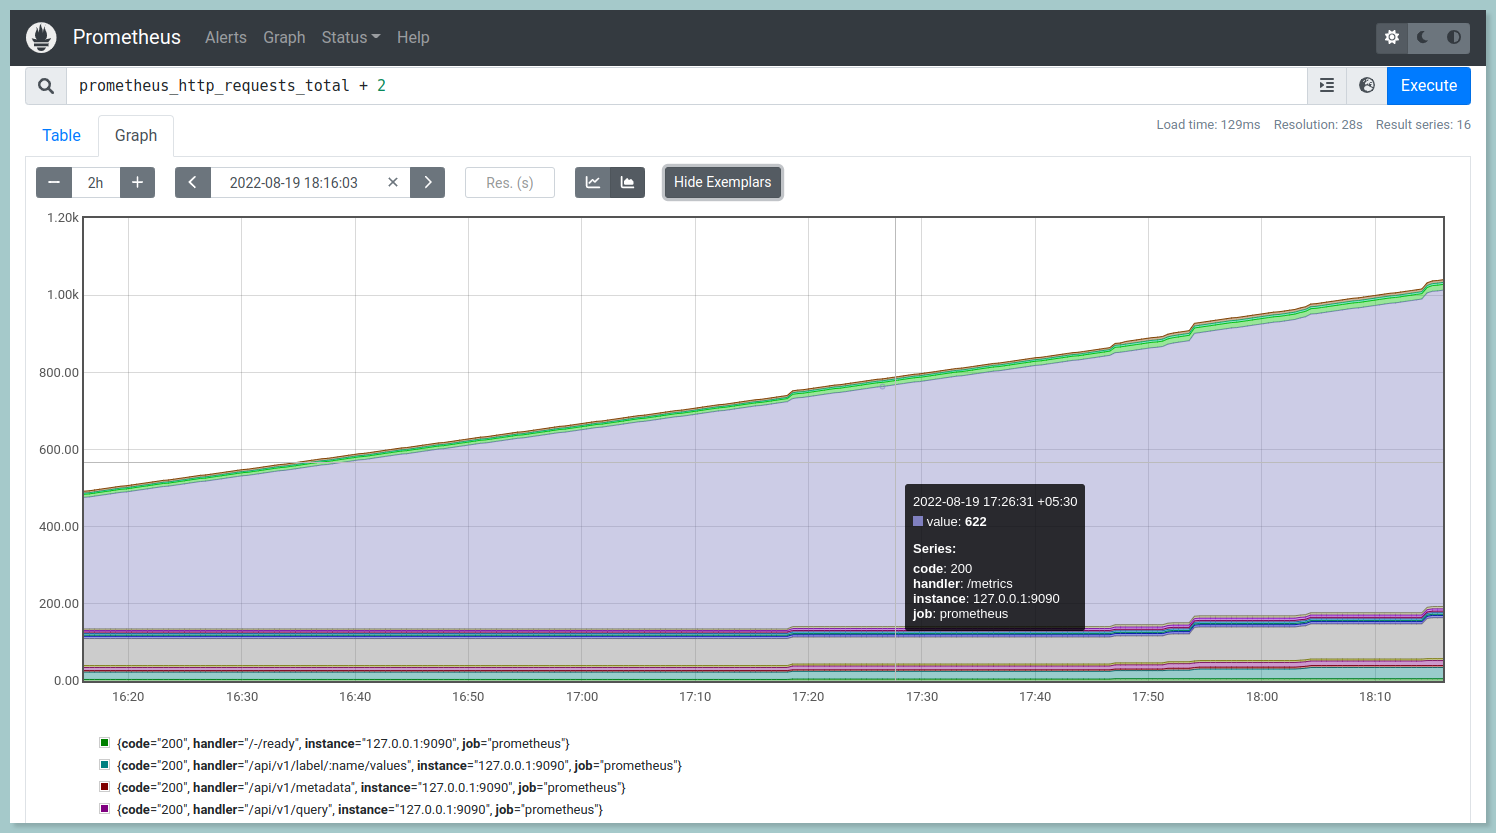
ii.) Comparision binary operator
Comparison operators can be used to check whether a given value is equal to, not equal to, greater than, less than, or greater than or equal to another value. It contains different types of comparison operators:
- == (equal)
- != (not-equal)
- > (greater-than)
- < (less-than)
- >= (greater-or-equal)
- <= (less-or-equal)
demo_api_request_duration_seconds_count > 274438
demo_api_request_duration_seconds_count < 274438
demo_api_request_duration_seconds_count == 274438
demo_api_request_duration_seconds_count != 274438
demo_api_request_duration_seconds_count >= 274438
demo_api_request_duration_seconds_count <= 274438
iii.) Logical/Set Binary Operators
Logical operators are a fundamental part of PromQL, the query language for the Prometheus monitoring system. They allow you to combine multiple queries into a single query, and to filter the results of a query based on certain conditions.
These logical/set binary operators are only defined between instant vectors:
a.) Logical operator - and
The combination of vector1 and vector2 results in a vector containing elements from vector1 whose label sets match exactly those of vector2. Elements other than these are dropped. The left-hand side vector carries over the metric name and values.
b.) Logical operator - or
A vector containing vector1 and vector2 contains all original elements (label sets + values) and additionally all elements of vector2 without matching label sets in vector1.
c.) Logical operator - unless
Vector2 unless vector1 yields a vector containing the elements of vector1 for which vector2 does not have matching label sets. Both vectors are discarded if they contain any matching elements.
Prometheus Installation
Installing Prometheus requires a few simple steps. Follow the below steps to get up and running quickly.
Step 1:
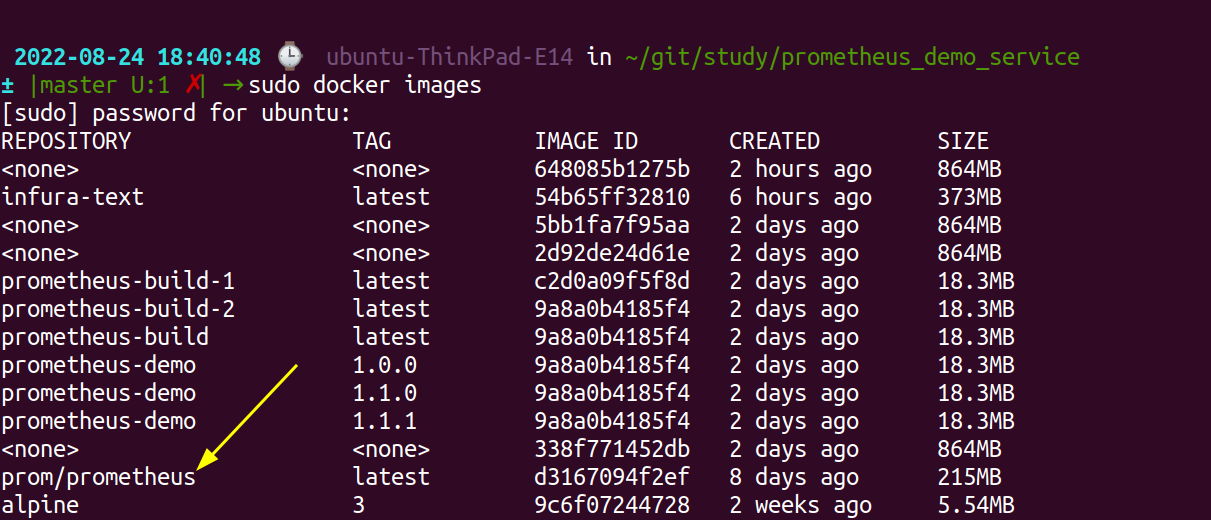
Download the docker image for Prometheus using the docker pull command:
docker pull prom/prometheusTo ensure the docker image has been pulled use the below command:
docker imagesYou will be able to view the image name - prom/prometheus
Step 2:
Create a file under the name prometheus.yml to configure Prometheus and add the following contents.
sudo vi prometheus.yml# Scrape the three demo service instances every 5 seconds.
global:
scrape_interval: 5s
scrape_configs:
- job_name: 'demo'
static_configs:
- targets: ['your_ip:9090', 'your_ip:8080', 'your_ip:8082', 'your_ip:8083']Save and exit the vi editor.
Step 3:
Run the docker image with the command:
sudo docker run -d -p 9090:9090 prometheus/promYou can reach prometheus server using the URL http://localhost:9090/graph. To verify the demo instances to collect metrics navigate to the URL http://your_server_ip:9090/status.
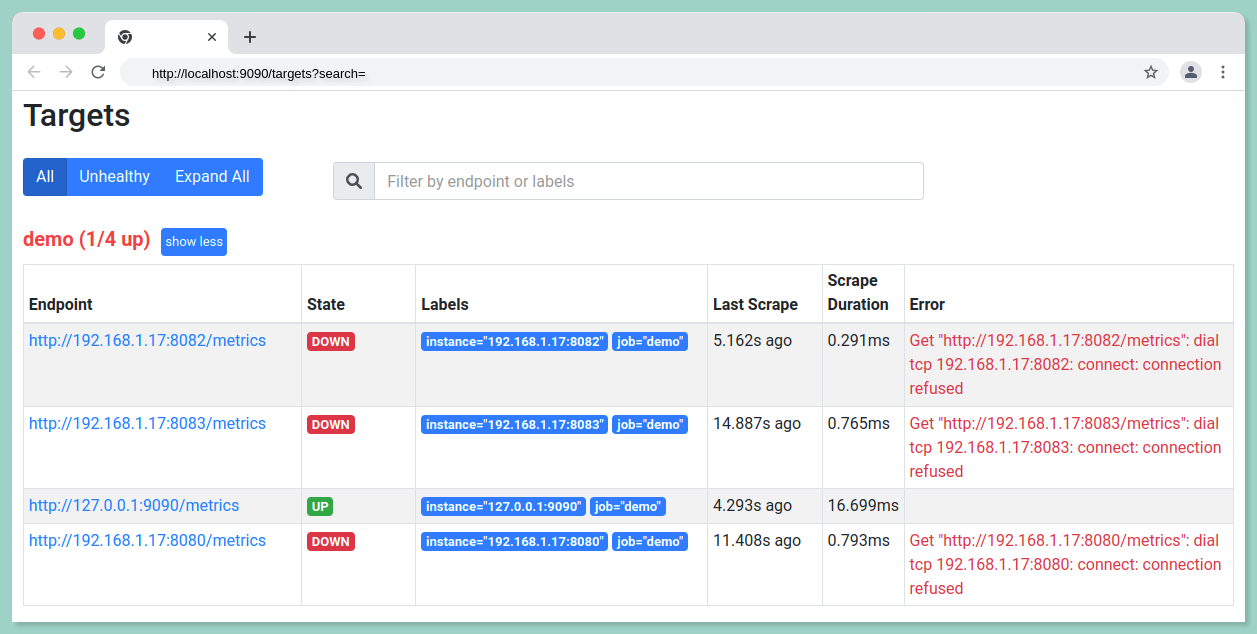
Choose Status --> Targets in the top menu bar to check the status.
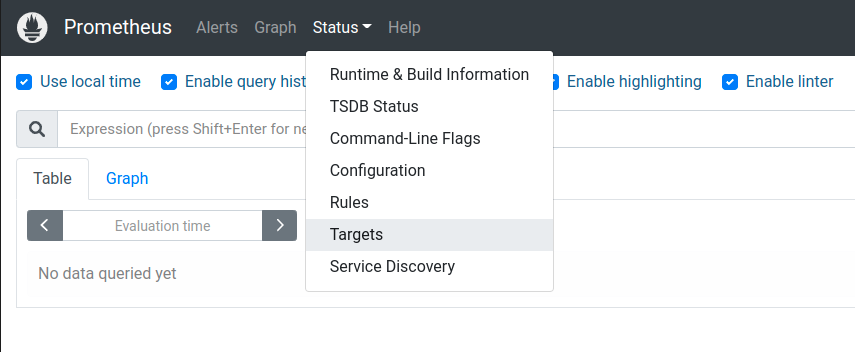
Before starting the instances the status should show "DOWN" as shown in the below image.
Prometheus Test Data Setup
Our Prometheus server is installed, and now we need to learn PromQL using some sample data. The following steps will guide you through the process of installing the Prometheus demo service.
Step 1:
Clone the prometheus demo service from Github.
git clone https://github.com/juliusv/prometheus_demo_service.gitStep 2:
To run the demo service using docker build the docker image using the below command:
docker build -t "prometheus-demo:1.0.0" .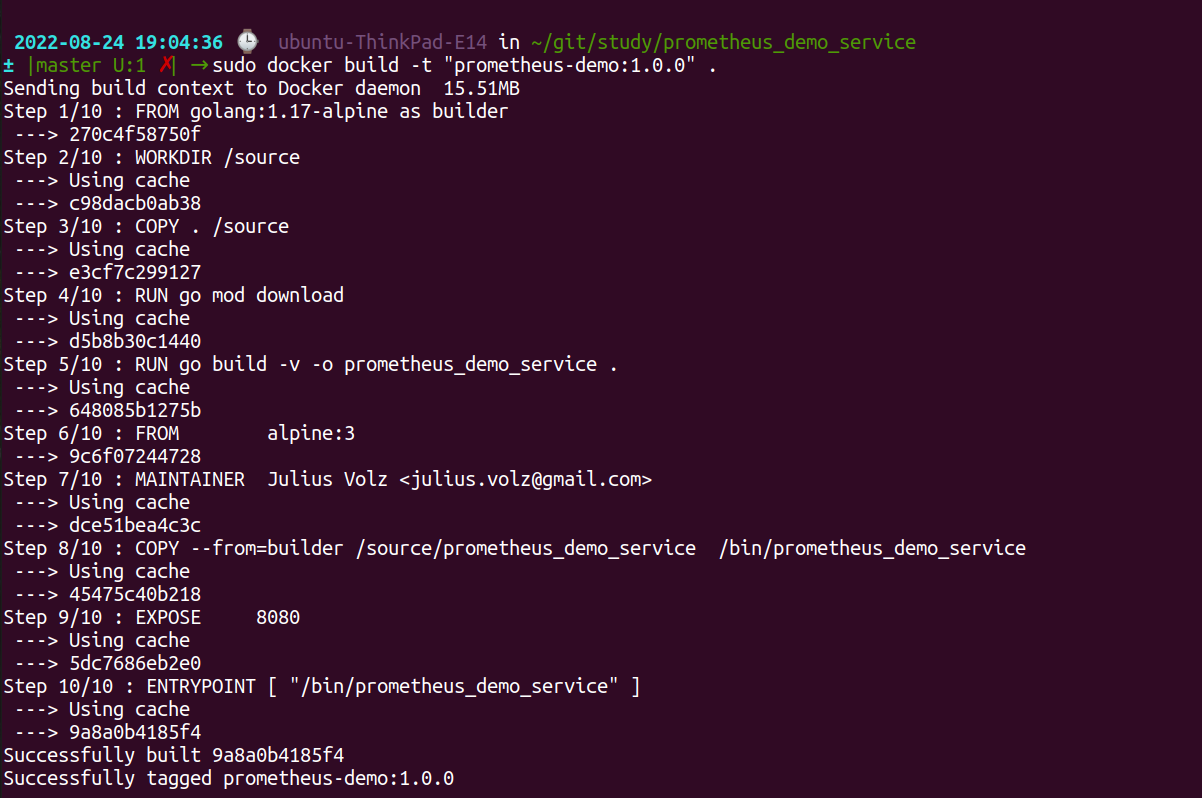
Step 3:
Run the docker build to access the metrics.
sudo docker run -d -p 8080:8080 prometheus-demo:1.0.0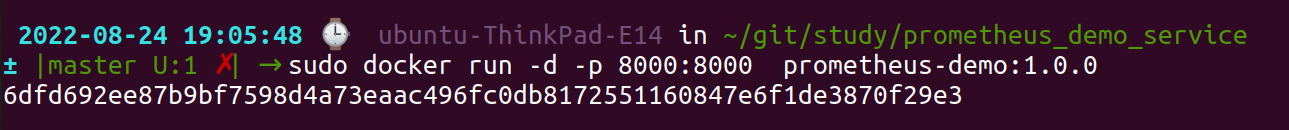
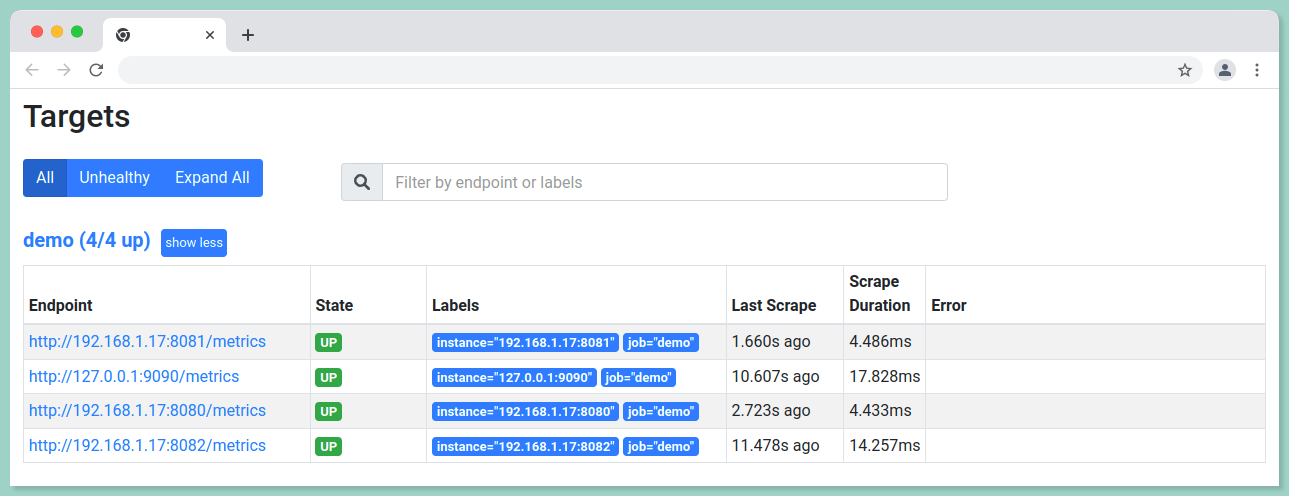
Follow the above steps twice and run the prometheus demo service in another two different ports.
Now you can again check the status of the targets as mentioned above to ensure the state (UP/DOWN) of the endpoints.
Prometheus Queries (PromQL)
We'll cover the basics of PromQL, the query language used by Prometheus, and look at some common query patterns.
#1 Monitoring the health of the instances
These queries are useful to stay alerted about the health of your system.
i.) To check how many nodes are up in your node:
up{job="demo"}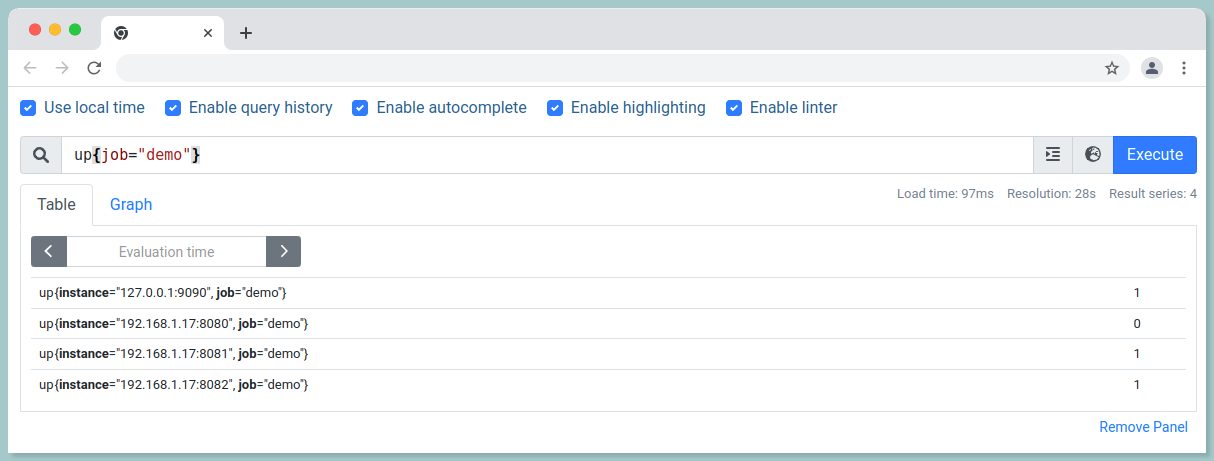
ii.) To check the nodes that are DOWN:
up{job="demo"} == 0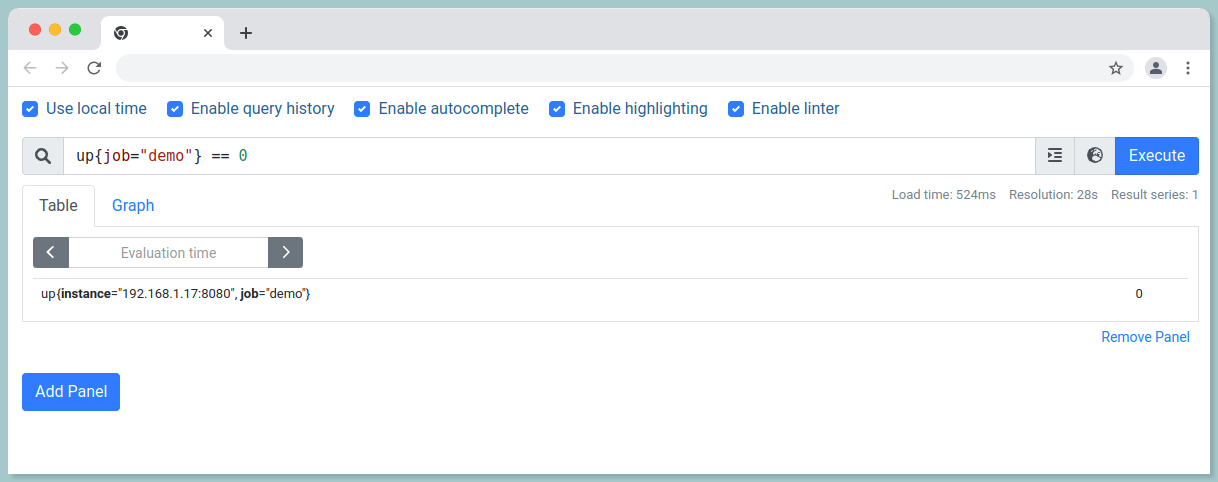
iii) To get the total count of the jobs that are DOWN:
count by(job) (up{job="demo"} == 0) 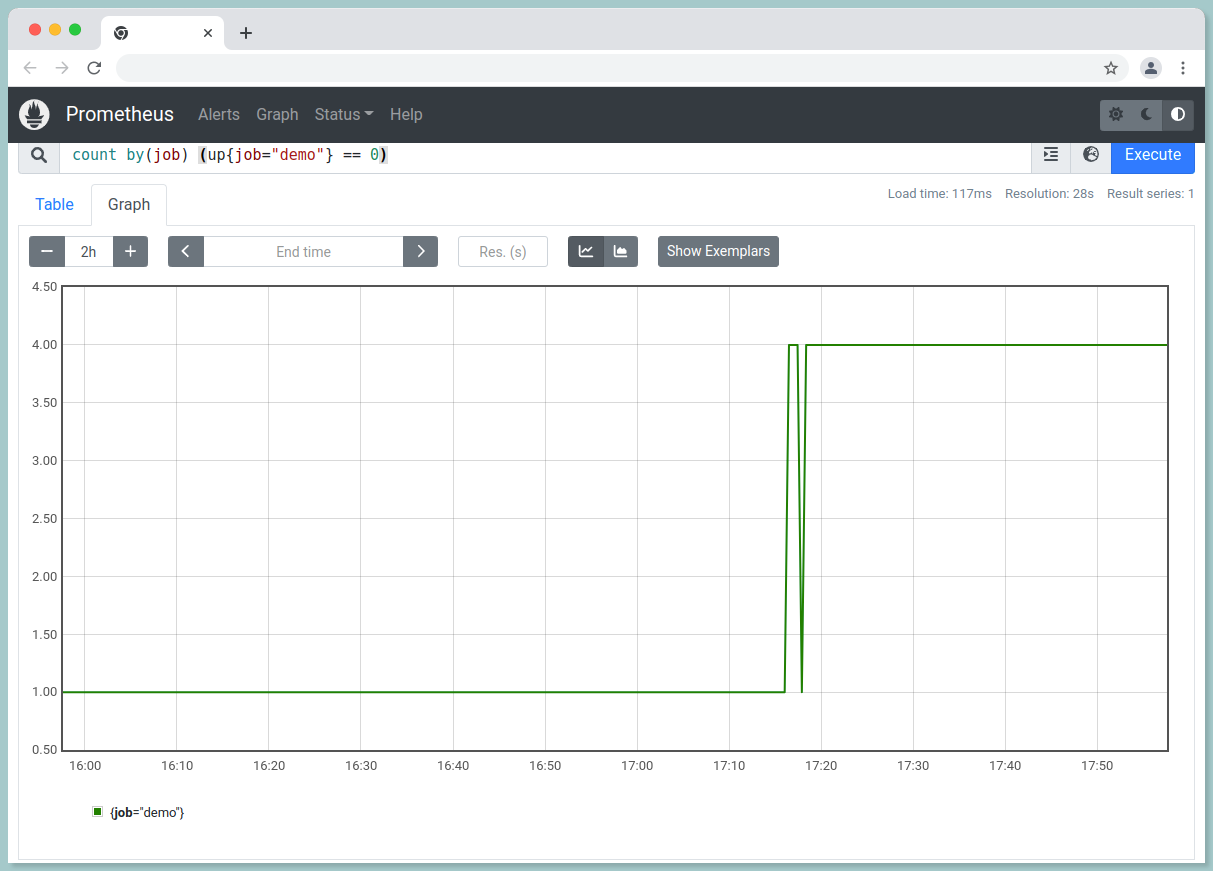
iii.) To count targets per job:
count by (job) (up)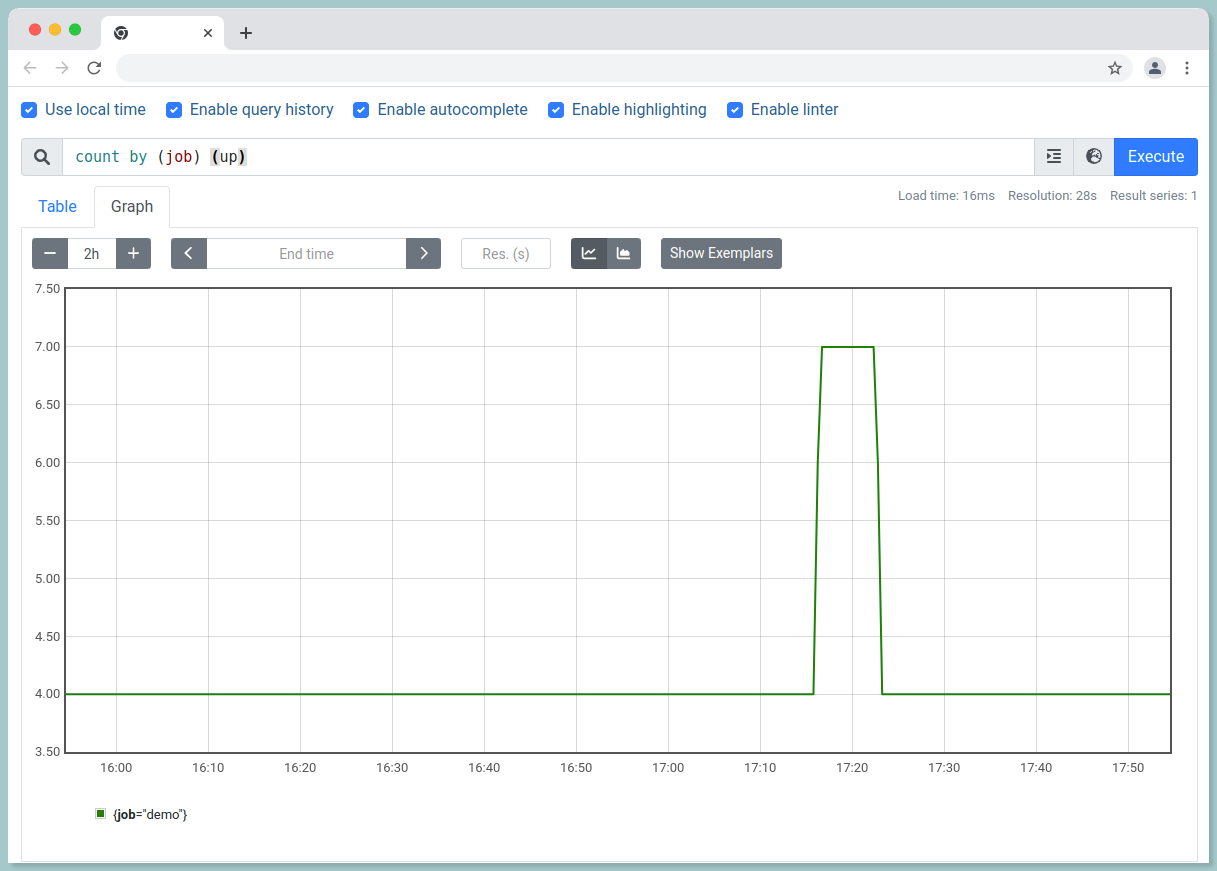
#2 Time series Queries
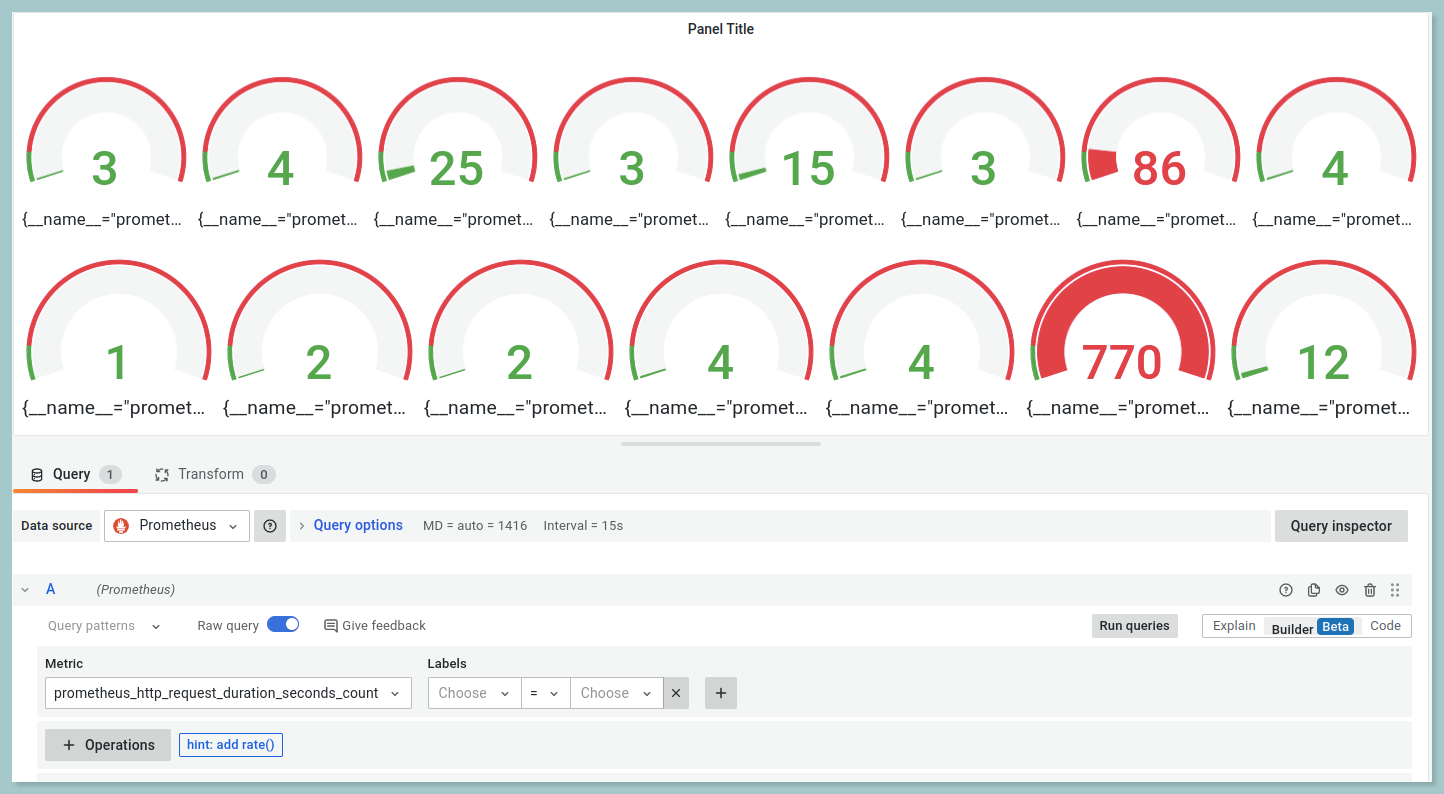
The metric demo_api_request_duration_seconds_count represents the number of synthetic API HTTP requests handled by the dummy service.
i.) To return all the time series that have a given metric name:
demo_api_request_duration_seconds_count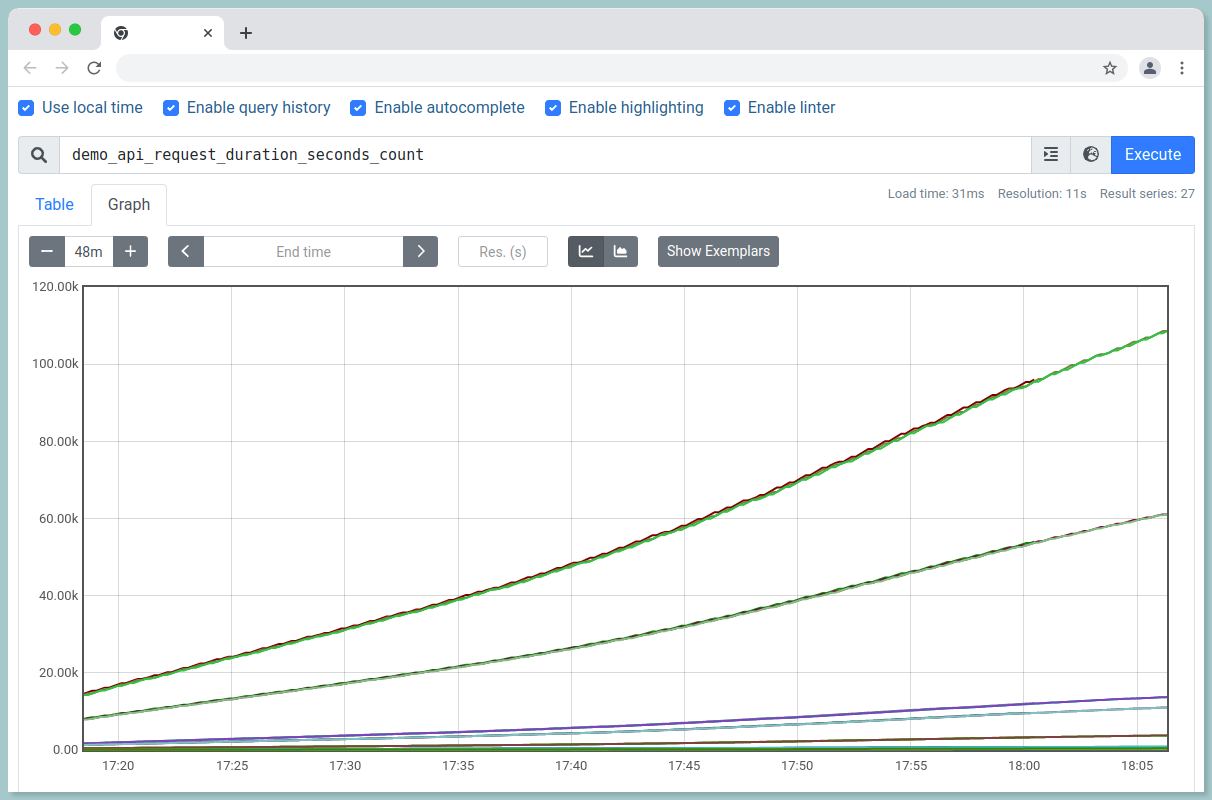
ii.) To filter the metrics only from instance 192.168.1.17:8080, job demo and HTTP method get:
demo_api_request_duration_seconds_count{instance="192.168.1.17:8080",method="GET",job="demo"}iii.) To list all the series whose path name starts with /api:
{path=~"/api.*"}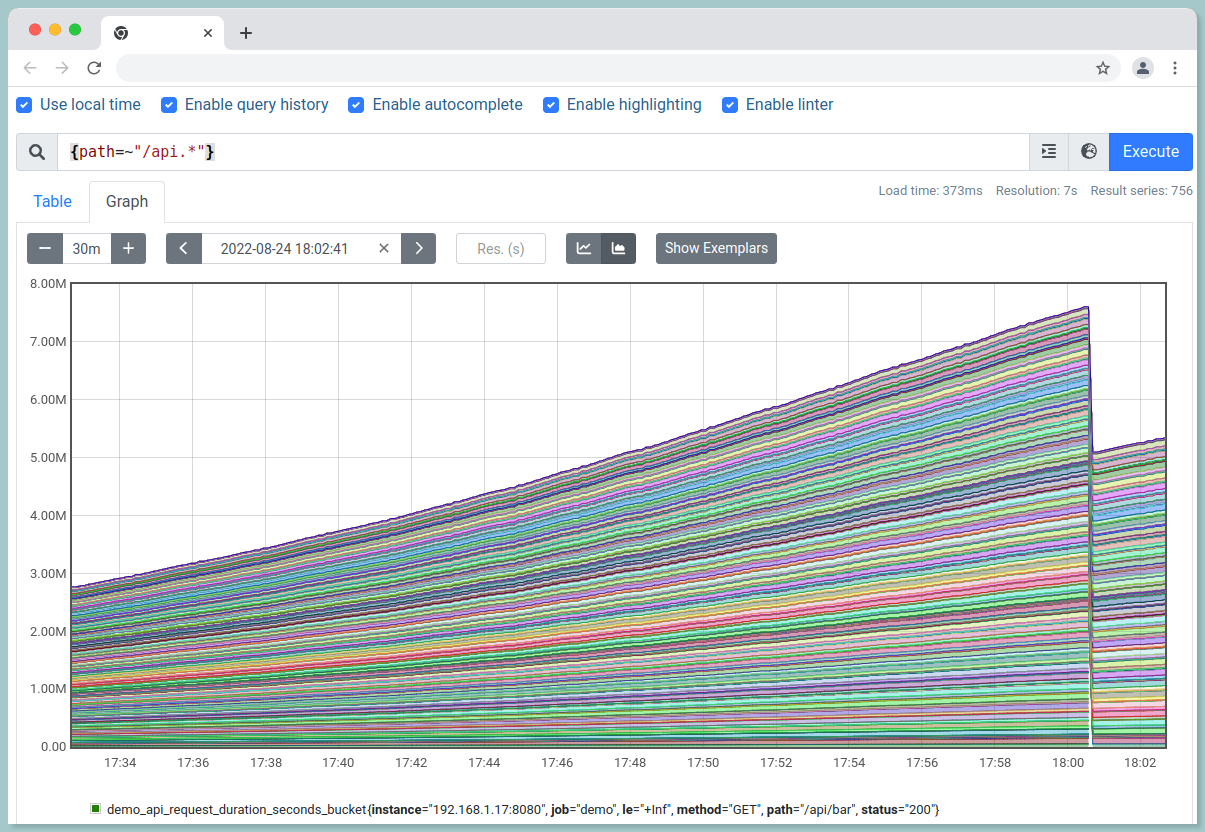
The .* in the above query allows you to match a full string in Prometheus.
Prometheus supports both equality and non-equality matching:
- Non-equality matching (
!=), - Regular-expression matching (
=~), - As well as Negative regular-expression matching (
!~)
#3 Rates and its derivatives
The Prometheus rate() function calculates how much value increases on average in a second. To put it another way, this indicates how fast the range vector's counter is increasing per second. It is used to graph slow-moving counters.
Syntax:
rate(v range_vector)

// example

rate(http_requests_total{job="api-server"}[5m])
i.) To retrieve the average HTTP request rate per second over last 5 minutes:
rate(demo_api_request_duration_seconds_count{job="demo"}[5m])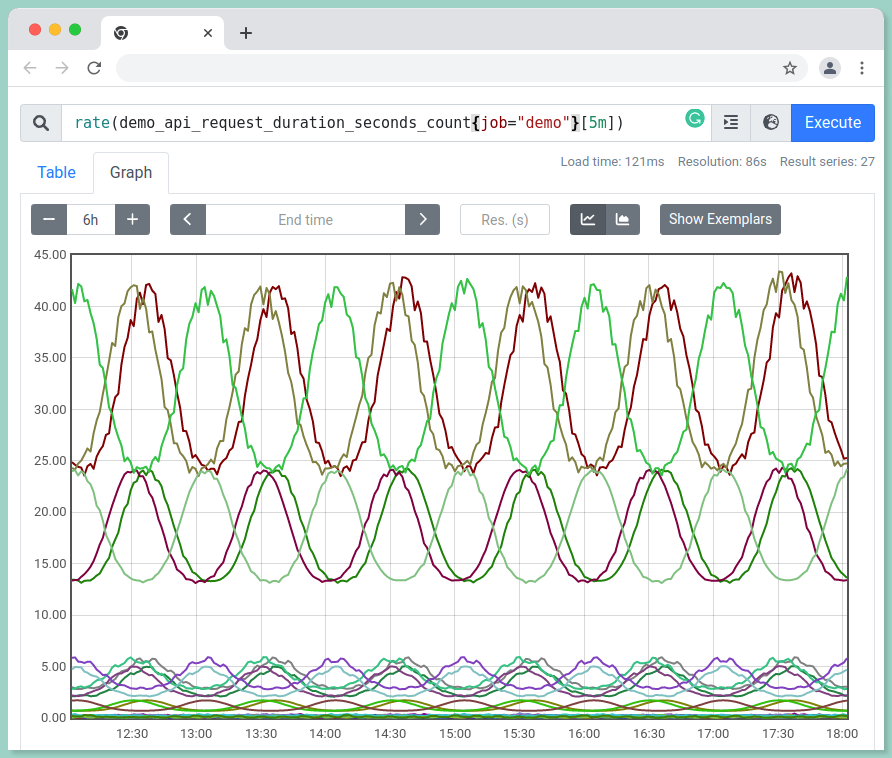
ii.) In a 5-minute timeframe, calculate the rate of growth per second over the last two samples:
irate(demo_api_request_duration_seconds_count[5m])
iii.) To calculate the absolute increase of HTTP requests over an hour:
increase(demo_api_request_duration_seconds_count{job="demo"}[1h])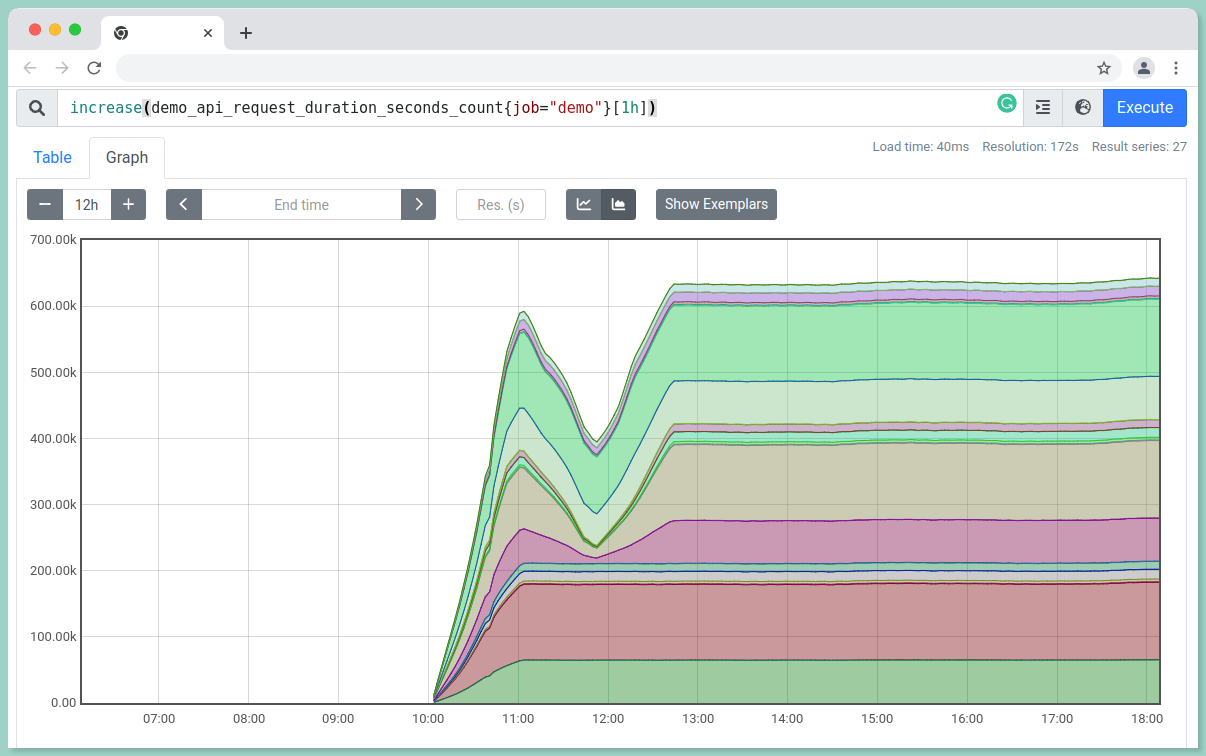
#4 Aggregating time series queries
i.) To view the total request rate over all dimensions:
sum(rate(demo_api_request_duration_seconds_count{job="demo"}[5m]))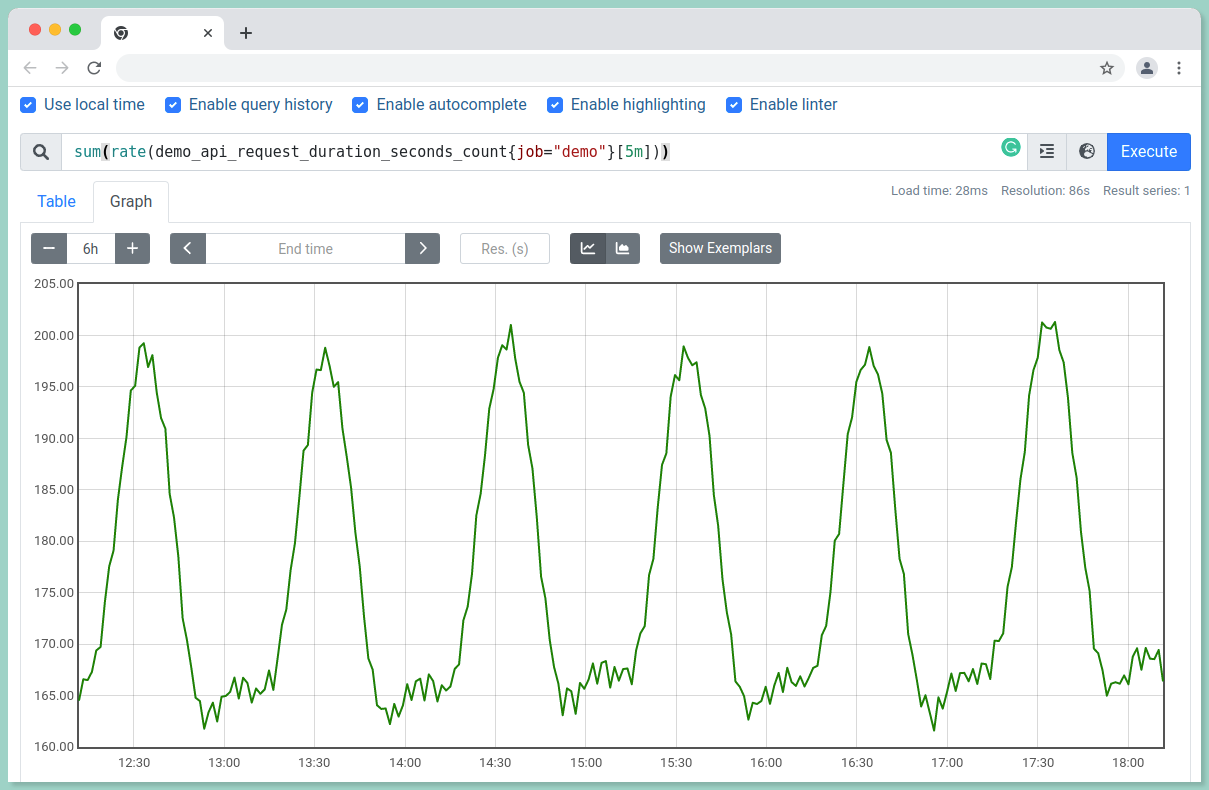
ii.) To aggregate without particular labels:
sum without(method, status)(rate(demo_api_request_duration_seconds_count{job="demo"}[5m]))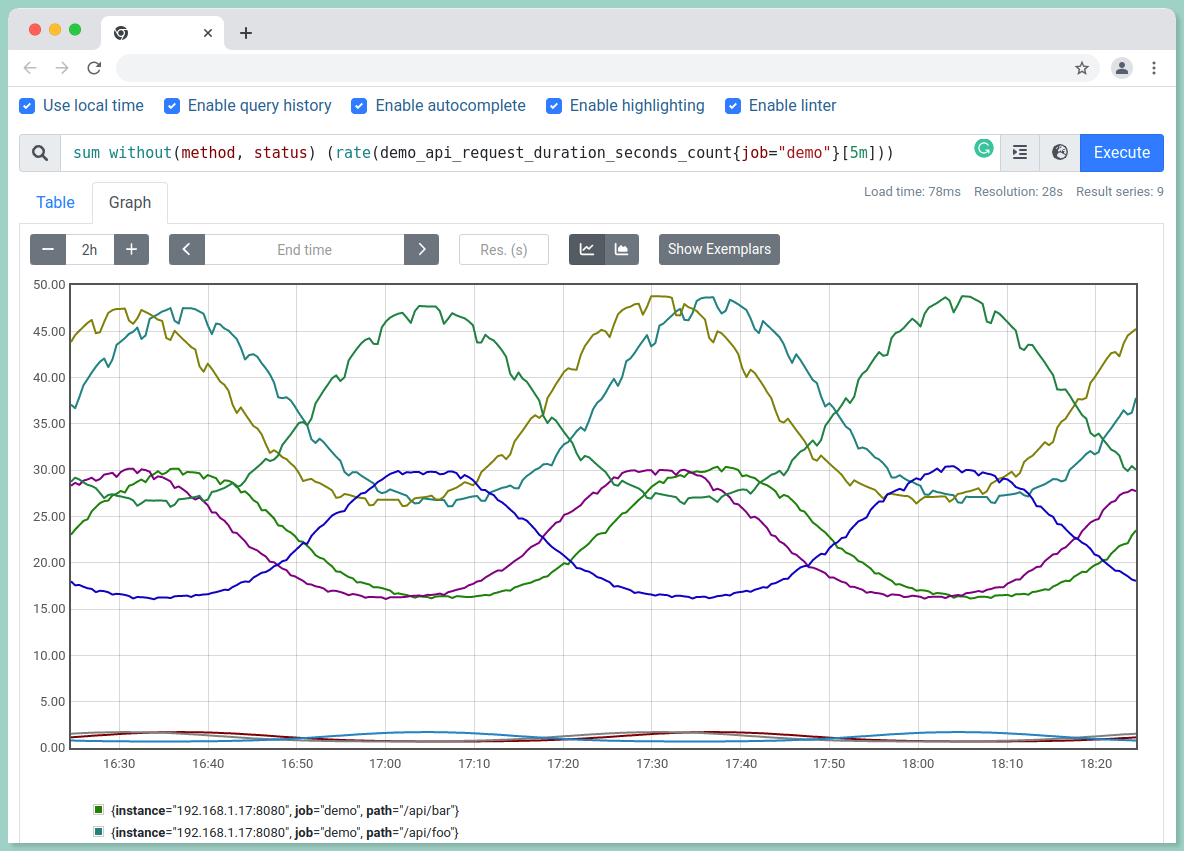
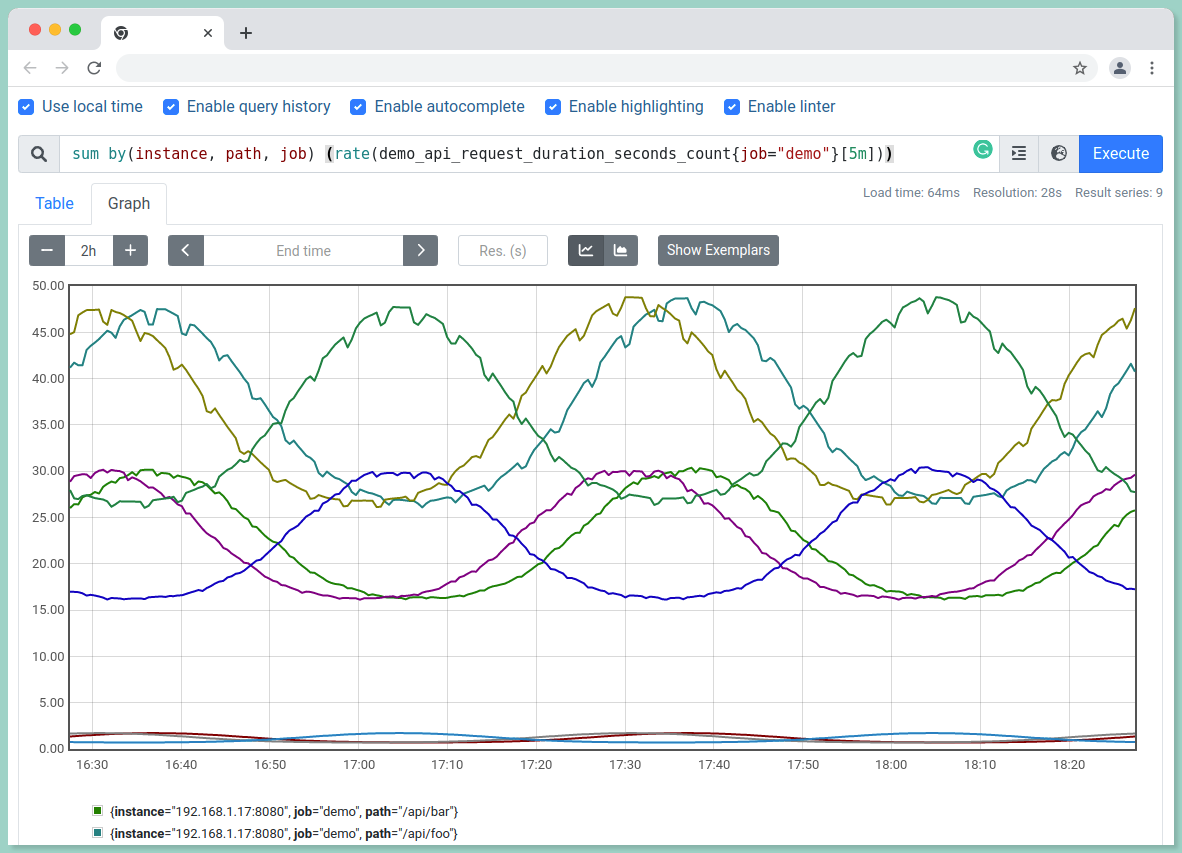
The above query can also be performed using the by() function:
sum by(instance, path, job) (rate(demo_api_request_duration_seconds_count{job="demo"}[5m]))It will also return the same result as of the without function.
#5 Arithmetic and set operators
Arithmetic operators can be applied to entire time series vectors.
i.) To calculate the number of bytes processed by the last batch job we ran:
demo_batch_last_run_processed_bytes{job="demo"} / 1024 / 1024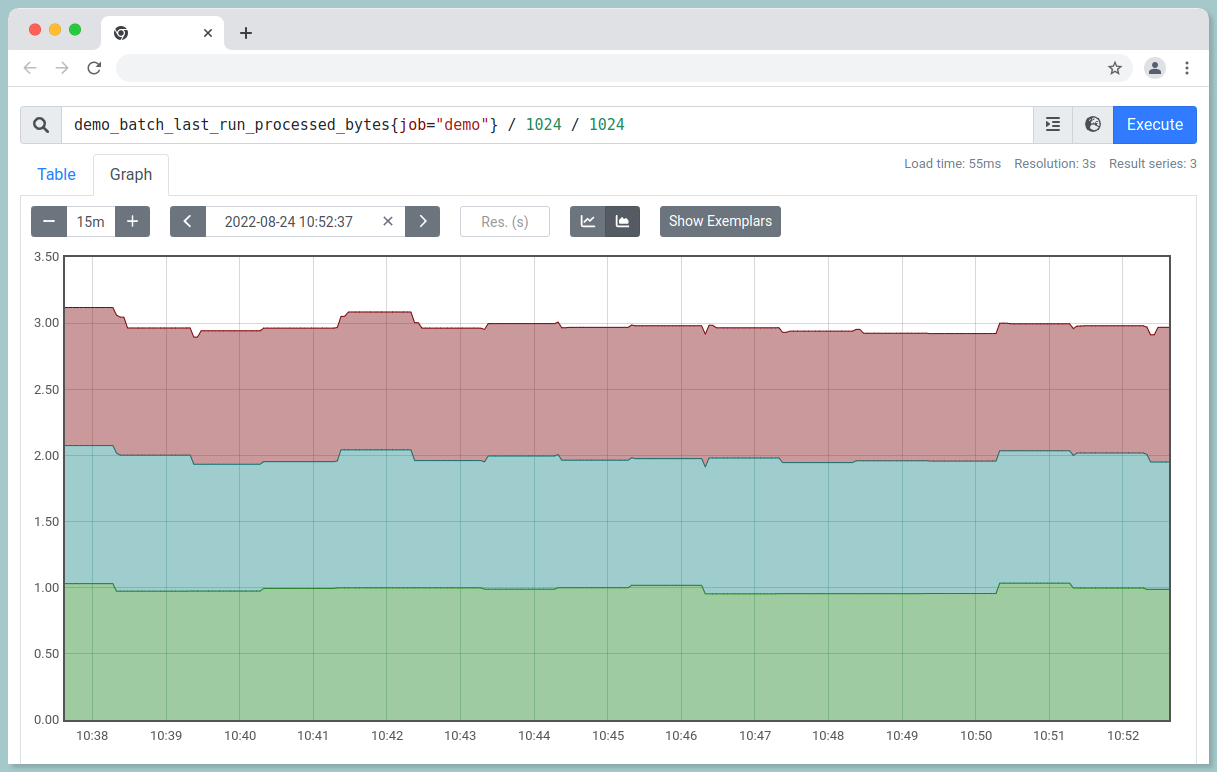
ii.) To calculate the average HTTP requests latency,
rate(demo_api_request_duration_seconds_sum{job="demo"}[5m]) / rate(demo_api_request_duration_seconds_count{job="demo"}[5m])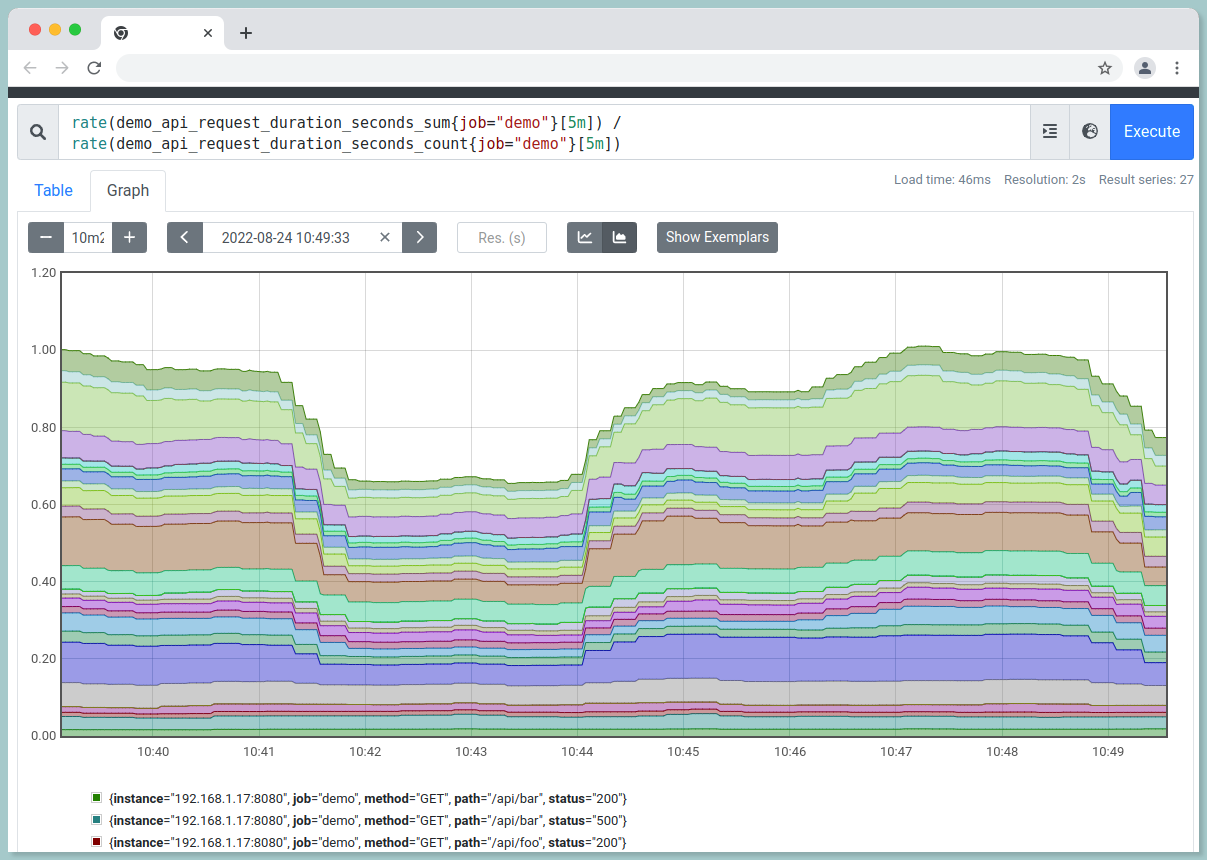
Set Operations:
//AND

demo_api_request_duration_seconds_bucket{instance="192.168.1.17:8080"} AND demo_api_request_duration_seconds_bucket{path="/api/bar", status="200"}

//OR

demo_api_request_duration_seconds_bucket{instance="192.168.1.17:8080"} OR demo_api_request_duration_seconds_bucket{path="/api/bar", status="200"}


//UNLESS

demo_api_request_duration_seconds_bucket{instance="192.168.1.17:8080"} UNLESS demo_api_request_duration_seconds_bucket{path="/api/bar", status="200"}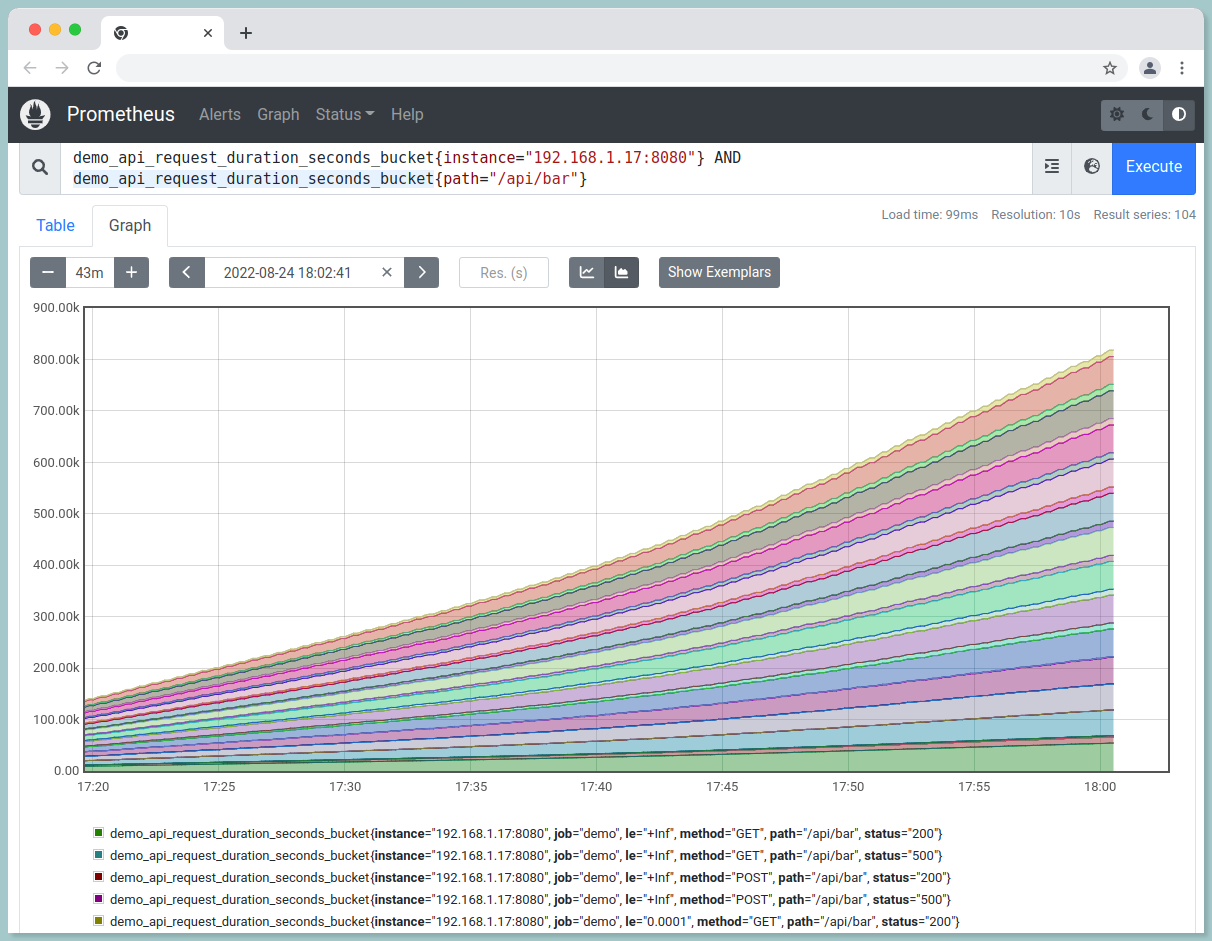
#6 Changes in Gauges
i.) To get per-second derivative using linear regression:
deriv(demo_api_request_duration_seconds_sum[5m])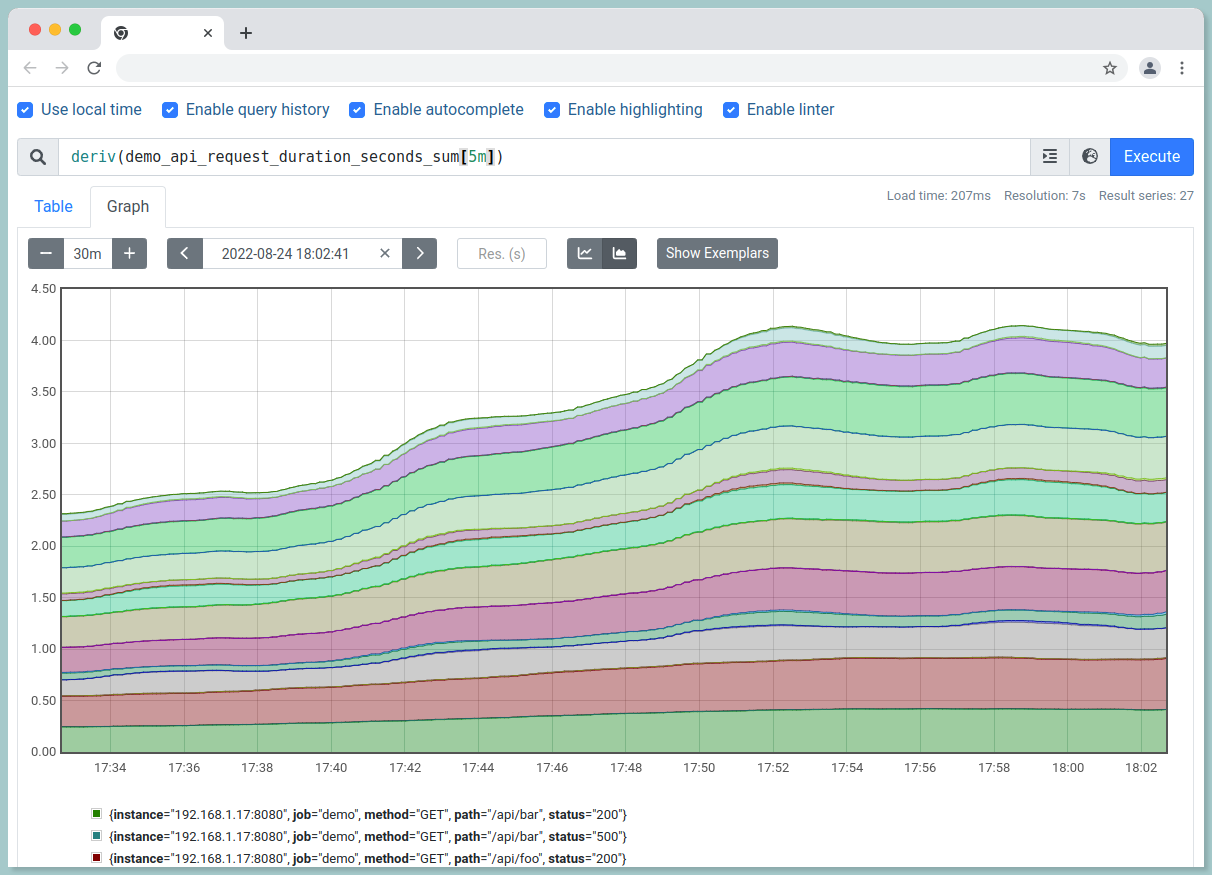
ii.) To examine the absolute change in value over last hour:
delta(demo_api_request_duration_seconds_sum[5m])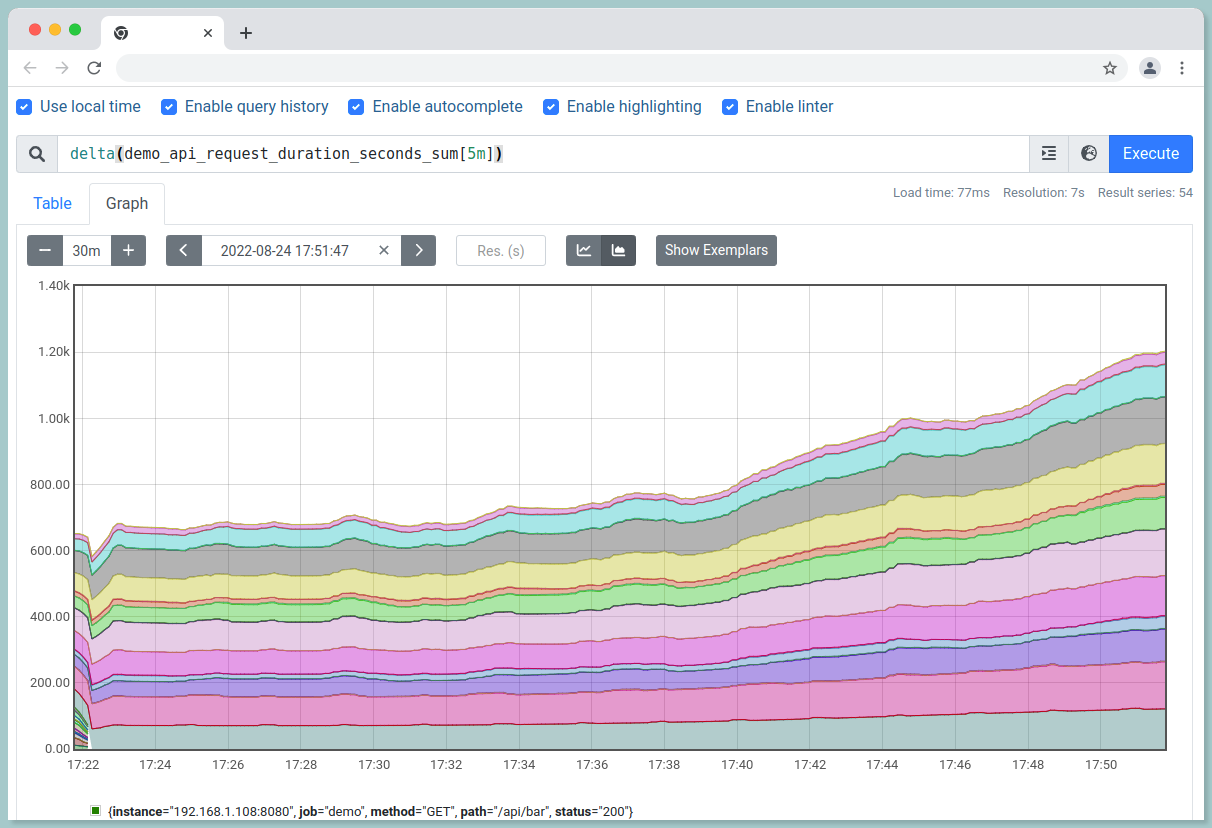
iii.) To predict the value in 1 hour based on last 4 hours:
predict_linear(demo_api_request_duration_seconds_sum[4h], 3600)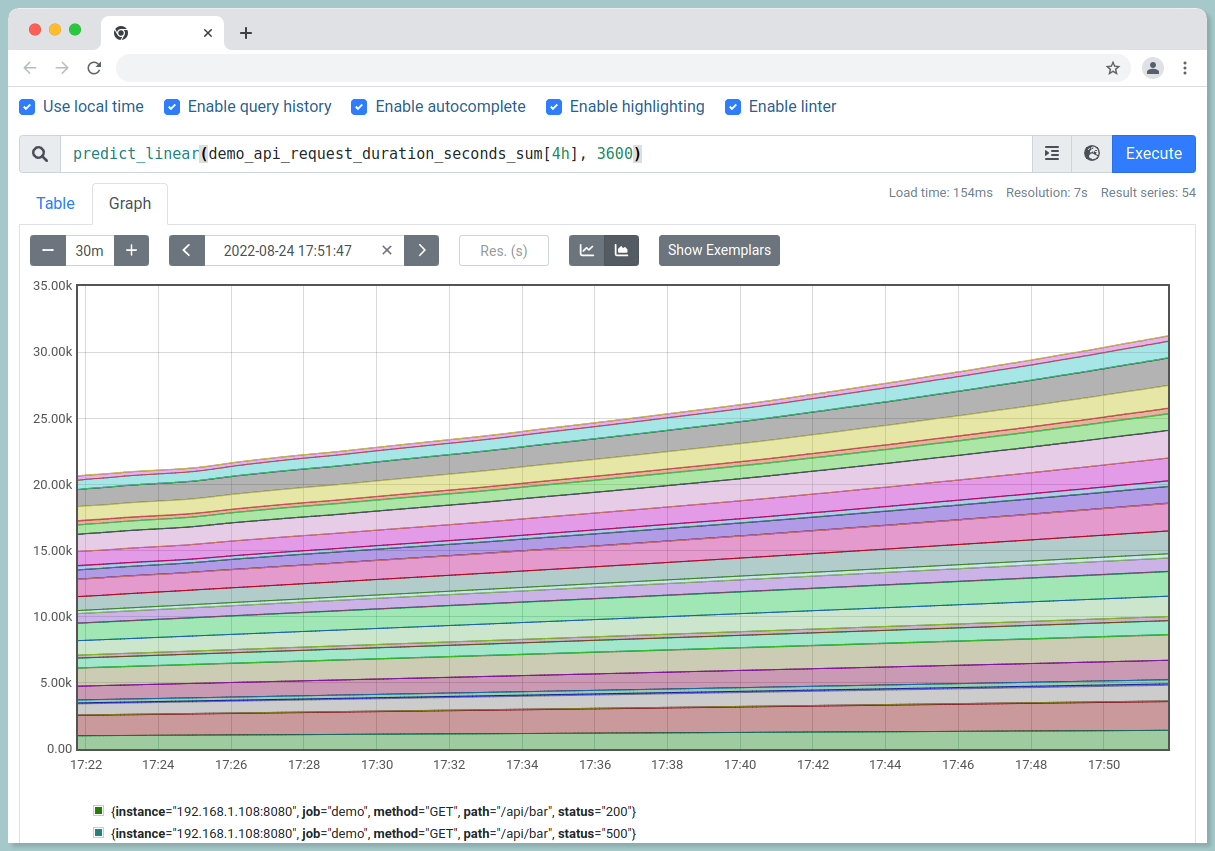
#7 Quantiles from Histograms
90th percentile request latency for last 5 minutes:
histogram_quantile(0.9, rate(demo_api_request_duration_seconds_bucket{job="demo"}[5m]))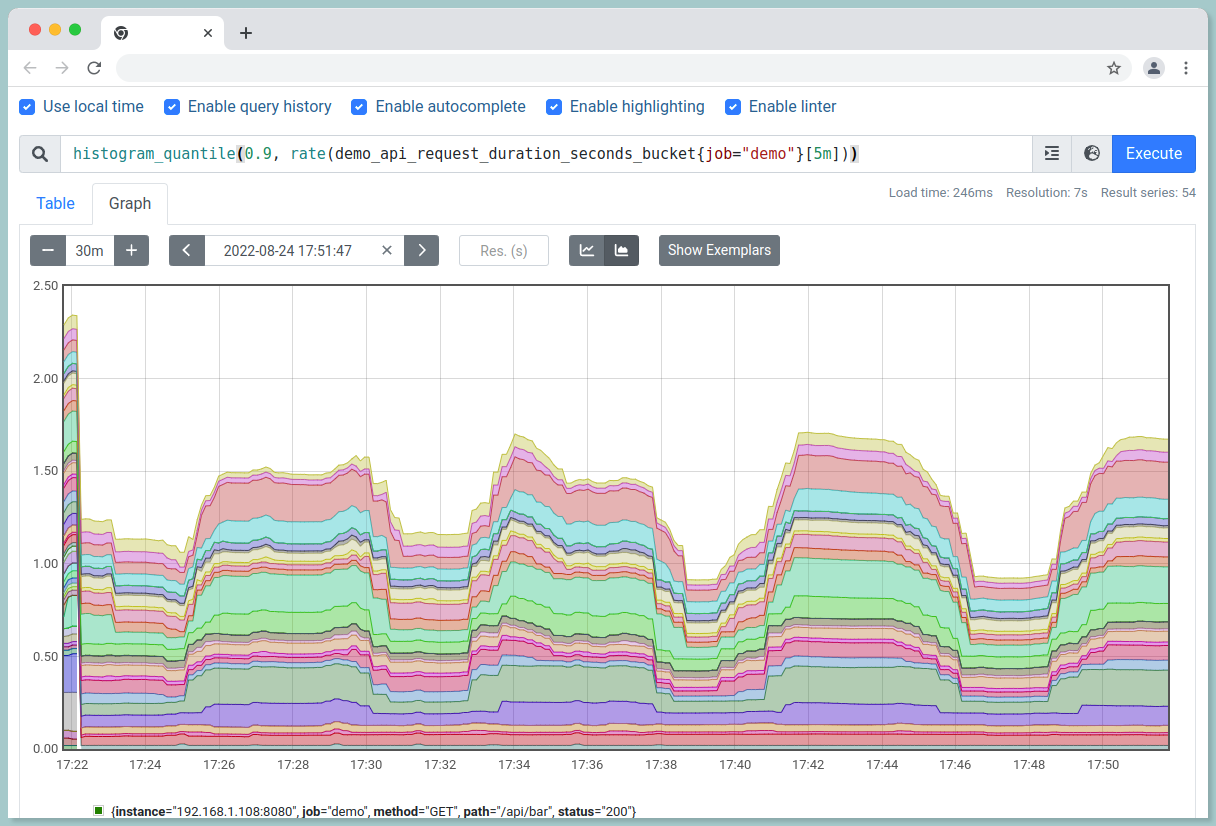
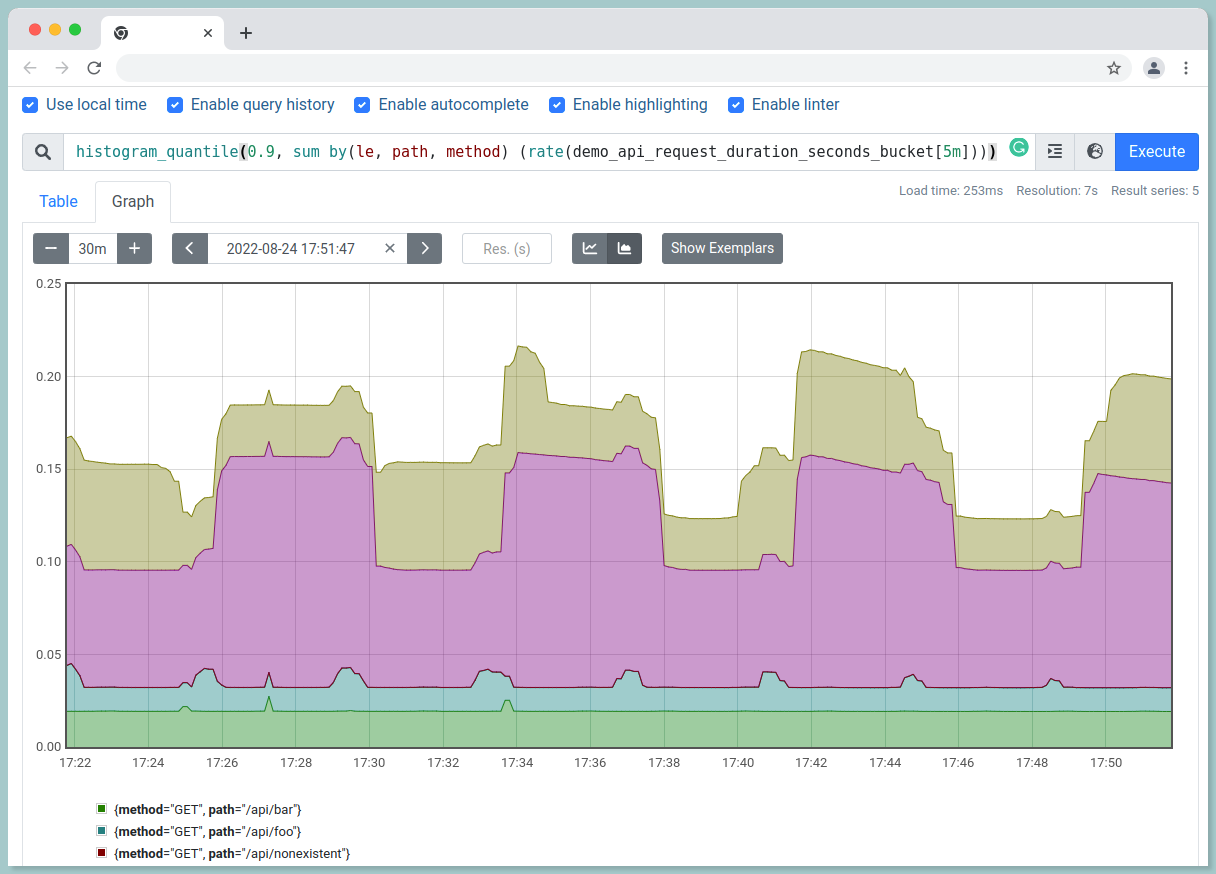
The above query has all label dimensions. To filter only for a particular dimension:
histogram_quantile(
  0.9,
  sum by(le, path, method) (
    rate(demo_api_request_duration_seconds_bucket[5m])
  )
)
#8 Label manipulation
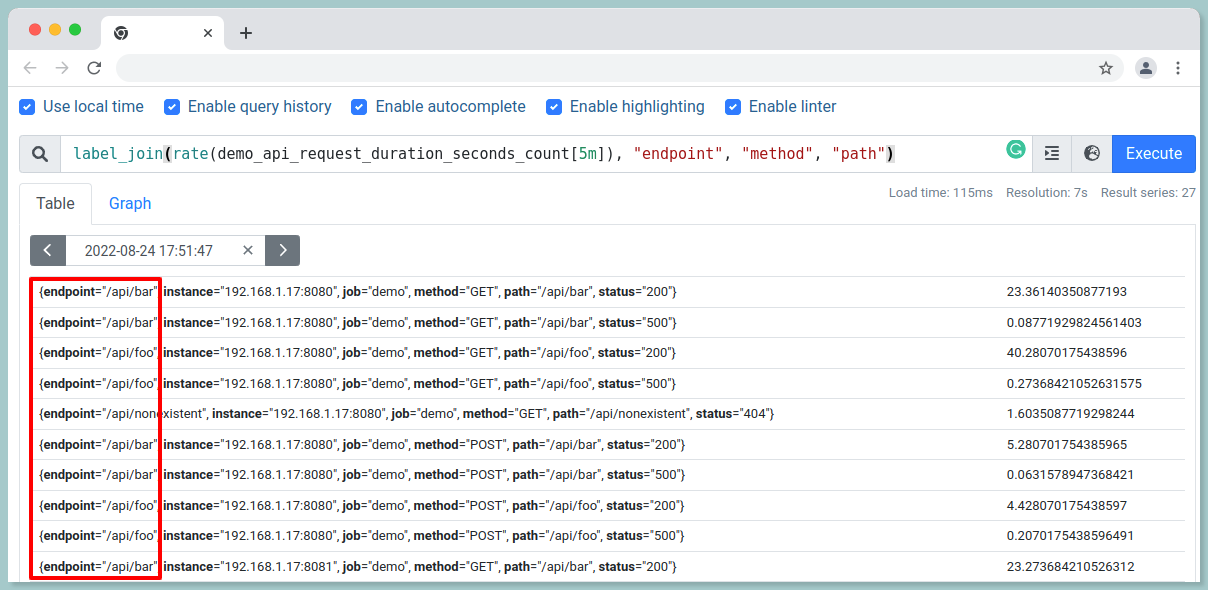
i.) Join the values of two labels with a - separator into a new endpoint label:
label_join(rate(demo_api_request_duration_seconds_count[5m]), "endpoint", "method", "path")
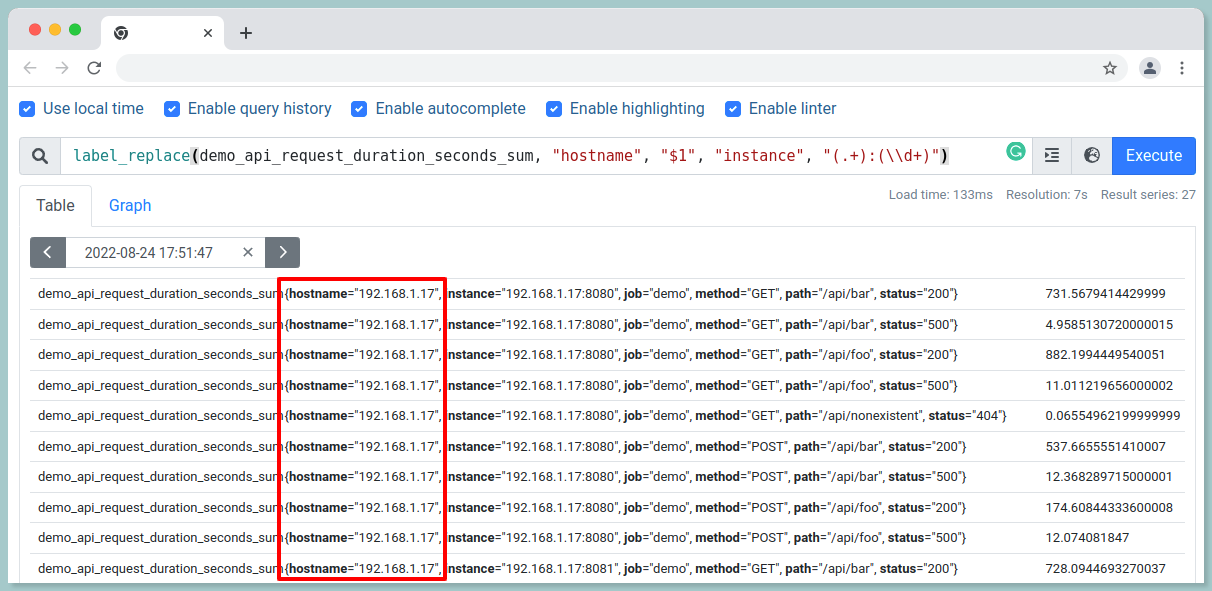
ii.) To extract part of a label and store it in a new label:
label_replace(demo_api_request_duration_seconds_sum, "hostname", "$1", "instance", "(.+):(\\d+)")
Synopsize
Prometheus’ powerful query language is both a blessing and a curse; while it gives you the ability to view your metrics in any way desired, it can be challenging to remember the syntax required.
Learn the basics of PromQL. This query language is the key to unlocking the power of Prometheus, so make sure you understand it inside and out. Get to know the available exporters. By understanding what data each exporter can provide, you'll be able to better utilize Prometheus to monitor your systems.
Use Grafana for visualization. Grafana is a great tool for visualizing Prometheus data, and it can help you get a better understanding of what's going on with your systems.
Experiment with different configurations. PromQL is highly configurable, so play around with different settings to see what works best for you.
Stay up to date with the latest Prometheus news. By keeping up with the latest developments, you'll be able to make sure you're using Prometheus to its fullest potential.
Monitoring application performance with Atatus
Identify and fix problems with your web and backend apps using our full-stack monitoring platform Atatus. Utilize unified monitoring to identify performance bottlenecks and optimize your app for the best user experience.
With application monitoring, you can optimize your application. With full-stack monitoring tools, eliminate errors by instrumenting, analyzing, troubleshooting, and rectifying them.
Ensure that users have a seamless experience. Observe the performance of your applications and relate them to business outcomes using full-stack observability.

Enhance reliability and time to market with seamless performance monitoring that diagnoses troubleshoots, and fixes your application. Identify application performance bottlenecks across your entire DevOps stack at the right time.
RUM measures the end-to-end performance of web applications, devices, countries, and countries, enabling you to resolve issues across all devices, countries, and applications.
Interested in actionable data? Take advantage of the 14-day free trial of Atatus!
#1 Solution for Logs, Traces & Metrics
![]() APM
APM
![]() Kubernetes
Kubernetes
![]() Logs
Logs
![]() Synthetics
Synthetics
![]() RUM
RUM
![]() Serverless
Serverless
![]() Security
Security
![]() More
More