Redis Performance Metrics: An Introduction

Redis is a widely used in-memory database in the industry. As a consequence of its in-memory database, it can concurrently serve data as a key-value-oriented NoSQL database.
Due to the use of in-memory data storage in Redis, you can achieve performance that is challenging with conventional databases. It is crucial to monitor Redis' resource usage with Redis performance metrics since it is an in-memory data store. The throughput or work done should also be monitored
“Do you have the right tools to ensure the reliability and efficiency of your Redis implementation? Make sure you see the degrading performance and failures before your applications or users encounter them!“
To do that, you must comprehend the crucial metrics to diagnose and how your Redis instances and clusters are impacted by them. Check out these key Redis performance metrics in this article, to enhance the management of your Redis database.
Table Of Contents
A glimpse at Redis Metrics
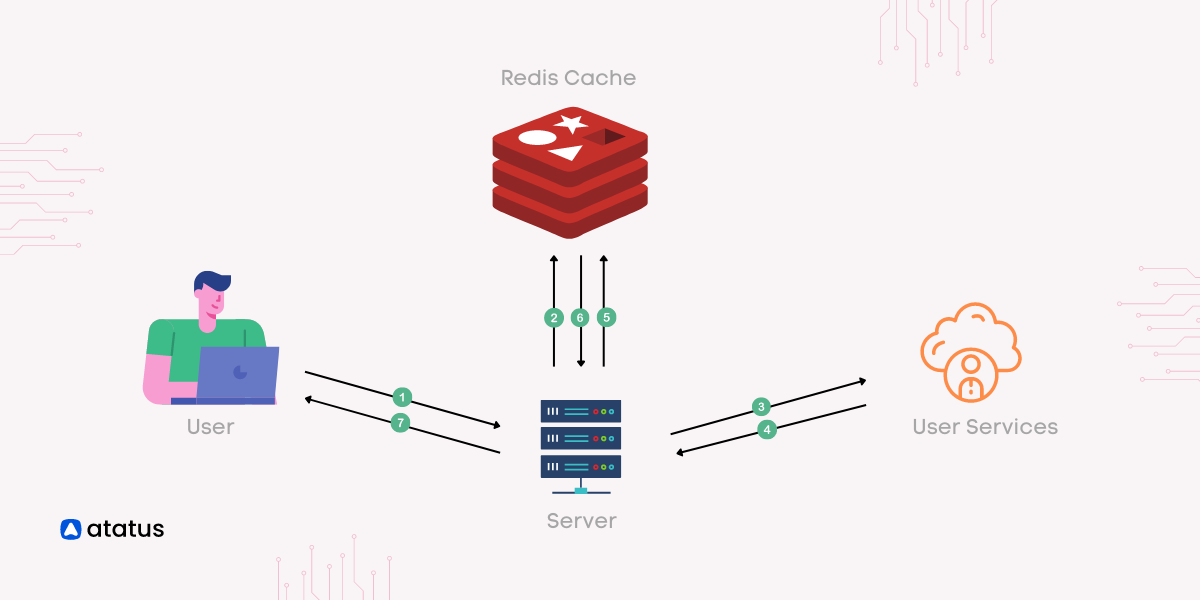
Due to Redis in-memory database's lightning fast performance, it can function as a feasible substitute for disk-based databases. By optimizing Redis performance metrics, you can substantially enhance the speed of your application.
Redis, that accounts as Remote Dictionary Server, is a widely used open-source in-memory database. It was created by Salvatore Sanfilippo and released in 2009. Redis is more than just a database, despite offering a NoSQL-style database interface. It can also work in conjunction with a cache and message broker.
The very effective in-memory data store Redis is open-sourced and BSD-3 licensed. It is widely used in the industry due to its profound performance and adaptability. It may be used as an in-memory distributed key-value store, cache, or message broker with ease.
It can hold almost any data structure, making it extremely flexible. Redis also comes with built-in replication, which makes scaling up simple and requires no manual work. Using the Redis platform, you can store data in an open format.
Due to their speed advantage over disk-based systems, memory-based storage systems enable high throughput, while disk-based storage systems make sure that the data can be recovered and restored in the event of a system failure.
Metrics to monitor
Two areas should be monitored when monitoring Redis: Redis' own resource usage, as well as other infrastructure issues that may have arisen. The following categories cover the most noteworthy Redis monitoring metrics:
1. Performance Metrics
One of the finest Redis monitoring metrics of a system's health is performance, which can be ascertained by employing metrics such as latency, CPU usage, Redis cache hit rate, and many others. Memory issues are likely the most common source of poor stability, which can have a negative effects on the overall engagement.
i.) Latency
Redis is widely recognized as a low-latency database that might be recurrently used for demanding use cases. Latency is a significant Redis performance metric to analyze, since that signifies the average time it takes for the Redis server to respond back to the application requests.
The most direct and straightforward way to track changes in Redis performance is to monitor request latency. The time taken for an function to complete, from the time the server receives the request whenever it delivers back the response, is the latency highlighted for Redis.
When one request receives a slow response, all subsequent requests will experience more latency. Redis latency is impacted by the compute resources, data, and operations that you use, similar to throughput. The following Redis basic commands can be used to check latency quickly:
redis-cli --latency -h 127.0.0.1 -p 6379ii.) CPU Usage
The CPU usage, Redis performance metric of a database server typically determines its optimum reliability. Redis performance monitoring displays detailed graphical representations of your Redis database CPU memory usage.
Prioritizing the percentage of system CPU used permits you to ensure that the host on which Redis is installed has adequate processing power at all times. Slow running queries can be improved by optimizing them.
Each Redis request will necessitate CPU cycles to process and complete. In a given environment, the more spare CPU cycles you have, the more requests your Redis server can handle.
You should avoid situations in which the CPU is constantly at 100% utilization, as this will affect the time it takes to process requests. High CPU usage can also be linked to Redis basic commands that take longer to execute.
iii.) Cache Hit Rate
By concentrating on the Redis cache hit rate, which represents the proportion of successful datasets out of each decode function, you can ascertain whether your Redis cache is being used effectively.
A minimal Redis cache hit rate implies that users are actually attempting to use keys that are no longer applicable. Your applications' latency might indeed boost as a result of obtaining the data from a slower alternative resource owing to the low hit rates.
The Redis cache hit rate is a significant performance metric to seriously consider. It denotes the efficiency with which each Redis instance is used. The Redis cache hit rate would represent a significant portion of all successful reads.
If the ratio is much less than 0.8, a substantial volume of keys have expired or have been evicted. This signifies that the size of the Redis cache ought to be increased. The Redis cache hit rate calculates the applicability of a Redis instance cache usage. It is ascertained as (total key hits) + (total key misses).
Whenever the size of the Redis cache becomes inadequate for its designated use, the Redis cache hit rate suffers. The info stats command reverts keyspace hits and keyspace misses for metrically relevant data.
Here's how it's calculated:
Cache Hit Ratio = (keyspace_hits)/(keyspace_hits + keyspace_misses)2. Memory Metrics
As Redis' primary resource, the Redis monitoring metric, memory is crucial. Due to the fact that Redis is an in-memory database, its performance is dependent on the amount of memory available. The following metrics highlights the importance of Redis' memory.
i.) Memory Usage
Redis stores data and handles queries in memory. To achieve the optimum performance, ensure you have adequate RAM to hold all of the data. Using the maxmemory directive, you may also set Redis maximum memory limit.
The CONFIG SET command can be used during runtime to modify the settings or by using the redis.config file in the future. Performance is significantly influenced by the Redis database's memory fragmentation ratio (or memory use).
If the ratio is greater than 1, Redis requires more memory than your machine can provide, and switching to the disc will result in a noticeably higher latency. Overly fragmented memory is indicated if the ratio is greater than 1.5.
Redis' fragmentation ratio is the total number of bytes allocated by its allocator (standard libc, jemalloc, or an other allocator). The fragmentation ratio should be kept as low as possible to maintain optimum Redis performance.
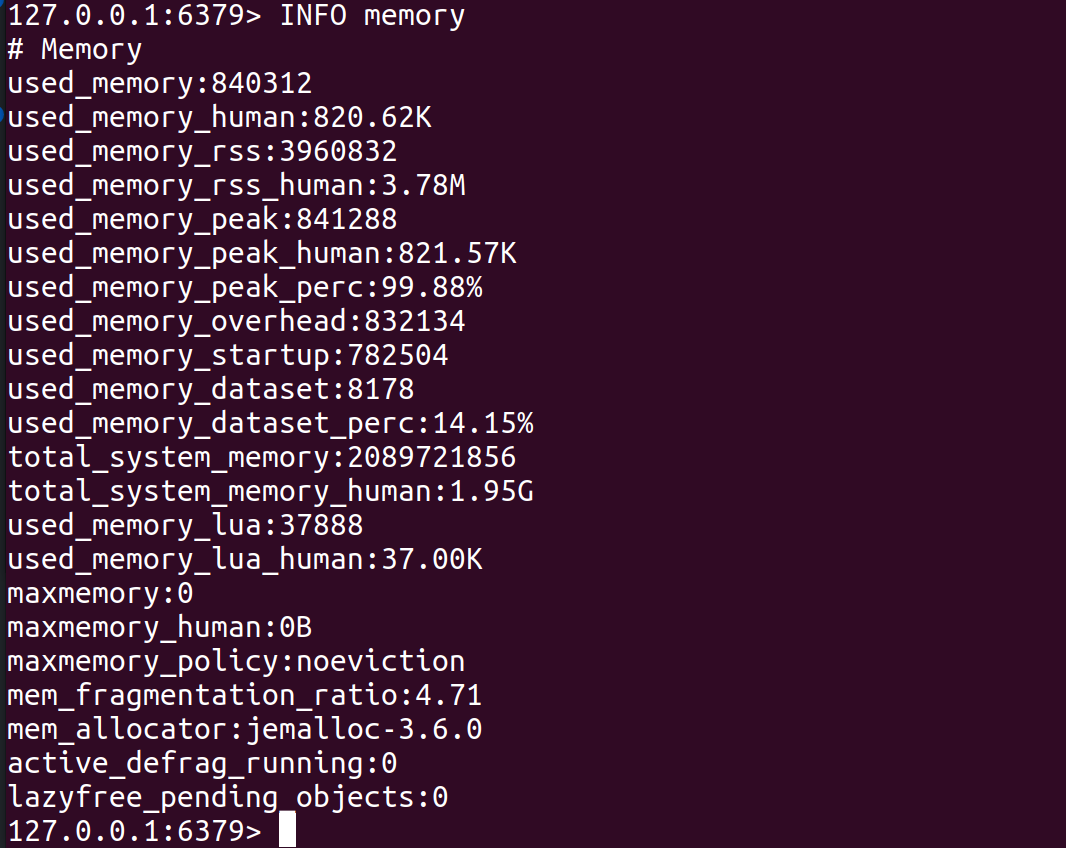
mem_fragmentation_ratio = used_memory_rss / used_memoryRunning info memory will return all Redis memory usage metrics for a Redis instance. Memory RSS (Resident Set Size) is the amount of memory allocated to Redis by the operating system. Memory consumption monitoring can help guarantee that Redis instances consume less memory than the entire amount of accessible memory.
ii.) Eviction
Redis provides a number of customizable eviction rules, which are utilized by the server to free up memory when memory use reaches a certain threshold. Too many evicted keys implies an increase in latency, as subsequent requests must wait for an empty space before being stored in memory.
By checking the expired object's readings, you may establish whether expiry happens or if data accumulates in your cache. You can determine whether expiry occurs or data accumulates in your cache by inspecting the expired item readings.
Each Redis entry has a property called Time To Live (TTL) This indicates, Redis when to remove the data from its memory. If an application does not define this value, it causes expired data to pile up.
The more evictions you see, the higher the chance that the next request may not find a given key in the keyspace.
The key expiration policy can be configured with the subsequent command:
redis-cli CONFIG SET maxmemory-policy <policy>3. Basic Activity Metrics
Aside from speed and memory measurements, it is useful to understand some fundamental Redis instance activity metrics. These Redis basic activity metrics provide us with useful information about how Redis is being used and how efficiently our instance is working.
Following are the Redis monitoring metric definitions you should scrutinize for basic activity metrics:
i.) connected_clients
An excellent way to gauge a system's performance is to count the number of client connections, omitting connections from replicas. Evaluating how your server operates involves determining the largest number of client connections.
For most Redis applications, there will be sensible upper and minimum limitations on the number of connected clients. Analyzing client connections enables you to guarantee that you have optimum free resources available for new clients or administrative sessions.
Run the command INFO clients on a Redis server that has 10 connected clients, you might see output like this:
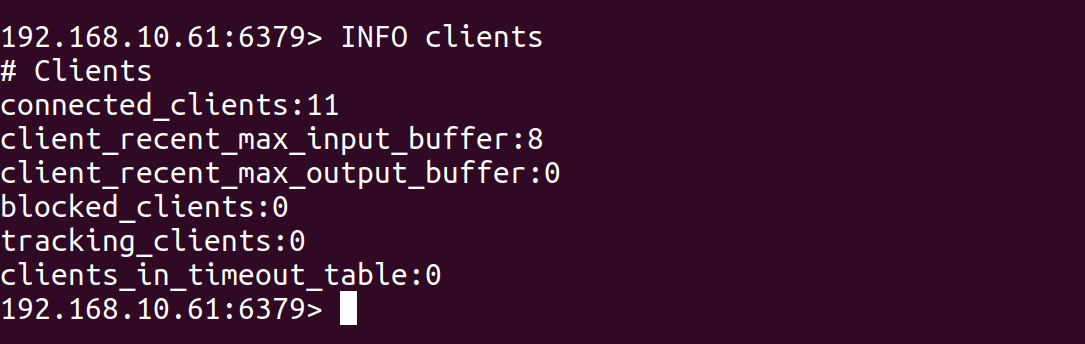
If you have 10 clients currently connected to your Redis server, the output also includes information about the recent max buffer sizes for input and output for the clients, and the number of blocked clients.
The connected_clients Redis monitoring metric can be used to monitor the overall activity and workload of the Redis server.
It can be used to identify any sudden spikes in the number of connected clients, which could indicate a problem with the application or client connecting to the Redis server, such as a high number of unnecessary requests.
ii.) blocked_clients
A rise in the quantity of blocked clients delaying data may signify difficulties. Redis offers a diverse range of blocking functions that operate with arrays.
The source set might not be loading up owing to latency and perhaps other concerns. If the number of blocked clients keeps expanding over time, there must be an issue of great concern that requires to be resolved.
If you run the command redis-cli INFO clients on a Redis server that has 2 blocked clients, you might see output like this:
If you have 10 clients currently connected to your redis server, 2 of which are blocked on a blocking command. The output also includes the recent max buffer sizes for input and output for the clients.
# Clients
connected_clients:10
client_recent_max_input_buffer:2
client_recent_max_output_buffer:0
blocked_clients:2
The blocked clients Redis monitoring metric can be used to identify if there is an issue with the blocking command, such as a high number of blocked clients that could indicate a problem with the application or client connecting to the Redis server, such as slow response time or a high number of unnecessary requests.
iii.) connected_slaves
In Redis, the connected_slaves Redis performance metrics refers to the number of slave servers connected to the master server.
This metric can be checked using the INFO replication command, which will return information about the replication status of the Redis server, including the number of connected slaves.
A Redis server can be configured as a master or a slave. A master server handles write operations and propagate them to the connected slave servers. A slave server, on the other hand, is responsible for synchronizing its data with the master server and handling read operations.
Having multiple connected slaves can improve the availability and read performance of the Redis cluster.
However, it also increases the complexity of managing the cluster, and it's essential to monitor the replication lag of the slaves to check if the master can propagate the writes to the slaves and if there are any issues with the network connectivity.
For example, if you run the command redis-cli INFO replication on a Redis server that has two slave servers connected, you might see output like this:
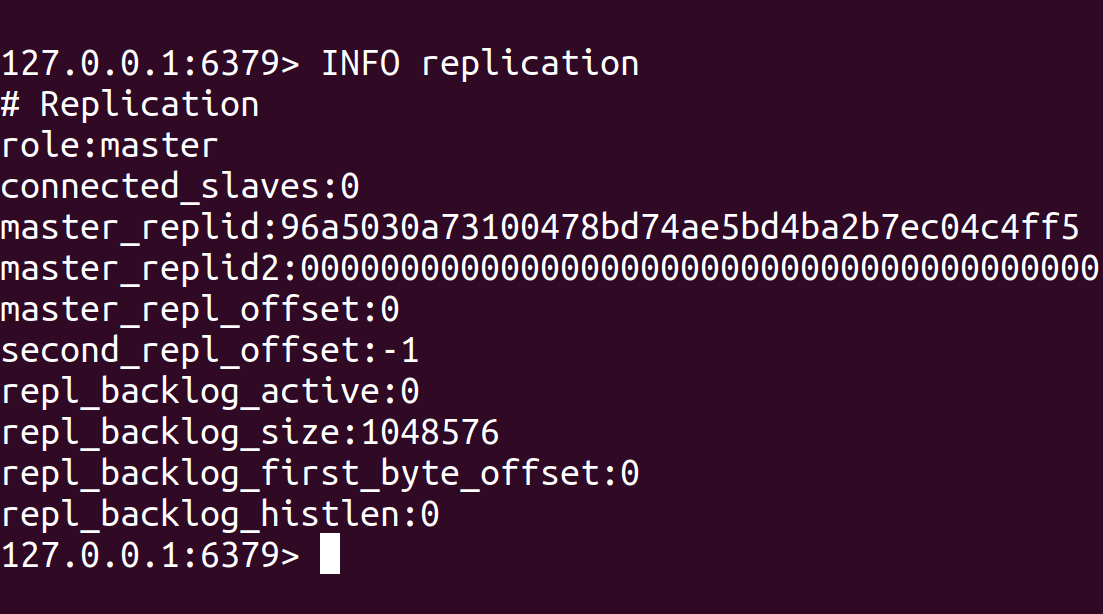
The Redis server is configured as a master and has two slave servers currently connected to it. The output also includes information about each slave server, such as its IP address, port number, replication state and replication offset, which can be useful for monitoring the replication status of the slaves.
# Replication
role:master
connected_slaves:2
slave0:ip=127.0.0.1,port=6379,state=online,offset=1234,lag=0
slave1:ip=127.0.0.1,port=6380,state=online,offset=1235,lag=0
It's also possible to use specialized monitoring tools such as Redis exporter and Prometheus Redis to monitor the performance of a Redis server and its replication status, which will automatically collect and store metrics such as connected_slaves and make it easy to create graphs and alerts based on these Redis performance metrics.
iv.) total_commands_processed
The total_commands_processed metric refers to the number of commands processed by the Redis server since it was last started. This Redis performance metric can be checked using the INFO stats command, which will return information about various statistics of the Redis server, including the total number of commands processed.
This metric can help monitor the overall activity and workload of the Redis server. For example, it can determine how many commands are being processed per second by dividing the total number of commands processed by the server's uptime.
This metric can also identify any sudden spikes in the number of commands processed, which could indicate a problem with the application or client connecting to the Redis server, such as a high number of unnecessary requests.
It does not distinguish between read and write operations, so it can be used to monitor the total number of commands processed regardless of the type of operation.
The total_commands_processed metric can also be used to monitor the Redis server's performance concerning time and compare it with the previous performance.
For example, if you run the command redis-cli INFO stats on a Redis server, you might see output like this:
# Stats

total_connections_received:100
total_commands_processed:5000
instantaneous_ops_per_sec:2
total_net_input_bytes:10000
total_net_output_bytes:20000
v.) keyspace
In Redis, a keyspace is an internal dictionary of keys that Redis uses to store all of its keys. If you use a single Redis instance, it will keep the entire keyspace on that single node.
When it comes to essential Redis monitoring metrics, there are two extra things to understand and remember. One of the components of the Redis INFO command is the keyspace. It provides information on the percentage of requests that use Redis data.
This will notify you whether or not you're taking use of Redis' speed in the memory store. Implying fundamental guideline, you aim to enhance your key's hit percentage.
For say, if you run the command redis-cli INFO keyspace on a Redis server with three databases, you might see output like this:
# Keyspace
db0:keys=1000,expires=100,avg_ttl=3600
db1:keys=2000,expires=200,avg_ttl=7200
db2:keys=3000,expires=300,avg_ttl=10800
In this example, the Redis server has 3 databases, db0, db1, and db2. The output shows that database db0 has 1000 keys in it, 100 of which have an expiration time set and an average TTL of 3600 seconds, database db1 has 2000 keys, 200 of which have an expiration time set, and an average TTL of 7200 seconds, and database db2 has 3000 keys, 300 of which have an expiration time set, and an average TTL of 10800 seconds.
This metric can be useful for monitoring the usage of the Redis server, particularly the number of keys and the rate of expiration, which can help identify any issues with the keyspace usage, such as a high number of evictions or a high number of keys with short TTLs.
4. Persistence Metrics
Redis persistence is an essential characteristic of a Redis database. Since Redis databases require replication operations for backup purposes, analyzing persistence metrics in Redis is integral.
When implementing Redis for caching, you should then facilitate Redis persistence. A Redis replica replicates everything that exists in the primary; although, once that primary resets, data may be lost.
Because when the Redis replicas replicate certain modifications to the primary, once the primary instance restarts (without persistence), the replicas attributable to it might retrieve the dataset, which is now empty.
Employing Redis as a data management tool will enable one to determine how much data will be lost if anything catastrophic happens amid writes to Redis persistence and reads to disc.
Extended write durations and a substantial number of changes between writes to disc could further implicate the systems to loss of data. When adopting Redis replication, you might be required to configure Redis persistence, which signifies one must give heed to metrics pertaining to it.
Some examples of persistence metrics in Redis include:
- RDB last save time: the timestamp of the last time an RDB file was saved. This metric can be checked using the
INFO persistencecommand. - RDB changes since last save: the number of changes made to the dataset since the last RDB save. This metric can also be checked using the
INFO persistencecommand. - AOF rewrite in progress: a flag indicating whether an AOF rewrite operation is currently in progress. This metric can also be checked using the
INFO persistencecommand. - AOF last rewrite time: the timestamp of the last time an AOF file was rewritten. This metric can also be checked using the
INFO persistencecommand. - AOF current size: the current size of the AOF file in bytes. This metric can also be checked using the
INFO persistencecommand. - AOF buffer length: the length of the AOF buffer in bytes. This metric can also be checked using the
INFO persistencecommand.
Key Metrics
| Category | Metric |
| Stats |
instantaneous_ops_per_sec
hit rate* evicted_keys rejected_connections keyspace_misses |
| Memory |
used_memory
mem_fragmentation_ratio |
| Clients |
blocked_clients
connected_clients |
| Persistence |
rdb_last_save_time
rdb_changes_since_last_save |
| Replication |
master_link_down_since
connected_slaves master_last_io_seconds_ago |
| Keyspace | keyspace size |
There is one exception to this above table, which is the hit rate, which is determined by keyspace_hits and keyspace_misses metrics from Stats:
HitRate=keyspace_hits/(keyspace_hits+keyspace_misses)Monitor Redis Metrics with Atatus
Atatus provides you with intricate and in-depth insights into your web and backend applications in real-time. Analyze application metrics, logs, and traces to make more informed business decisions.
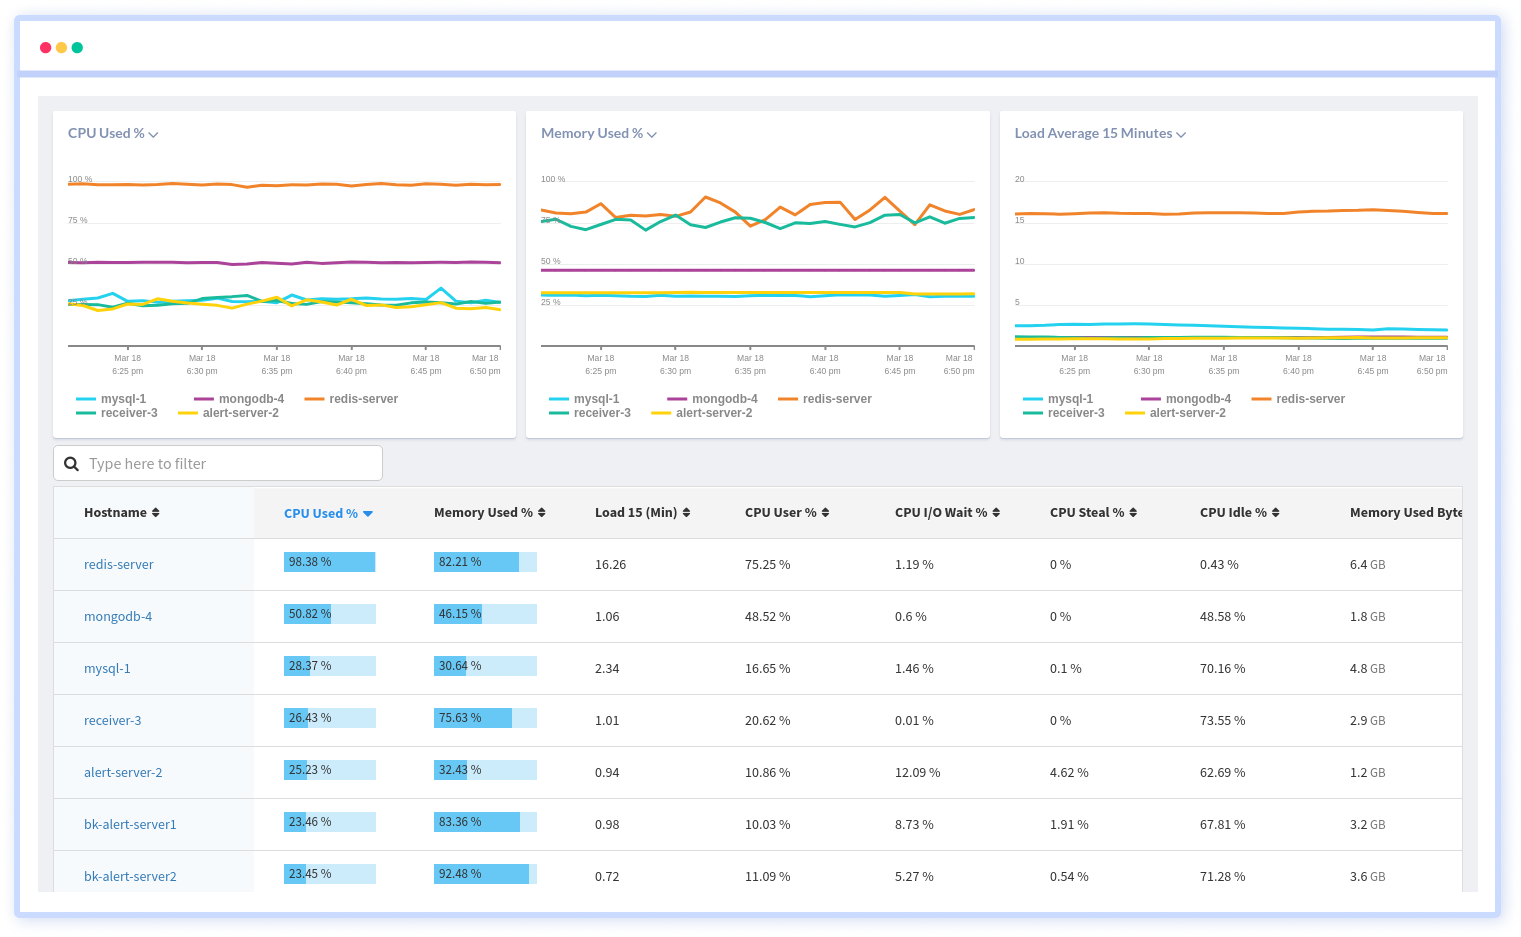
Redis's plugin for infrastructure monitoring collects all the metrics needed for monitoring. This tool gives you an insight into their performance, including CPU usage, memory usage, load averages, etc.
Atatus' package tracking feature allows you to track different packages on different hosts using different versions of the packages. Integrate it with other management systems, such as JIRA, PagerDuty, VictorOps, etc.
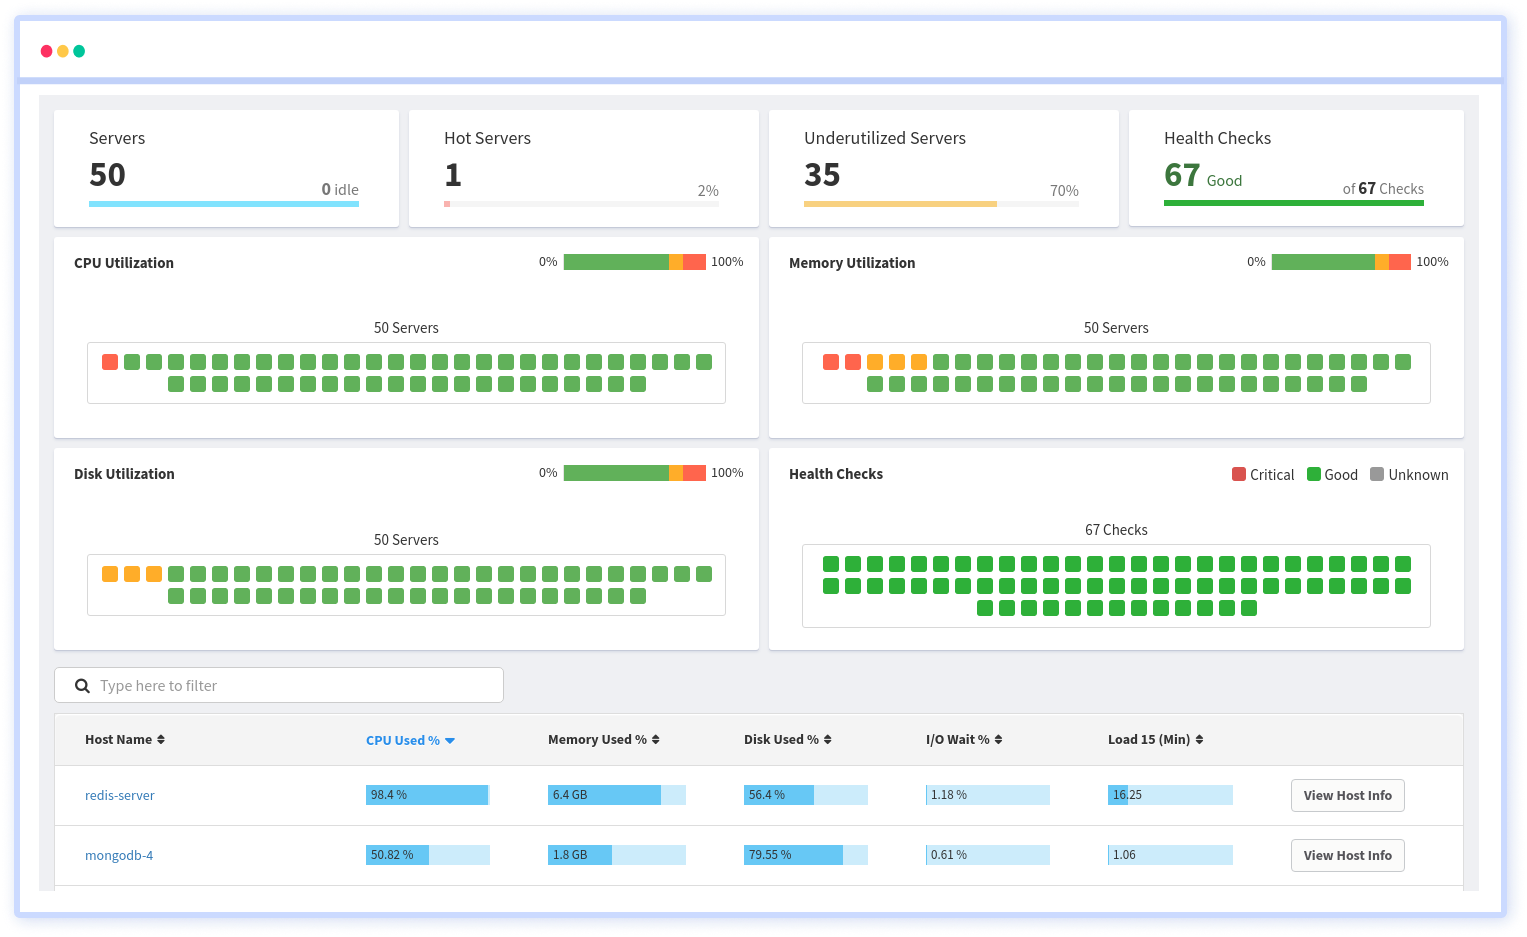
An Integrated platform for visualizing and managing server installations, updates, removals, and modifications. A real-time performance dashboard allows users to identify vulnerable packages, packages that require updating, and the overall health of servers by defining and retrieving them.
Final Thoughts
A prominent in-memory database in the domain is Redis. It provides the potential to simultaneously deliver data as a key-value focused NoSQL database.
Ensures that you are reminded of potential problems before the apps or users do in order to prevent interruptions or performance degradation. Defining the common metrics and also how your Redis instances and clusters are impacted by it is vital for troubleshooting.
Determining the key performance metrics for Redis as well as how they hinder the Redis instances and clusters can enable you to avoid such issues from distorting the services or users.
Conversely, incorporating Redis within your stack may significantly assist with those concerns. By implementing Atatus to keep track of how a server is performing strategically, it can provide the most reliable solution for obtaining and interpreting data.
Redis Monitoring with Atatus
Track the availability of the servers, hosts, virtual machines and containers with the help of Atatus Infrastructure Monitoring. It allows you to monitor, quickly pinpoint and fix the issues of your entire infrastructure.
In order to ensure that your infrastructure is running smoothly and efficiently, it is important to monitor it regularly. By doing so, you can identify and resolve issues before they cause downtime or impact your business.
It is possible to determine the host, container, or other backend component that failed or experienced latency during an incident by using an infrastructure monitoring tool. In the event of an outage, engineers can identify which hosts or containers caused the problem.
As a result, support tickets can be resolved more quickly and problems can be addressed more efficiently.
#1 Solution for Logs, Traces & Metrics
![]() APM
APM
![]() Kubernetes
Kubernetes
![]() Logs
Logs
![]() Synthetics
Synthetics
![]() RUM
RUM
![]() Serverless
Serverless
![]() Security
Security
![]() More
More