Monitoring Redis Performance Metrics
Redis, as an in-memory data store, excels at providing high-speed data access and manipulation. However, without effective monitoring, the potential advantages of Redis can be compromised due to performance bottlenecks, scalability issues, and resource constraints.
By closely scrutinizing key metrics, Redis monitoring allows you to proactively detect and address potential problems, ensuring the stability, reliability, and high-performance operation of your Redis environment.
This practice not only aids in preventing system downtimes but also facilitates efficient resource allocation, capacity planning, and the optimization of Redis to meet the evolving demands of your applications.
In essence, Redis monitoring serves as the vigilant guardian, ensuring that your Redis infrastructure functions seamlessly, delivering the desired speed and responsiveness that your applications and services depend on.
In the following sections, we will delve into the crucial reasons and benefits of Redis monitoring, helping you understand why it is an indispensable practice for modern data management systems.
Table Of Contents:-
- Why Redis?
- Set Up and Configuration
- Redis Monitoring Metrics
- Benefits of Monitoring Redis
- Atatus Redis Monitoring
- Other Popular Redis Monitoring Tools
Why Redis?
Redis is an in-memory data structure store that can be used as a database, cache, and message broker. Redis primarily stores data in memory, which allows for extremely fast read and write operations.
However, it also supports optional disk persistence, allowing data to be saved to disk. It provides a rich set of data structures, making it more than just a key-value store. You can use it for tasks like caching, counters, queues, and even implementing complex data structures like graphs and geospatial indexes.
It is often referred to as a data structure server because it can store and manipulate a wide variety of data structures, including strings, hashes, lists, sets, sorted sets, bitmaps, and more.
Redis is widely used in various industries and applications, including e-commerce, social media, gaming, and distributed systems, where speed, simplicity, and scalability are critical.
Common use cases for Redis include:
- Caching - Storing frequently accessed data in memory to reduce database load and improve response times.
- Real-time Analytics - Aggregating and analyzing data in real-time, such as counting clicks or tracking user behavior.
- Session Store - Managing user sessions in a scalable and fast manner.
- Queues - Implementing message queues and task processing.
- Leaderboards and Counters - Tracking scores, rankings, and counters in online games or applications.
- Pub/Sub - Implementing publish/subscribe messaging systems for chat applications, notifications, and more.
Setup & Configuration
You can install Redis on most Unix-like systems using package managers, or you can compile it from source.
On ubuntu/Debian:
sudo apt update
sudo apt install redis-server
On CentOS/Red Hat:
sudo yum install redisBy default, Redis binds to localhost (127.0.0.1). If you want to allow remote connections, set the bind directive to the server's public IP or 0.0.0.0 for all available network interfaces. Be cautious when allowing remote access due to security considerations.
Enable password protection by setting the requirepass directive. It's essential to secure your Redis instance with a strong password.
Configure data persistence. Redis supports two methods: RDB snapshots and AOF logs. Customize the save and appendonly directives accordingly. Set the maxmemory directive to limit the amount of RAM Redis can use. It's crucial for memory management.
After installation and configuration, you can start the Redis server using the following command:
sudo systemctl start redisRedis Monitoring Metrics
Due to its in-memory nature, performance is paramount. Monitoring Redis ensures that you can spot and rectify performance bottlenecks, scaling issues, or resource constraints before they escalate to bigger problems.
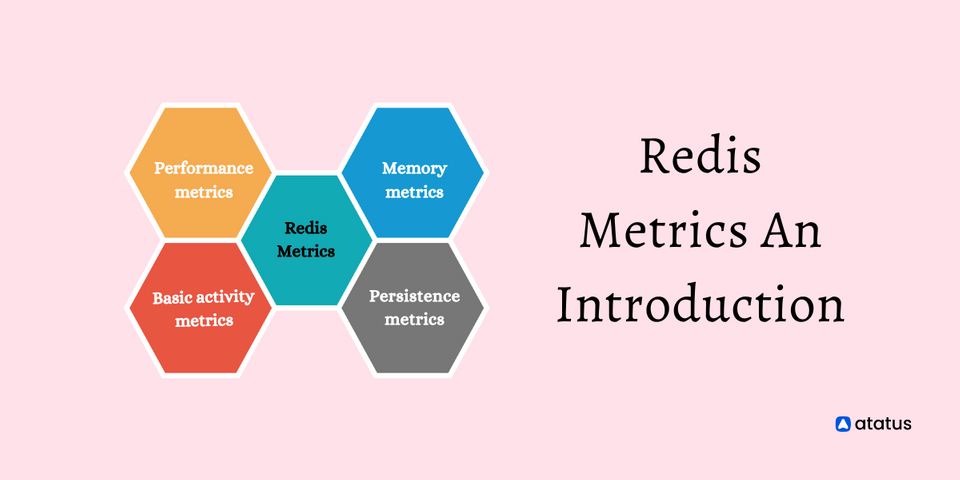
Key Metrics to Monitor
For ease of understanding, we are dividing the overall metrics under different subheadings.
1. Performance Metrics:
- Throughput: This measures the number of operations processed per second. Monitoring commands per second can give insights into the load on your Redis server.
- Latency: Measures the time it takes for a command to execute. Keeping an eye on the average and percentile latencies can help detect performance bottlenecks.
2. Memory Metrics:
- Used Memory: The total number of bytes allocated by Redis. This metric can indicate if you're approaching the system's memory limits.
- Memory Fragmentation Ratio: The ratio of memory allocated by the operating system to memory allocated by Redis. If this ratio is too high, it might indicate memory fragmentation.
- Evicted Keys: The number of keys removed from the cache to free up memory. A high number can indicate that the dataset is too large for the available memory, causing Redis to evict keys.
- Cache Hit/Miss Rate: The ratio of successful reads (hits) to unsuccessful reads (misses). A low hit rate could indicate ineffective caching strategies.
- CPU Usage: Redis is single-threaded for command execution, so monitoring the CPU usage can help detect CPU-bound operations and identify potential bottlenecks.
3. Persistence Metrics:
- Changes Since Last Save: Measures the number of changes pending to be written to disk. If this number grows too large, there may be an issue with your disk persistence.
- RDB Last Save Time: Indicates the duration since the last RDB snapshot was created. It's useful to know when the last successful save occurred.
- AOF (Append Only File) Rewrite: It's crucial to track how often AOF rewrites occur and how long they take. Long rewrites can indicate a need for optimization.
4. Replication Metrics:
- Connected Slaves: The number of slave nodes connected to a master. A sudden drop might indicate network issues or problems with the slave nodes.
- Replication Lag: The delay between the master's last write and the slave's last replicated write. High lag can cause data inconsistency issues.
5. Network Metrics:
- Network Bandwidth: Monitoring incoming and outgoing traffic can provide insights into the network's performance and detect potential bottlenecks.
- Connected Clients: The number of client connections to Redis. A sudden increase might indicate a spike in application traffic or issues with client connection management.
- Rejected Connections: The number of connections rejected because of the maxclients limit.
6. Server Metrics:
- Uptime: The duration the Redis server has been running. It's a simple metric but can be used to detect unexpected restarts.
- Blocked Clients: The number of clients waiting for a blocking call (e.g., BLPOP) to complete.
Benefits of Monitoring Redis
By keeping a close eye on Redis, organizations can preemptively identify performance bottlenecks, ensuring that their infrastructure remains responsive even under heavy loads. This proactive approach can often mean the difference between smooth operations and frustrating downtimes.
Further, monitoring allows for the efficient allocation of resources. It informs teams about memory utilization, CPU loads, and network traffic patterns, facilitating the optimization of hardware and software configurations. By understanding these metrics, businesses can avoid over-provisioning, which can be costly, or under-provisioning, which might lead to service interruptions.
Redis monitoring also plays a vital role in capacity planning. By analyzing trends in data growth, connection counts, and query rates, teams can predict future resource needs and scale their infrastructure accordingly. This foresight ensures that applications remain performant even as user bases grow or data-intensive operations increase.
Security and data integrity are other areas where monitoring shines. Tracking unauthorized access attempts, abnormal connection patterns, or unexpected data evictions can help in quickly identifying and mitigating potential security threats or data inconsistencies.
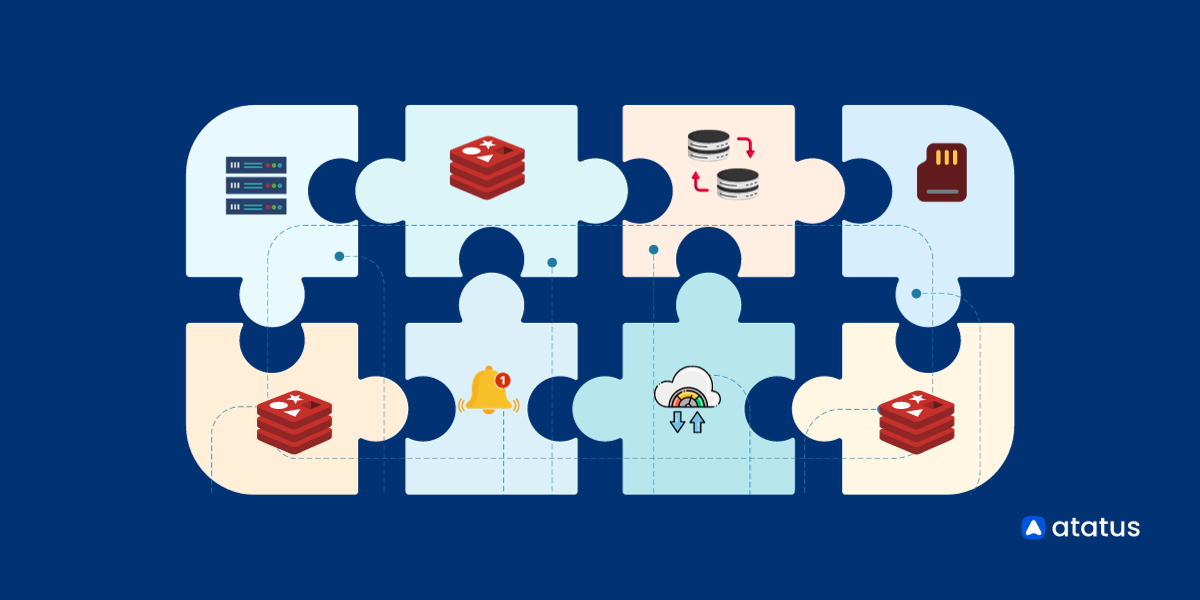
Redis Monitoring with Atatus
Monitoring Redis using Atatus is a best-practice approach for maintaining your Redis infrastructure's health, performance, and stability. Atatus is a popular monitoring and analytics platform that provides various tools for monitoring various services and systems, including Redis.
They offer:
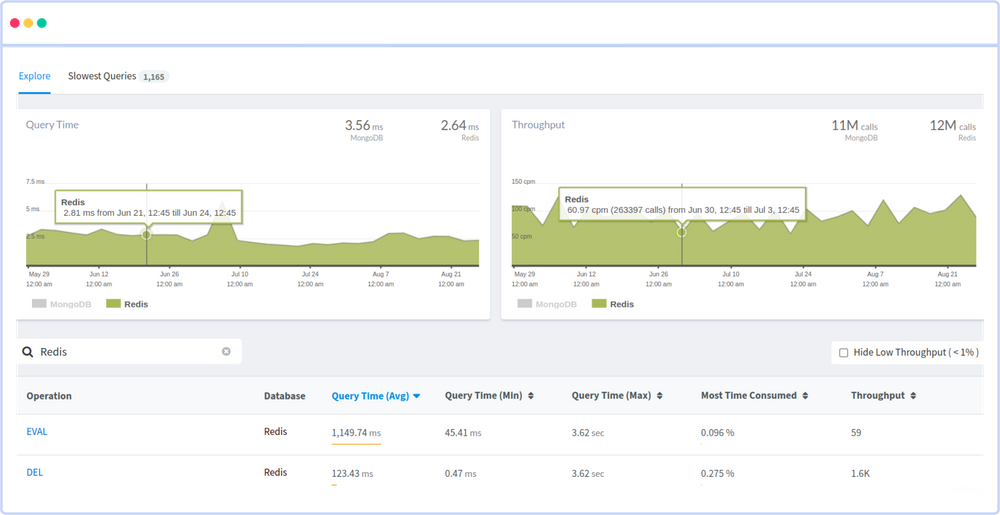
- Problem Diagnostics - Troubleshoot issues quickly by drilling down into detailed Redis metrics.
- Latency Analysis - Pinpoint delays in data retrieval and updates, ensuring optimal responsiveness of your Redis operations.
- Throughput Insights - Monitor request and command rates to fine-tune Redis for maximum throughput, preventing performance bottlenecks.
- Memory Utilization - Keep track of memory usage trends to prevent out-of-memory crashes and optimize data storage.
- Capacity Planning - Make informed decisions about scaling resources based on usage patterns.
- Connection Tracking - Track connections in real-time to manage resource allocation and ensure efficient network usage.
Adopting Atatus will ensure that you keep your data-store in check while also improving on performance and reliability of the Redis Package.
Try their Redis Monitoring Solution free for upto 14 days now!
Other Popular Redis Monitoring Tools
Redis comes with a built-in command-line interface (redis-cli) that allows you to interact with Redis and retrieve real-time information. The INFO command provides comprehensive server statistics.
- Redis Sentinel is another built-in high-availability solution for Redis. It provides monitoring and automatic failover for Redis instances. It can be used to detect and manage issues in a Redis cluster.
- Prometheus is a popular open-source monitoring and alerting system. The Redis Exporter collects Redis metrics and makes them available for Prometheus to scrape. Grafana can be used for visualization.
- AppDynamics is an application performance monitoring and management solution that includes support for Redis.
- Nagios is a popular open-source monitoring and alerting system that can be configured to monitor Redis using custom plugins.
- Datadog is a cloud-based monitoring and analytics platform that offers Redis monitoring. It provides pre-built dashboards, alerting, and anomaly detection for Redis.
- New Relic is another cloud-based monitoring platform that offers Redis monitoring capabilities. It provides real-time performance metrics, alerts, and application performance monitoring (APM) features.
- Dynatrace is an AI-driven observability platform that provides Redis monitoring and automatic root cause analysis for performance issues.
- Zabbix is an open-source monitoring solution that can be extended to monitor Redis. You can create custom templates to monitor Redis instances and set up alerts.
Conclusion
Lastly, monitoring aids in fine-tuning the Redis configuration for specific use cases. Organizations can adjust various Redis parameters to suit their unique needs by analyzing real-world usage patterns and performance metrics, ensuring optimal performance.
Effective Redis performance monitoring helps maintain a robust and responsive data layer, ensuring that your applications deliver a seamless user experience. It also aids in proactively addressing issues, preventing downtime, and optimizing resource utilization.
In essence, monitoring Redis not only ensures the health and performance of the system but also drives cost efficiency, security, and future readiness.
#1 Solution for Logs, Traces & Metrics
![]() APM
APM
![]() Kubernetes
Kubernetes
![]() Logs
Logs
![]() Synthetics
Synthetics
![]() RUM
RUM
![]() Serverless
Serverless
![]() Security
Security
![]() More
More