8 Best Sentry Alternatives You Should Try in 2025
Selecting the best sentry alternatives for error monitoring is likely to be difficult. It might be difficult to sort between the features, benefits, and drawbacks of many software companies and sellers. Let's talk about how to make this process easier by looking at the eight best alternatives to Sentry.
Sentry is an open-source application performance and error-tracking tool that allows developers to track and fix exceptions in real-time. It provides both a cloud-hosted and a self-hosted software-as-a-service (SaaS) solution, both of which are functionally identical. Self-hosted Sentry may soon become expensive to operate, grow, and support for many clients, making SaaS offering a better and less expensive alternative.
About Sentry
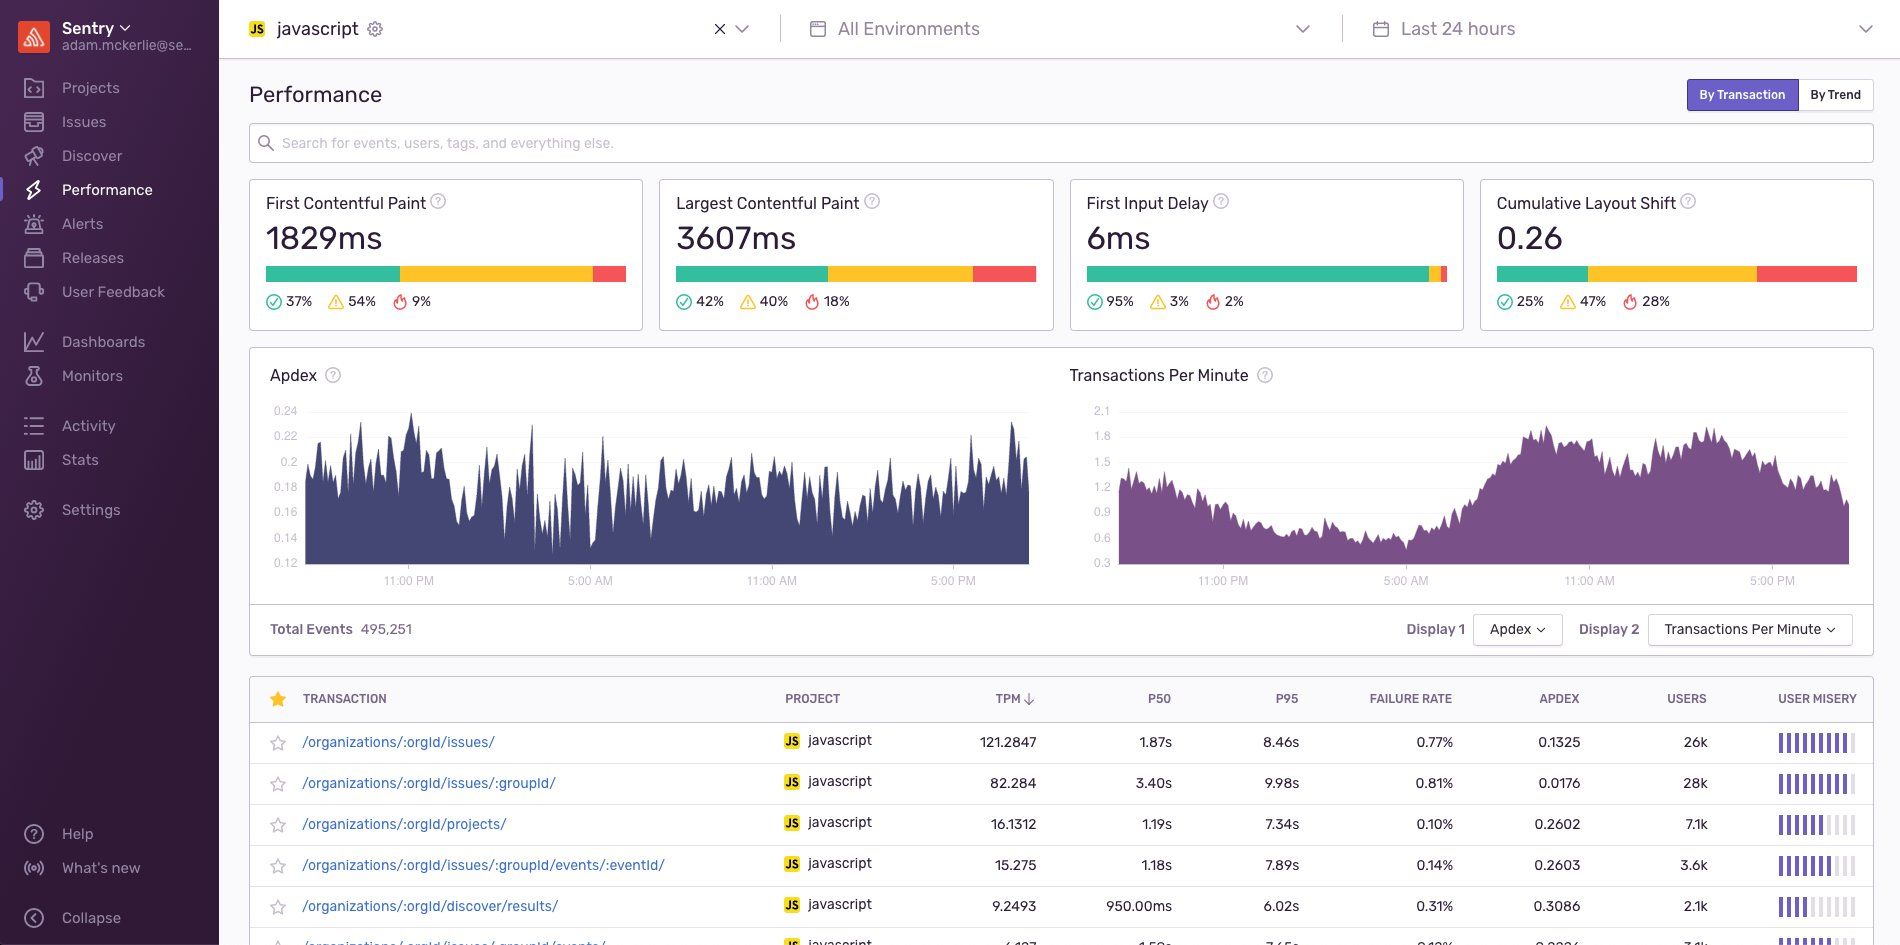
Sentry monitors application performance, measures metrics like throughput and latency, and illustrates the effect of mistakes across various services via performance monitoring. Sentry measures specific services and operations within those services by capturing distributed traces made up of transactions and spans.
Sentry's Dashboards allow you to navigate through exception and performance data across various projects to get a broad picture of your application's health. Each widget visualizes one or more Discover queries, and dashboards are made up of one or more widgets.
By adding on and improving your error data, the Discover tab provides visibility into your data across environments. All in one spot, you can query and access insights into the health of your entire system, as well as gain answers to crucial business concerns. Customers on the Team or Business plans have access to Discover, which allows them to see all of the data submitted to Sentry.
Sentry may collect data on Content-Security-Policy (CSP) violations, as well as Expect-CT and HTTP Public Key Pinning (HPKP) failures, by setting the appropriate HTTP header that causes the violation or failure to be delivered to the Sentry endpoint given in report-uri.
Alerts give you real-time visibility into code issues and their consequences for your users. There are a variety of notifications to choose from, each with its own set of thresholds and connectors.
Sentry provides a free plan with release tracking and community forums. The paid plan starts from $26/month. You can also request a demo of their product.
Sentry's overwhelming UI and poor alert configuration is a major weakness because of that users jump to its alternatives. In this article, we have listed sentry alternatives in detail.
Top 8 Sentry Alternatives to Try
#1 Atatus
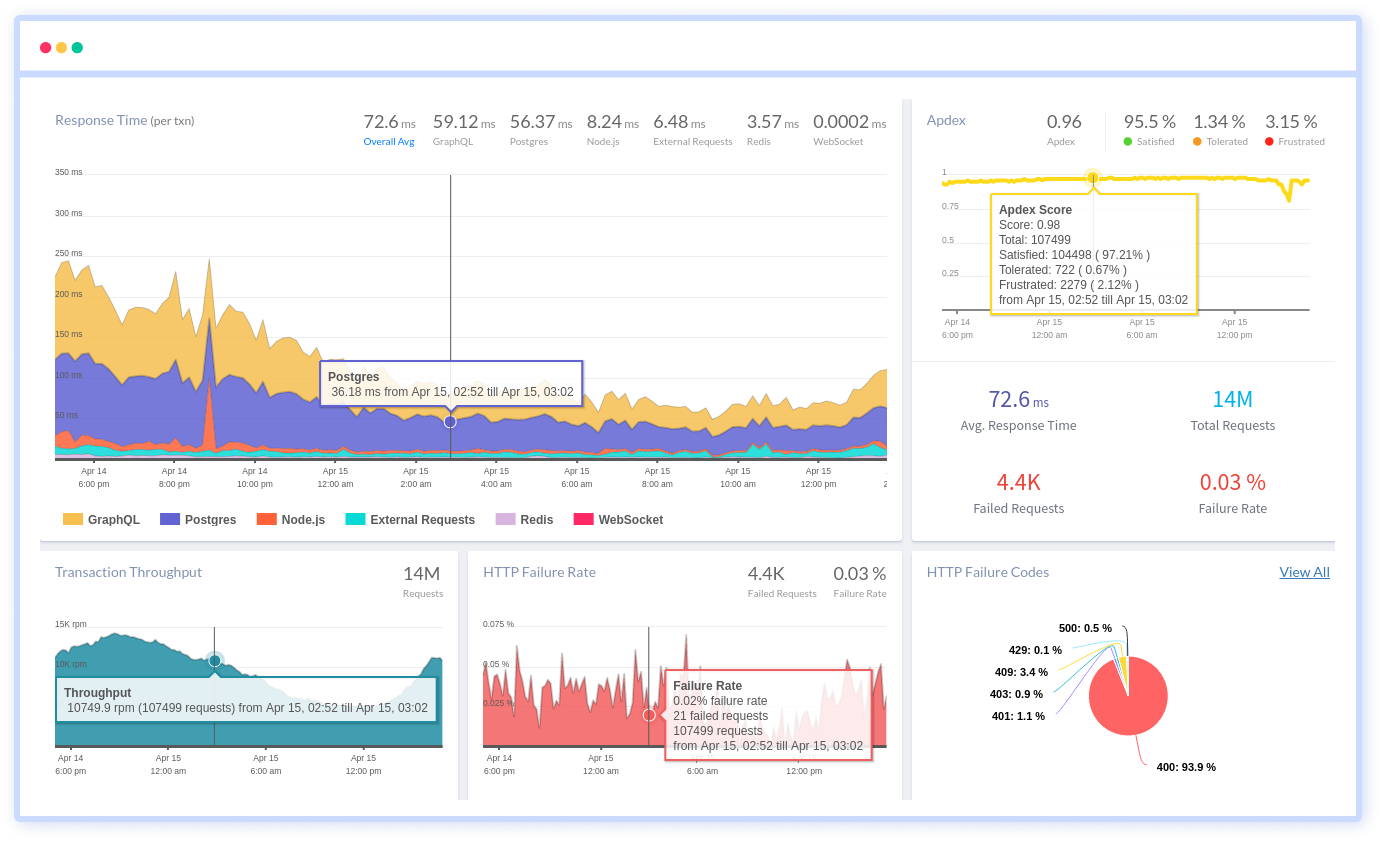
Atatus is one of the best sentry alternatives in the market which is a SaaS-based Observability solution that provides full-stack visibility across all of your applications. You can use the data to see how well your front-end (Browser Monitoring), back-end (Application Performance Monitoring), and servers (Infrastructure Monitoring) performed overall. We also provide Uptime Monitoring and API Analytics.
It gives you a complete picture of all the application performance metrics you need to build high-quality, dependable software. You will be notified as soon as the problem arises. It contains details about who, when, and what caused the performance drop. It provides performance monitoring data, including APM instrumentation, chart views, and alert notification.
Atatus keeps track of the performance of your web applications in real-time. For all of your assets, you'll also get data on browser metrics like page load time and JS exceptions, allowing you to identify why a user is experiencing performance issues and what they should do to improve their web application's performance. Atatus keeps track of ajax queries, individual websites, JS exceptions, and session traces.
By analyzing the complicated frontend performance issues caused by slow page loading, delayed static assets, and ajax queries, you can optimize end-user performance with Real User Monitoring (RUM). You can also keep track of errors and won't ignore errors that affect your customers' experience.
Java, PHP, Node.js, Ruby, Python, and React are all supported by Atatus. Integrations allow you to obtain more information about your systems. Slack, Jira, GitLab, Asana, PagerDuty, Codeship, VictorOps, and other tools are all integrated. The Atatus APM integration integrates your server and application monitoring.
The Atatus alerting system makes it simple and quick to transmit notifications. Individual alerts for browser, application, and infrastructure monitoring are now available. To receive your Atatus alerts, you can choose from a variety of notification options. The alert policy, alert rules, threshold values, alert issues, events, and occurrences will also be discussed.
We provide a 14-day free trial with no credit card required and the option to cancel at any time.
#2 Raygun
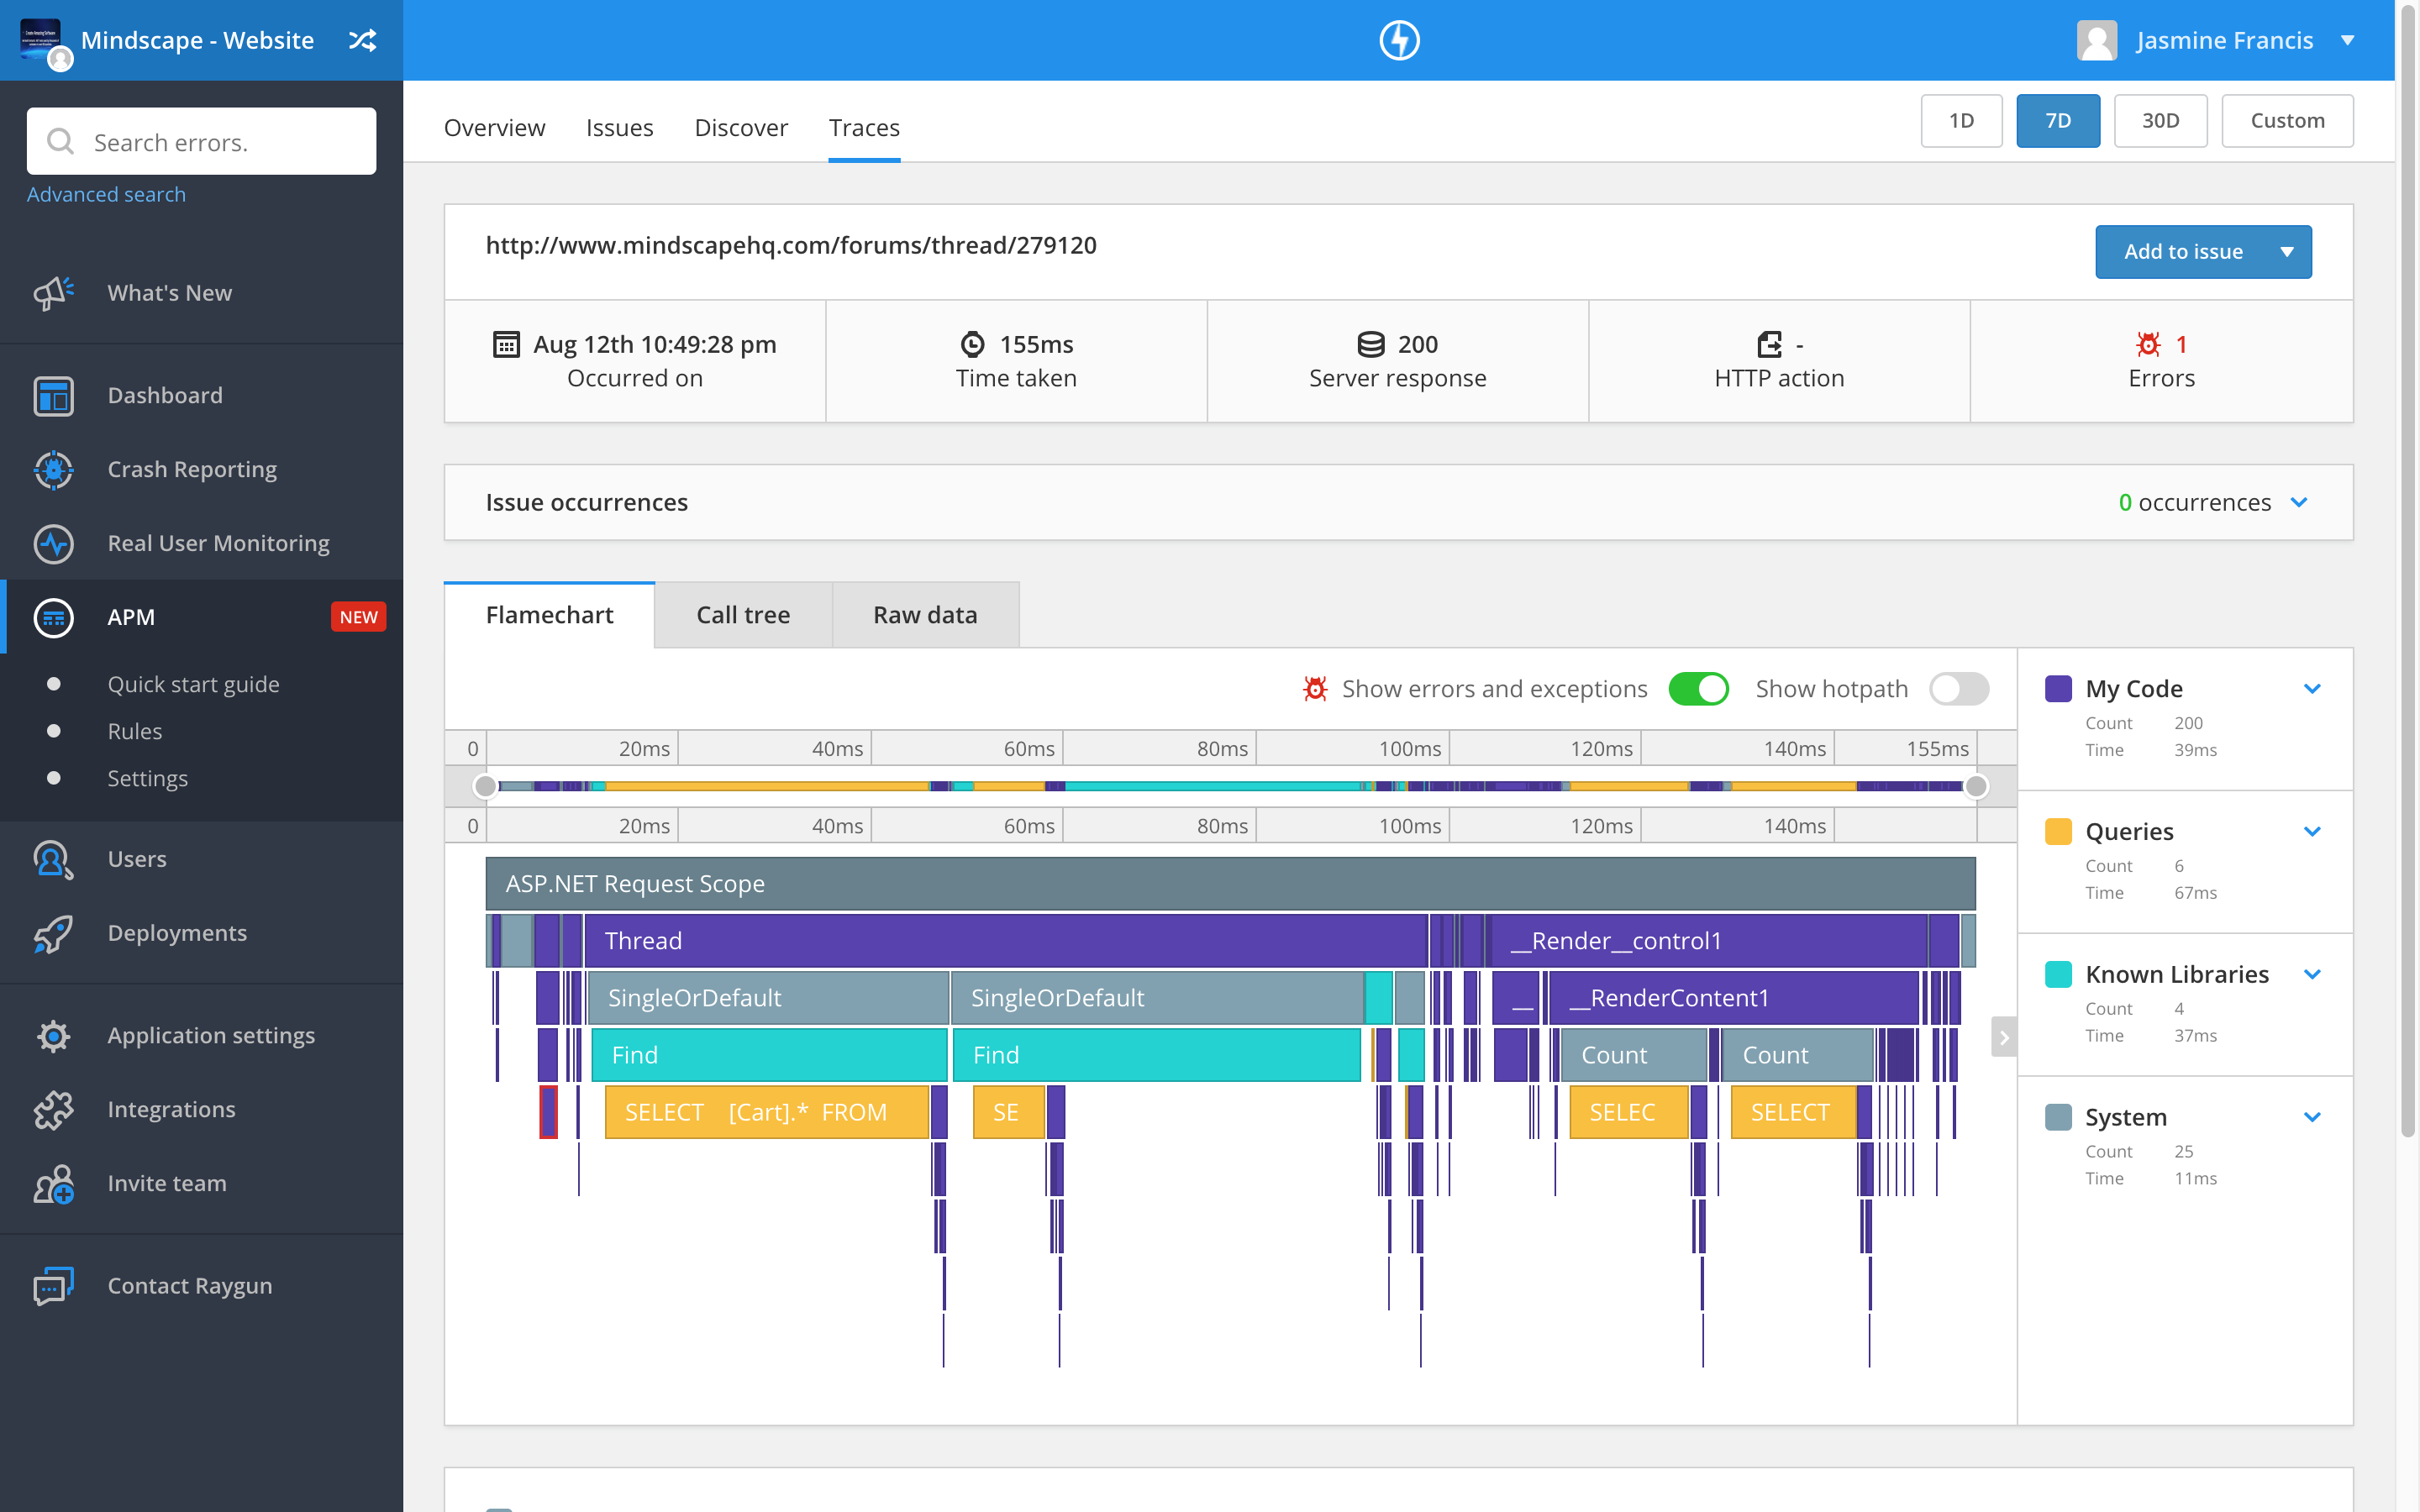
Raygun is a cloud-based network monitoring and bug tracking application that provides instant visibility into the health of your software. For huge and midsize businesses in a range of industries, crash reporting, user monitoring, user tracking, deployment tracking, and connections with other applications are provided. There are several choices for on-premise setup.
It also keeps track of an application's full-stack. Users may view client lists, track session data, and analyze how users interact with applications. Users can use diagnostic data and workflow tools through feedback to help them detect, reproduce, and resolve problems.
Raygun is a server-side application performance monitoring solution that elevates software development and management to a new level of complexity. It gives trends and real-time data about your application's server performance and user experience. In addition to Crash Reporting and Real User Monitoring (RUM), the Raygun platform monitors your entire technological stack and alerts you when exceptions and performance concerns arise.
Data from various applications, portions of an application, or development environments are segmented by Raygun applications. To catch exceptions that harm customers, Crash Reporting should be put up in production as soon as possible. It's also possible to put it up in a development environment.
They provide a 14-day free trial period with no credit card necessary. Pricing starts from $8/month for APM with unlimited users.
#3 New Relic
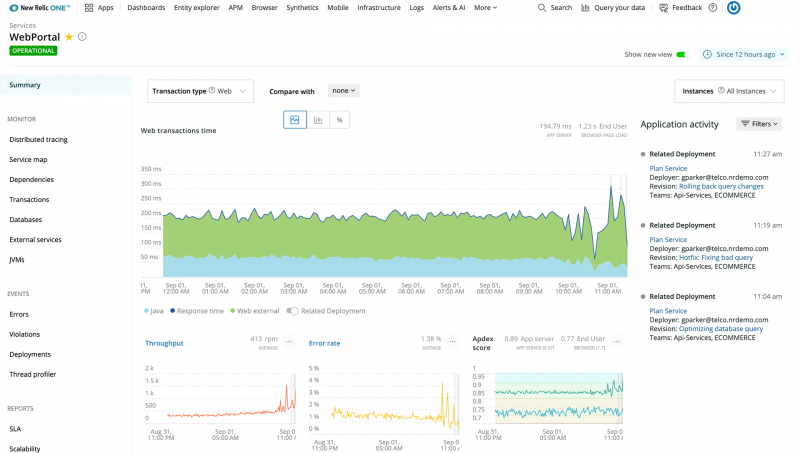
New Relic is a software observability platform that helps in software development. It is cloud-based software to help website and application owners track the effectiveness of their services.
The Telemetry Data Platform from New Relic brings all of your operational data together in one place, allowing you to ask and answer any question. With the most powerful, controlled, open, and unified telemetry platform, you can collect, explore, and alert on all your metrics, events, logs, and traces from any source.
By bringing data from every instrumented source and environment together and connecting it without having to switch tools, New Relic lets you break through the layers of complexity that surround your systems. You can identify, assess, and debug your entire software stack in one place with the tailored Observability experiences.
All of your system's entities, as well as how they're connected, are gathered in one place by New Relic Explorer, allowing you to spot performance concerns and patterns right away. By automatically linking infrastructure health with application performance and end-user behavior, you can cut through the noise to find the signal.
The AIOps solution reduces the time it takes to find, diagnose, and fix problems. It can automatically filter out alarm noise, correlate incidences, and find abnormalities because it's a hybrid machine learning engine.
You can use alerts to create strong and customized alert policies for everything you can track. Receive notifications for changes in crucial performance measurements as data from all of their products rushes in, including APM, infrastructure, browser, mobile, and NRQL queries.
They provide a free version of their product.
#4 Datadog
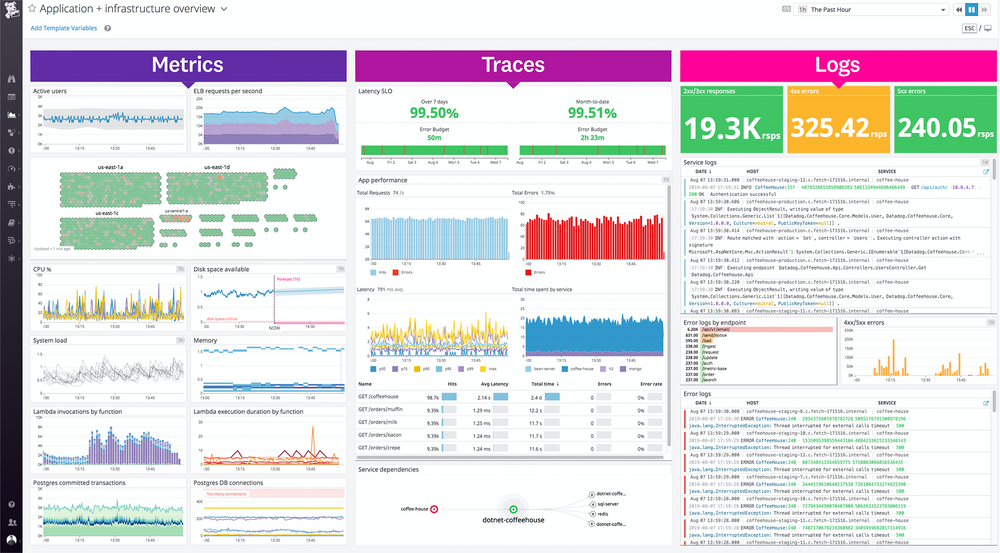
Datadog is a cloud-based application monitoring software that uses a SaaS-based data analytics platform to monitor services, databases, tools, and servers. It provides a dashboard, alerting, and metric visualization for cloud infrastructure. It expanded swiftly, adding Amazon Web Services (AWS), Google Cloud Platform, Microsoft Azure, VMware, Red Hat OpenShift, and Open Stack to its platform offerings.
It lets you track, diagnose, and improve cloud-based application performance down to a single line of code or individual customer requests. The platform presents data in built-in dashboards that are visually appealing and complement the application's many functions, such as a flame chart for trace views.
By monitoring the state of your production environment after each deployment and eliminating mistakes before your users notice them. You can use Datadog Synthetics tests directly in your CI pipeline to ensure early problem identification and minimize downtime.
Datadog monitors the performance of your webpages and APIs at several network levels, including backend and frontend, and alerts you if anything goes wrong. Monitoring all of your infrastructures in one area isn't adequate if you can't notice critical changes.
You can configure monitors, notify colleagues, and manage alerts all in one place with the Alerting platform. Datadog has official libraries for C#, Golang, Java, PHP, Python, and Ruby. Alibaba Cloud, Bitbucket, Circleci, Salesforce Desk, Hipchat, Marathon, and other services are all integrated.
They provide a 14-day free trial to discover more about their product.
#5 Bugsnag
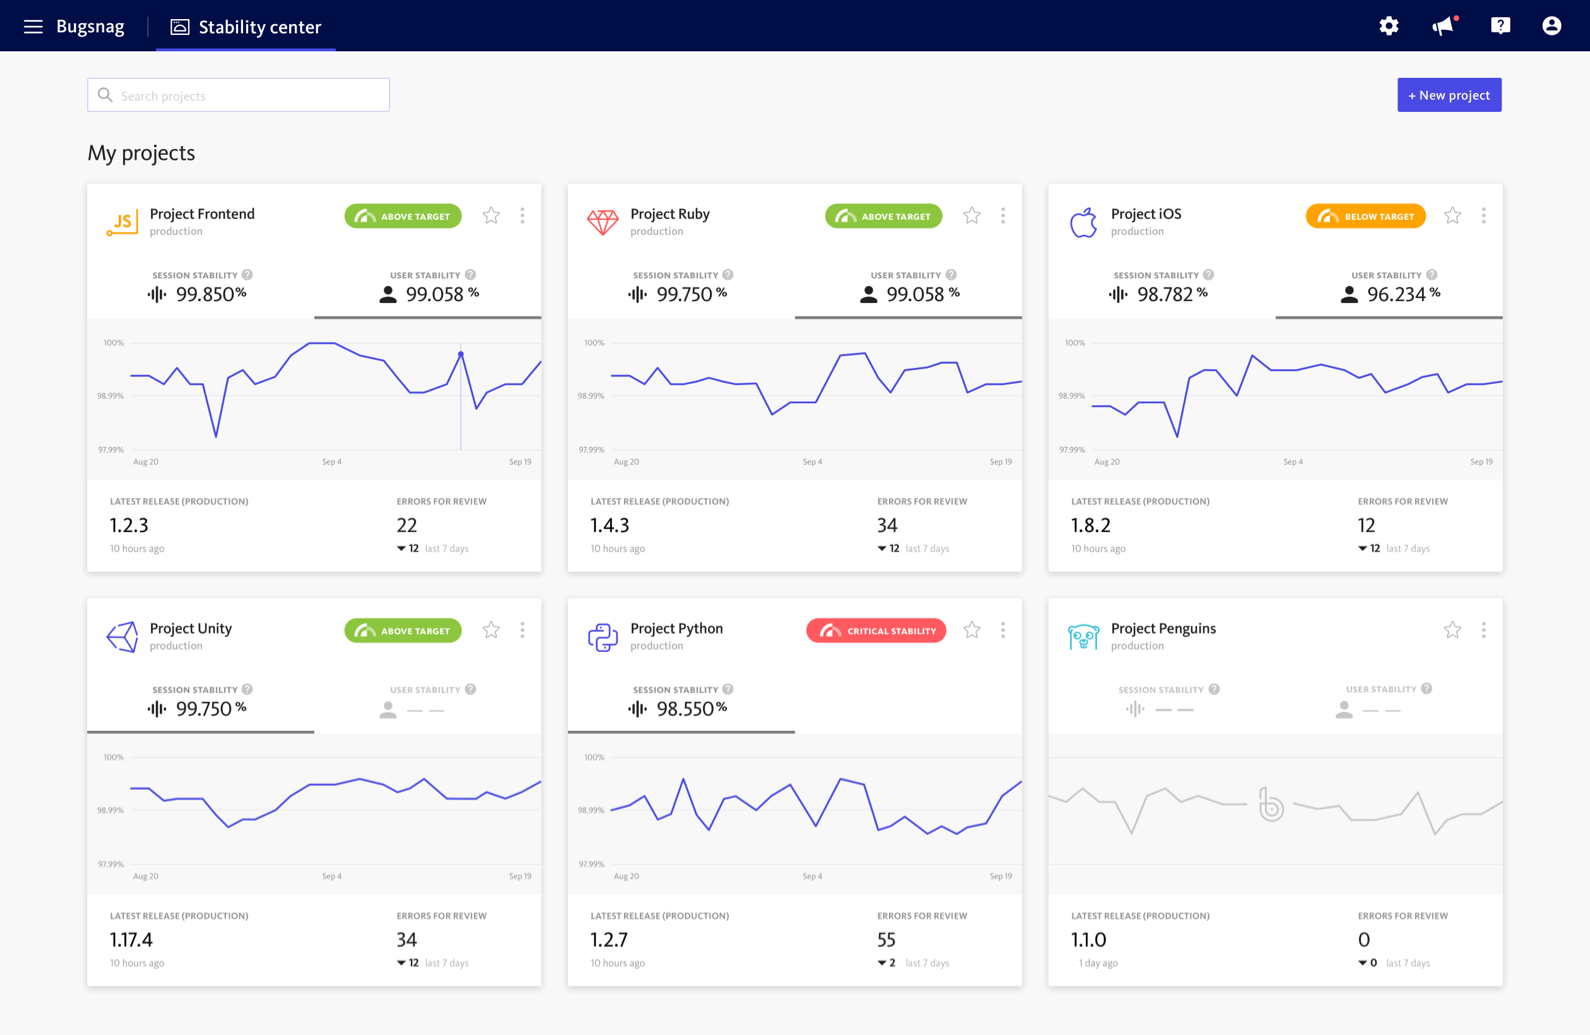
Bugsnag is another best sentry alternative which is a full-stack stability monitoring tool that analyses application stability so you can make data-driven decisions about whether you should be adding new features or addressing problems. Developers can prioritize and fix errors with speed and agility using Bugsnag's stability scores and data-driven insights, resulting in positive customer experiences and user retention.
Bugsnag creates a sense of accountability in all developers by allowing them to see the consequences of their code in real-time. This allows them to address issues before they become serious, resulting in a positive experience for both users and engineers.
It uses open source SDKs for 50+ software platforms to capture unhandled exceptions, diagnostic data, and version information in the browser, mobile, and server-side applications. Bugsnag libraries record all exceptions, version numbers, and session information by default to support engineering teams in proactively surfacing issues and reducing time spent repairing bugs.
Custom diagnostics can be added to error reports in addition to gathering critical diagnostic data with breakdowns. By serving as your primary system for error detection and prioritization, Bugsnag can help your team balance development agility with application stability.
Individual breakdowns are gathered together by root cause and displayed as discrete problems in Bugsnag, allowing for easy prioritizing. The error inbox can be sorted by event count, impacted users, error severity, or narrowed down to display a list of exceptions that satisfy a certain search criterion. Users can segment their errors based on the contents of stack traces, application versions, user information, and custom data.
They provide a free plan with automatic error caption and pricing starts from $59/month with advanced features. They also provide a 14-day free trial to discover more.
#6 LogicMonitor
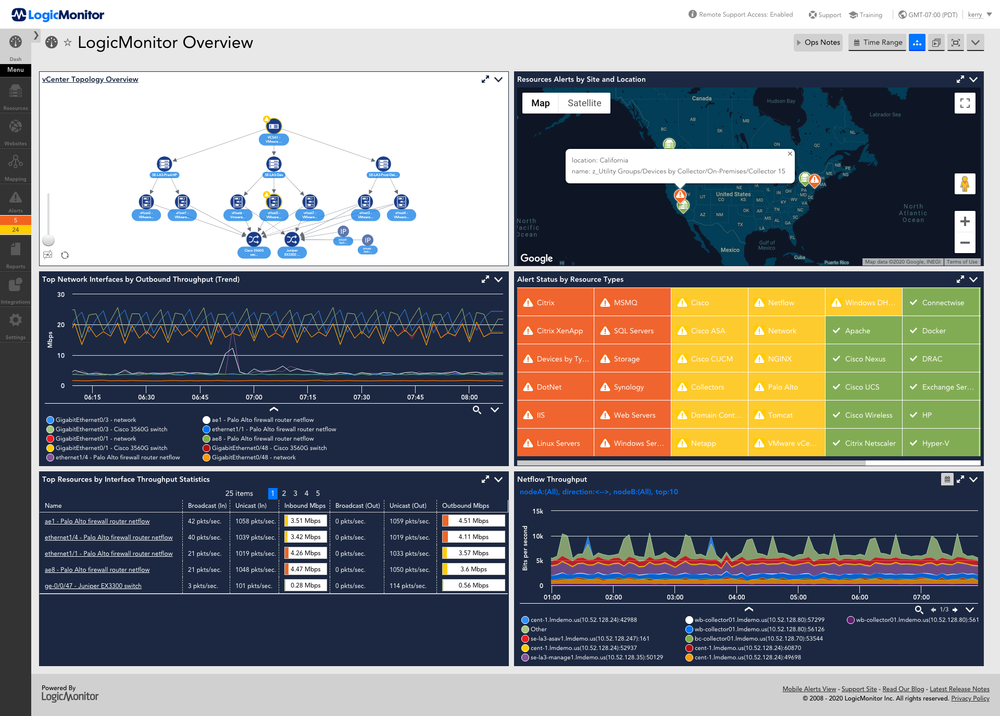
LogicMonitor provides fully automated SaaS-based data center monitoring solutions, cloud-based infrastructure monitoring, and an observability platform. IT Ops teams can manage today's sophisticated on-premise, hybrid, and cloud IT infrastructures with LogicMonitor's automated SaaS performance monitoring technology, which provides end-to-end visibility and actionable data.
It can deploy and manage your monitoring more quickly and automatically with Auto-Discovery of Devices. To act on infrastructure performance data, use built-in and customizable dashboards, performance predictions, and comprehensive reporting. It employs built-in workflow tools like alerts routing and escalation management to improve IT team responsiveness.
LogicMonitor's Distributed Tracing is an OpenTelemetry-based interface for transmitting trace data from instrumented applications and monitoring end-to-end requests as they pass across your distributed services environment. On the Traces page, these traces are displayed with critical metrics and contextual logging.
LogicMonitor Logs uses an algorithmic root-cause analysis technique to give a unique and unified manner of log analysis. It examines for normal patterns and anomalies, or deviations from the norm, in log events. These log anomaly events, as well as metric Alerts and Topology information, are shown on a Logs page to facilitate the investigation.
There are filtered Alerts pages on the detail pages of your various devices, cloud resources, instances, websites, services, and groups, as well as an overall Alerts page on the left-hand main menu that shows all alerts across your whole LogicMonitor account. Due to its alert options, LogicMonitor comes as one of the best sentry alternatives.
They provide a 14-day free trial to discover more.
#7 AppDynamics
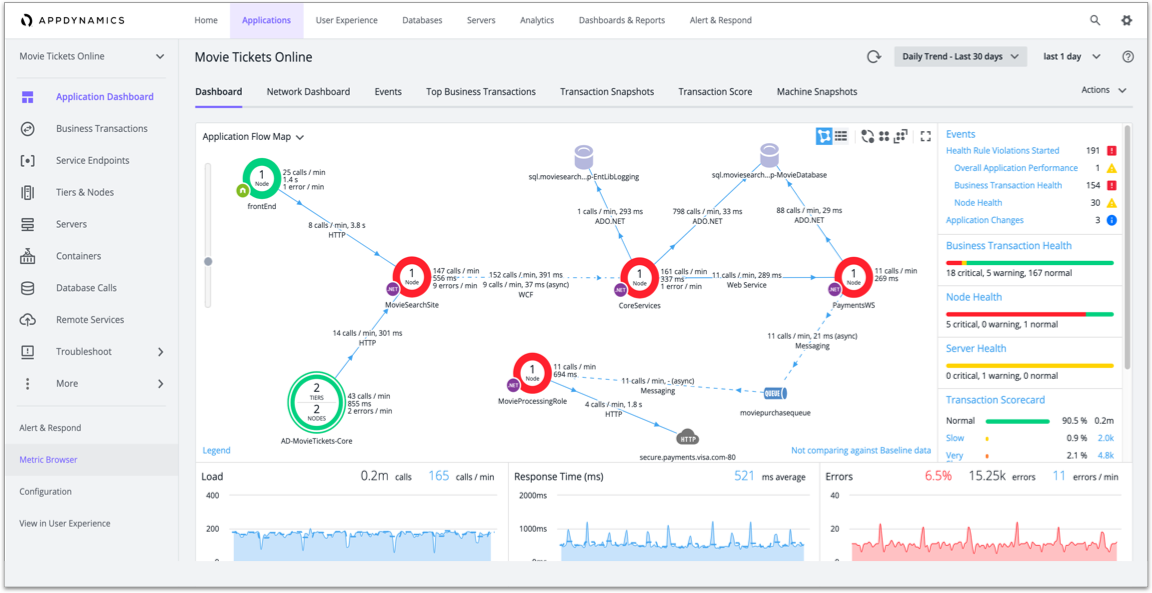
AppDynamics is a cloud-based application performance management (APM) and IT operations analytics platform for users all over the world. It specializes in cloud computing and data center application performance and availability monitoring and regulation.
It's a full-stack, business-centric AIOps platform that helps developers avoid digital performance issues by monitoring cloud-native technologies and traditional infrastructure to identify what drives user experiences and impacts organizations' bottom lines. Dynamic baselines and precise, real-time notifications provide you with a clear view of your system's optimal performance.
It enables you to manage and monitor your entire application delivery environment, including everything from mobile, browser client network requests to backend databases, servers, and everything in between. It gives you a comprehensive view of your application landscape and makes it simple to traverse across the distributed application to call graphs and exception reports generated by specific servers.
Code-level detailed monitoring is supported by AppDynamics. The application also calculates the server's trend performance and determines bottlenecks. All server-related performance issues can be promptly identified using AppDynamics.
In response to events or circumstances you describe, AppDynamics can send notifications or take action. Using the alert and reaction option, you can notice problems as they happen, or even before they happen.
AppDynamics supports Java, .NET, Node.js, PHP, Python, C/C++, and other important programming languages. Apica, CloudFabrix, Glassbox, ServiceNow, Zigiwave, and more systems are all integrated.
They provide a 15-day free trial period with no credit card necessary.
#8 Instana
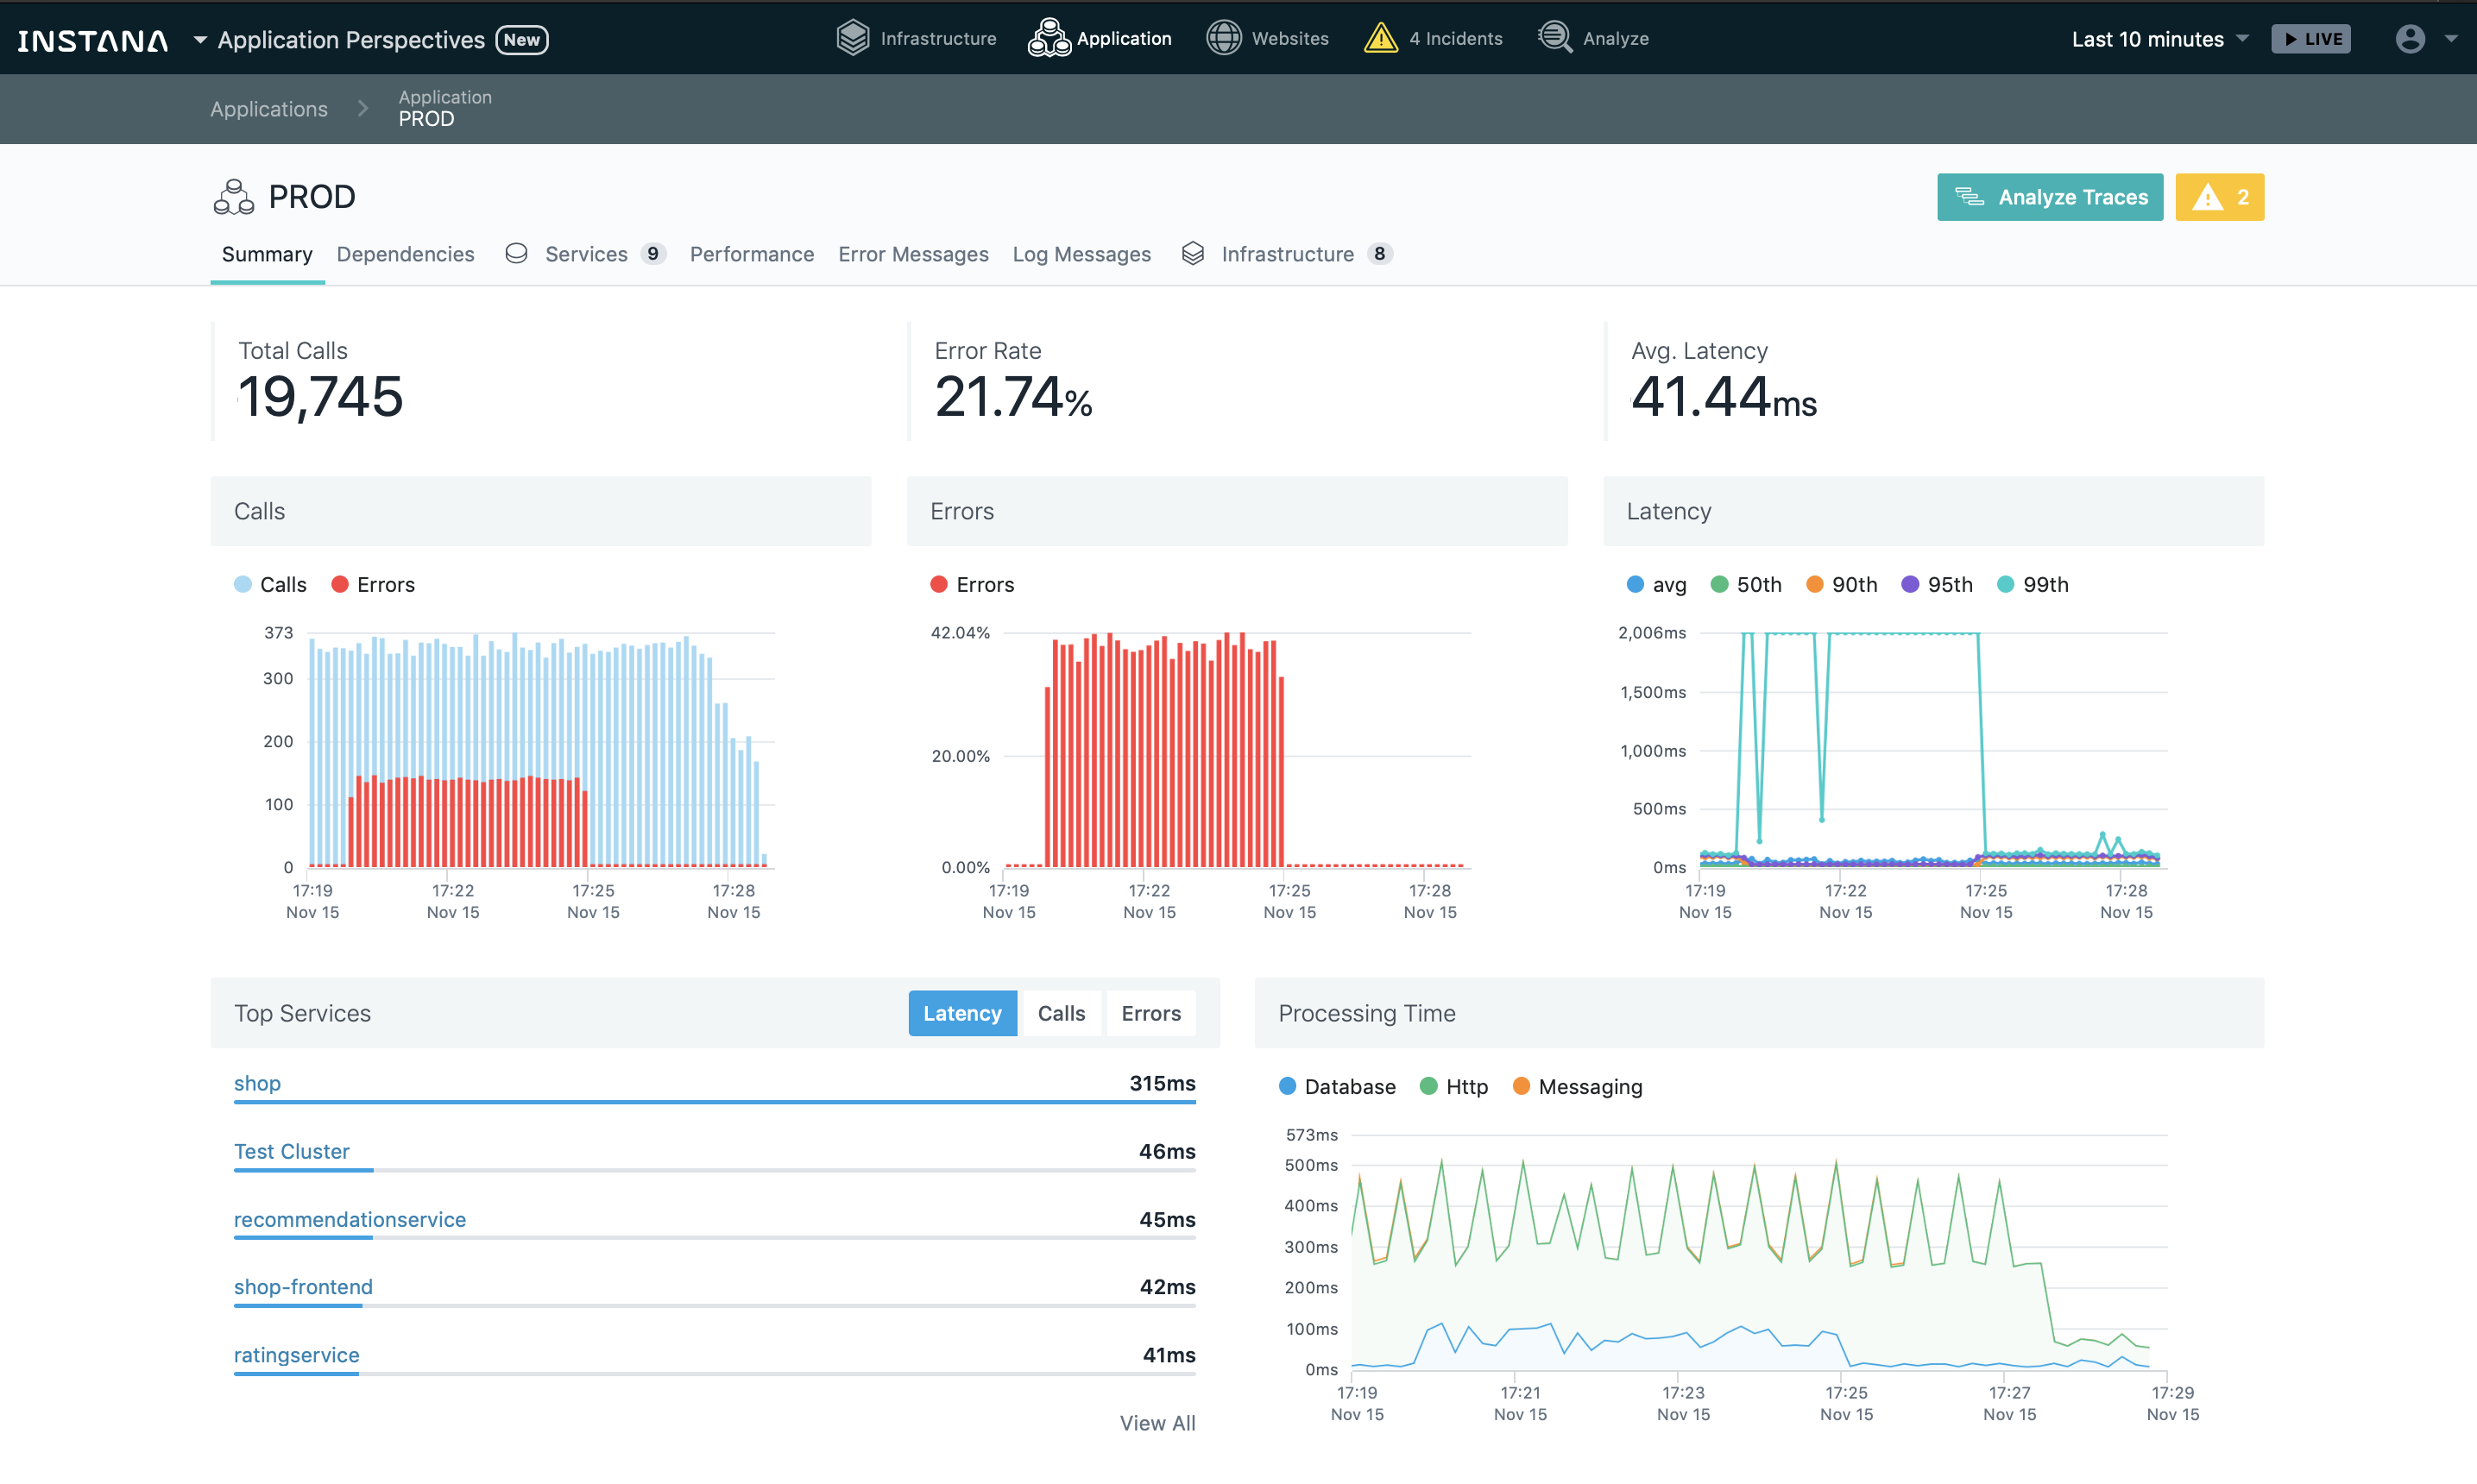
Instana is an application performance management solution for microservices and cloud-native applications that is fully automated. The system offers continuous full-stack observability of all server and application components, as well as automatic distributed tracking, for ultimate visibility. Application views are logically grouped application components, services, and transaction requests for analysis, visualization, and alerting via user interface setups.
With its application hierarchy of services, endpoints, and application perspectives across them, Instana provides APM with its application hierarchy of services, endpoints, and application perspectives. They discover your application landscape straight from the services being deployed using data collected from traces and component sensors.
Instana helps with monitoring mobile apps by evaluating actual URL request times, which gives users extensive insights into their application experience and visibility into application call pathways. Instana's application monitoring solution works by installing an iOS/Android agent as a dependency on mobile apps.
By measuring actual browser request timings and route loading times, Instana aids website monitoring. It provides extensive access to users' web surfing experiences as well as specific insights regarding application call pathways. The Instana website monitoring system works by embedding a lightweight JavaScript agent into the website being monitored.
Instana ensures that the infrastructure is monitored and represented accurately at all times. All issues and changes observed on the infrastructure are constantly linked to any issues and incidents that occur on the application and end-user level, giving users complete awareness of all components that supply the application.
Instana offers pre-built dashboards to cover typical scenarios and eliminate the need for custom dashboards. It offers a variety of alerting options, as well as an unlimited number of alert channels through which users can be notified.
Pricing starts from $75/month. They also provide a 14-day free trial of the full version of their product.
And It’s a Wrap!!!
Since monitoring your website is so important, a tool like one of the ones listed above can be extremely beneficial. The last thing you want is to wake up one morning and discover your website has gone down without your knowledge. This may lead to a decrease in sales and customers. There are a variety of website monitoring tools to choose from.
We tried to highlight a few sentry alternatives for improving your websites and applications. Hopefully, this has saved you some time, and you may have even uncovered a new one.
Monitor Your Entire Application with Atatus
Atatus is a software observability platform that lets you review problems as if they happened in your application. Instead of guessing why errors happen or asking users for screenshots and log dumps, Atatus provide session replay to quickly understand what went wrong.
We offer Application Performance Monitoring, Real User Monitoring, Serverless Monitoring, Logs Monitoring, Synthetic Monitoring, Uptime Monitoring, and API Analytics. It works perfectly with any application, regardless of framework, and has plugins.

Atatus can be beneficial to your business, which provides a comprehensive view of your application, including how it works, where performance bottlenecks exist, which users are most impacted, and which errors break your code for your frontend, backend, and infrastructure.
If you are not yet an Atatus customer, you can sign up for a 14-day free trial.
#1 Solution for Logs, Traces & Metrics
![]() APM
APM
![]() Kubernetes
Kubernetes
![]() Logs
Logs
![]() Synthetics
Synthetics
![]() RUM
RUM
![]() Serverless
Serverless
![]() Security
Security
![]() More
More