Stackify Retrace Alternatives in 2026
If you've been running Stackify Retrace for a few years, you already know its strengths: code-level APM, centralized logging, and error tracking that plugs in fast for .NET and Java shops without a big learning curve. That's exactly why so many small and mid-sized engineering teams adopted it in the first place.
But two things have changed the calculus in 2026. First, observability expectations have moved on. Teams now expect Real User Monitoring, Kubernetes-native dashboards, synthetic checks, and OpenTelemetry compatibility bundled into one platform, not bolted on as a separate purchase. Second, and more urgently, Stackify Retrace has an announced End of Life date. That turns "should we look around" into "we need a plan," even if the deadline is still a while off.
This guide walks through what Retrace still does well, what the EOL actually means for your data and your timeline, what it really costs versus its rate card, what existing customers say about it, and how these strongest alternatives stack up, including where Atatus fits for teams that want a direct, full-stack replacement without a multi-tool sprawl.
Who uses Stackify Retrace?
Retrace's customer base skews toward teams that value simplicity over breadth. In practice, that shows up across a few recurring industries:
- SaaS companies running .NET or Java backends who want APM and logs in one place without a dedicated observability team
- Healthcare software vendors that need error tracking and audit-friendly logging without an enterprise-scale contract
- Financial services teams running legacy .NET applications where migrating the monitoring agent is lower-risk than migrating the app itself
- Ecommerce platforms that need fast bug detection during peak traffic windows but don't need full RUM or session replay
- Enterprise software teams maintaining older internal tools that were instrumented years ago and never revisited
Company-size fit is squarely small business to lower mid-market. G2 places the bulk of Stackify APM's reviewer base in the mid-market segment, and its pricing tiers (built around server counts in the single digits to low dozens) reflect that, it was never really built to compete for large, multi-thousand-host enterprise deals the way Dynatrace or Splunk Observability are.
Migrating off Stackify before the 2027 deadline?
Step-by-step Retrace migration with zero monitoring gaps
What drives Stackify costs?
- Telemetry volume - logs and traces are the two hardest caps in the current tier structure
- Number of applications and microservices instrumented
- Retention length required for compliance or postmortems
- Number of hosts/servers reporting data
- Custom dashboards and users, though Retrace historically hasn't charged heavily per-seat the way some competitors do
- Support tier and any compliance requirements that push you toward Enterprise
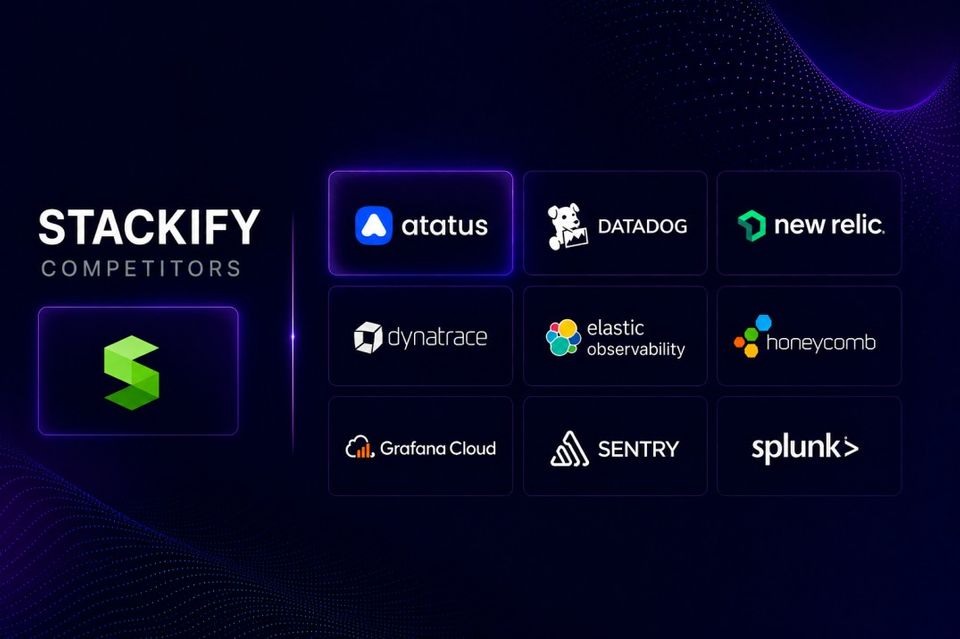
Top Stackify competitors
Below are 9 platforms worth shortlisting, in the order most buyers evaluate them. Every pricing figure is either sourced from the vendor's public pricing page or clearly marked as an estimate.
#1 Atatus
Atatus is a full-stack observability platform covering APM, logs, infrastructure, Kubernetes, RUM, synthetic monitoring, and session replay under one pricing model, without charging per user seat.
Best for: teams that want a direct Retrace replacement plus RUM, synthetics, and Kubernetes
Key features: code-level APM, distributed tracing, log management, native Kubernetes dashboards, OpenTelemetry support, RUM, synthetic monitoring, session replay, error tracking
Pricing: Modular pricing per capability, no per-user fees, 14-day free trial, no credit card required
Ideal company size: startups through mid-market; growing SaaS teams migrating off Retrace
Why teams switch: to get RUM, Kubernetes visibility, and OpenTelemetry support in the same tool they already use for APM and logs, instead of adding separate products usually at a lower blended per-host cost.
When to choose it: if you want the closest experience to Retrace's simplicity, but with modern full-stack coverage, published pricing, and a lower cost per host than most of the platforms it competes with.
Pros
- Full-stack coverage in one product instead of stitching APM + RUM + logs from different vendors
- No per-user pricing - collaboration doesn't cost extra, unlike New Relic ($349/user/mo on Pro) or Dynatrace's mandatory support minimums
- Native OpenTelemetry support, avoiding another proprietary-agent lock-in
- G2 rates Atatus 4.7/5, with particularly strong marks for ease of setup and support quality
- Published, per-host pricing with an annual discount - no need for a sales call just to see a number
Cons
- Smaller ecosystem/integration catalog than Dynatrace
Looking for a Stackify alternative?
Most Stackify customers are up and running with Atatus in under a day. No OpenTelemetry re-work required.
#2 Datadog
Datadog is the largest general-purpose observability platform on the market, covering infrastructure, APM, logs, RUM, synthetics, security, and dozens of adjacent products.
Best for: teams that want the broadest single-vendor tool catalog and don't mind managing many pricing meters
Pricing: Infrastructure from $15/host/mo (annual); APM from $31/host/mo; Logs ~$0.10/GB ingested + indexing fees - each product billed separately
Ideal company size: mid-market to large enterprise with budget for a dedicated FinOps process around observability spend
Why teams switch away: unpredictable, compounding bills once multiple products (APM + logs + RUM) are stacked on the same hosts.
When to choose it: if breadth of integrations and a single "one platform for everything" vendor matter more than pricing predictability.
Pros
- Enormous integration catalog (600+) and mature dashboards
- Strong out-of-the-box service maps and correlation across products
- Widely adopted, so hiring and community support are easy
Cons
- Pricing is modular across many independent meters (host, APM host, logs, custom metrics) that compound quickly
- Host counts are billed on a high-water-mark basis, so autoscaling spikes can inflate a month's bill
- Widely reported "bill shock" once log volume or custom metrics grow
#3 New Relic
New Relic unifies telemetry through its Telemetry Data Platform and NRQL query language, with a genuinely useful perpetual free tier.
Pricing: Free (100GB/mo, 1 user); Standard from $10 first user + $99/additional user; Pro at $349/user/mo (annual) + $0.40–$0.60/GB overage; Enterprise: Contact Sales
Ideal company size: small teams that fit inside the free tier, or mid-market teams comfortable managing per-user costs deliberately
Why teams switch away: per-user seat costs scale awkwardly once more than a handful of engineers need full platform access.
When to choose it: if your data volume is modest and your team is small enough that user-seat costs stay controlled.
Pros
- Free tier includes 100 GB/month ingest and one full platform user - real production use is possible for free at small scale
- Single ingest meter (rather than Datadog's per-product meters) is simpler to reason about
- Applied Intelligence AIOps reduces alert noise via correlation
Cons
- Full-platform user seats get expensive fast - $349/user/month (annual) on Pro, uncapped
- Data ingest charges apply to everything (metrics, logs, traces, events) on the same meter, so log-heavy teams burn through the free tier quickly
- Enterprise pricing requires a custom quote
#4 Dynatrace
Dynatrace uses its Davis AI engine to auto-discover topology and correlate incidents across the full stack, with OneAgent providing broad automatic instrumentation.
Best for: large enterprises wanting AI-driven root-cause analysis across hybrid/multi-cloud
Pricing: Full-Stack Monitoring ~$69/mo per 8GB host (list); consumption-based DPS model with per-GiB-hour host billing, ~$0.20/GiB logs; Enterprise: Contact Sales
Ideal company size: large enterprise with complex, multi-cloud, high-compliance environments
Why teams switch away: the DPS consumption model and mandatory support minimums make budgeting hard for anything smaller than enterprise scale.
When to choose it: if you need automated root-cause AI across a genuinely large, complex hybrid-cloud estate and have the budget to match.
Pros
- Strong automatic dependency mapping and causal AI analysis (Davis)
- No per-user fees - unlimited users included
- Deep support for hybrid, multi-cloud, and Kubernetes environments
Cons
- Consumption-based DPS pricing (host-memory GiB-hours, log GiB, RUM sessions) is genuinely complex to forecast
- Enterprise Success & Support carries a $25,000 minimum annual commitment
- Considered complex to configure relative to lighter-weight tools
#5 Elastic Observability
Elastic Observability builds APM, logs, infrastructure, and synthetic monitoring on top of the Elastic Stack, offered as Hosted, Serverless, or fully self-managed.
Best for: teams already invested in Elasticsearch/Kibana who want high log volume at a lower per-GB rate
Pricing: Serverless Observability from ~$0.07–$0.11/GB ingested + ~$0.017–$0.019/GB/month retained; Hosted tiers from ~$95–$184/month baseline (scales with provisioned resources)
Ideal company size: teams with existing Elastic Stack expertise, from mid-market to large enterprise
Why teams switch away: operational overhead of self-managed clusters, or surprise from uncompressed-ingest billing.
When to choose it: if you have high log volume and either existing Elastic expertise or willingness to manage index lifecycle for the cost savings.
Pros
- Among the cheapest credible options for high-volume log ingestion on a per-GB basis
- Flexible deployment: self-managed, hosted, or serverless
- Strong native Kibana search and visualization for log-heavy workflows
Cons
- Self-managed deployments carry real operational overhead (cluster sizing, index lifecycle management)
- Billing is based on uncompressed ingest size, which can make bills higher than expected relative to raw source data
- Support pricing is a percentage-of-consumption add-on, which compounds with usage
#6 Honeycomb
Honeycomb specializes in high-cardinality event analysis and distributed tracing, priced by event volume rather than hosts or seats.
Best for: teams debugging high-cardinality distributed systems with a query-first workflow
Pricing: Free up to 20M events/month; Pro from ~$130/100M events, scaling to 1.5B events/month; Enterprise: Contact Sales
Ideal company size: engineering-heavy startups through mid-market teams running complex distributed systems
Why teams switch away: the lack of a native metrics/infrastructure layer means Honeycomb often becomes one tool in a stack rather than a full Retrace replacement.
When to choose it: if distributed tracing and high-cardinality querying is your primary pain point, and you're comfortable pairing it with another tool for infra metrics.
Pros
- Generous free tier - 20 million events/month with 60-day retention
- Excellent for high-cardinality debugging that traditional metrics tools handle poorly
- Unlimited seats and querying even on paid tiers, per its published pricing page
Cons
- No dedicated infrastructure-metrics layer - teams often still need a complementary tool for system-level metrics
- Costs can escalate quickly at very high event volumes without sampling discipline
- Smaller integration ecosystem than incumbents like Datadog
#7 Grafana Cloud
Grafana Cloud is the managed version of the open-source Grafana stack (Mimir, Loki, Tempo, Pyroscope), with usage-based pricing across metrics, logs, traces, and profiles.
Best for: teams already using Prometheus/OpenTelemetry who want a managed backend without losing OSS portability
Pricing: Free tier ($0); Pro from $19/month platform fee + ~$6.50/1,000 metric series, ~$0.45/GB logs/traces, $8/active user; Advanced from ~$55/month; Enterprise: custom, $25,000/year commitment minimum
Ideal company size: startups through mid-market teams already running Prometheus/Kubernetes
Why teams switch away: multi-meter billing can become as unpredictable as Datadog's if cardinality isn't actively managed.
When to choose it: if you're OpenTelemetry/Prometheus-native already and want a managed backend without abandoning the open-source ecosystem.
Pros
- Arguably the most generous free tier in the category - 10,000 metric series plus 50GB each of logs, traces, and profiles
- Full OpenTelemetry and Prometheus-native support
- Open-source foundation means self-hosting remains an option, reducing lock-in risk
Cons
- Multiple independent meters (series, GB, host-hours, users) similar in spirit to Datadog's complexity
- Cardinality explosions can push costs from a few hundred dollars to five figures on the same host footprint
- Kubernetes/Application Observability billed separately by host-hours on top of telemetry charges
#8 Sentry
Sentry is the developer-favorite for exception tracking, with tracing, session replay, and uptime monitoring layered on top of its original crash-reporting core.
Best for: teams whose primary pain point is error tracking and session replay, not full APM/infra
Pricing: Developer: free (5K errors/mo, 1 user); Team ~$26/month (50K errors); Business ~$80/month (50K–100K errors + advanced features); Enterprise: Contact Sales
Ideal company size: solo developers through mid-market teams; often paired with an infra/APM tool rather than used alone
Why teams switch away: Sentry alone doesn't cover infrastructure or logs, so teams outgrowing it usually add (or replace it with) a full-stack platform.
When to choose it: if error tracking and session replay are your core need and you're comfortable pairing it with a separate infra/logs tool.
Pros
- Free Developer tier (5,000 errors/month) is genuinely usable for small projects
- Flat-rate paid tiers (Team, Business) are simple and predictable versus per-host models
- Excellent SDK coverage across 30+ languages and frameworks
Cons
- No infrastructure or server monitoring layer - this is an error/performance tool, not a full Retrace replacement on its own
- Event-based overage pricing can spike sharply during a bad deploy that throws errors in bulk
- Advanced features (SSO, SAML, anomaly detection) are gated behind the Business tier
#9 Splunk
Best for: enterprises that already run Splunk for security/SIEM and want observability under the same vendor
Splunk Observability Cloud (built on the former SignalFx) delivers infrastructure monitoring, APM, RUM, and synthetics with real-time analytics across full-fidelity trace data.
Pricing: Infrastructure from $15/host/mo; App+Infra bundle ~$60/host/mo; End-to-End bundle ~$75/host/mo; Database Monitoring and Secure Application billed separately; Enterprise: Contact Sales
Ideal company size: large enterprise, especially existing Splunk security customers
Why teams switch away: cost stacks quickly once Database Monitoring, RUM, and Secure Application are added to the base bundle.
When to choose it: if you're already a Splunk security customer and want observability under one vendor relationship.
Pros
- NoSample full-fidelity trace ingestion - no sampling blind spots during investigations
- Strong synergy for organizations already using Splunk for SIEM/security
- OpenTelemetry ingestion supported natively
Cons
- Host-based bundle pricing (Infra / App+Infra / End-to-End) still stacks with separately-billed Database Monitoring and Secure Application modules
- List pricing sits meaningfully above Datadog/Dynatrace at comparable host counts per several independent cost breakdowns
- Best value typically requires bundling with Splunk's broader security/SIEM contracts
Which alternative should you choose?
- Startups: Grafana Cloud, Sentry, or Honeycomb's free tiers cover light workloads at zero cost.
- Growing SaaS teams: Atatus or New Relic - full-stack coverage without enterprise-scale complexity. Atatus's $49/host APM starting price bundles logs and tracing that New Relic and Datadog bill separately.
- Large enterprise: Dynatrace, or Splunk Observability, if budget and existing vendor relationships support it.
- .NET teams specifically: Atatus and AppDynamics both have strong .NET support; Atatus is the closer match to Retrace's original developer-first workflow.
- Cloud-native / Kubernetes: Atatus, Datadog, or Grafana Cloud all offer native Kubernetes dashboards.
- OpenTelemetry-first: Grafana Cloud, Honeycomb, or Atatus built around OTel rather than bolting it on.
- Budget-conscious teams: Grafana Cloud's free tier or Sentry's flat-rate Team plan are the most predictable starting points.
Buyer checklist before replacing Stackify
- Does it support OpenTelemetry natively, or does it require a proprietary agent?
- Can pricing scale predictably as host count or data volume grows — or does it compound across multiple meters?
- How quickly can developers onboard without a dedicated observability specialist?
- How complex is migration - does the vendor offer parallel-run support or migration tooling?
- How much historical data can realistically be retained, and at what cost?
- Is Real User Monitoring included, or is it a separate purchase?
- Does it support Kubernetes with native dashboards, or only basic container visibility?
- How configurable and noise-resistant is the alerting system?
- Are there per-user seat charges that will scale badly as the team grows?
- What's the actual support SLA, and is premium support a hidden minimum spend?
Conclusion
Stackify Retrace earned its loyal user base by being simple and affordable at a time when full-stack observability meant assembling five separate tools. That's less true today modern platforms bundle APM, logs, RUM, and Kubernetes visibility by default, and Retrace's announced End of Life means the "wait and see" option is closing anyway.
Retrace still makes sense for teams that need continuity through the support window and aren't ready to migrate yet but it's not a sound choice for a net-new purchase in 2026.
Among the alternatives, Atatus stands out for teams that want Retrace's original simplicity including fast setup, code-level APM, log correlation extended into RUM, synthetics, session replay, and Kubernetes monitoring, without adding per-user costs or a second vendor contract. At $49/host/month for APM (annual billing), it starts lower than Dynatrace's Full-Stack tier and Splunk Observability's App+Infra bundle, while folding in logs, tracing, and database monitoring that Datadog and New Relic charge for separately. If OpenTelemetry portability and a lower, predictable per-host cost matter to your team, it's worth putting at the top of your shortlist.
Start Your 14-Day Free Trial of Atatus
Experience application performance monitoring, logs, distributed tracing, infrastructure monitoring, and OpenTelemetry support in one unified observability platform. No credit card required.
Frequently Asked Questions
When does Stackify Retrace reach end of life?
March 31, 2027 confirmed in BMC Helix's official Stackify Retrace End of Life customer letter.
Can I still use Stackify Retrace until then?
Yes. Retrace stays operational in maintenance mode, receiving critical fixes only; no new features will ship.
What happens to my data after Stackify Retrace's EOL?
Customers are responsible for exporting any data they want to retain before the cutoff date. After March 31, 2027, access to the Retrace SaaS platform and stored telemetry ends.
Does BMC recommend a specific migration path?
BMC points customers toward Helix AIOps, built on OpenTelemetry. Since OpenTelemetry is a vendor-neutral standard, teams can choose any OTel-compatible backend rather than being limited to one option.
Is Atatus compatible with OpenTelemetry?
Yes. Atatus supports OpenTelemetry, so your instrumentation stays portable rather than locked to a proprietary agent.
What should I look for in a Stackify replacement?
Full-stack coverage across APM, logs, distributed tracing, Real User Monitoring, infrastructure and Kubernetes monitoring, native OpenTelemetry support, and transparent pricing.
#1 Solution for Logs, Traces & Metrics
 APM
APM
Kubernetes
Logs
Synthetics
RUM
Serverless
Security
More