Log Management Made Easy: Top 10 Logs Monitoring Solutions
In contemporary enterprise operations, log management tools have become indispensable for optimizing performance. Among these tools, selecting one with a proficient logs user interface (UI) holds paramount importance. A quality log management tool not only gathers logs but also presents them in a well-organized manner, facilitating easy interpretation for the user.
In this context, we need a logs UI to act as an intermediary between the log management application and a user, facilitating interaction about the logs collected from various sources such as system logs, application logs, network logs, and so on. If the log management tool provides unstructured or vague logs to the user, it's challenging to interpret the logs.
Therefore, a customized graphical user interface is required for system administrators, developers and IT operations personnel to search logs, filter only necessary logs, troubleshoot issues and optimize performance. Learn more about the Logs UI and its features as well as the best log UIs for better log management and more in this blog.
Table Of Contents:
- What is Logs Monitoring?
- What is Logs UI?
- Essentials for the Best Logs UI
- Top 10 Log Monitoring Solutions
What is Logs Monitoring?
Monitoring logs stands as an essential component in overseeing contemporary IT infrastructures. This process entails consistently observing and analyzing logs originating from a variety of systems, applications, servers, or devices.
These logs function as repositories documenting events and actions, encapsulating valuable data including errors, warnings, user interactions, security incidents, and performance indicators.
Through log monitoring, organizations can identify issues, troubleshoot challenges, ensure adherence to regulatory requirements, bolster security measures, optimize system performance, and undertake forensic analysis as necessary.
Log monitoring tools offer functionalities like real-time log aggregation, robust search capabilities, alerting mechanisms, visualization dashboards, and seamless integration with other monitoring systems.
Collectively, log monitoring assumes a critical role in upholding operational efficiency, security protocols, and regulatory compliance within modern IT landscapes.
What is Logs UI?
The term "Logs UI" refers to a user interface (UI) developed for viewing and manipulating log files. Logs are records of events or actions generated by applications, operating systems, or other software components.
They are used in software development, system administration, and IT management. These logs are useful for troubleshooting, monitoring, and analysing the behaviour of a system. A Logs UI gives you a graphical representation and an easy way to interact with log data.
Why Should we use Logs UI?
- Look for noteworthy or intriguing trends in your logs.
- Look at the further context surrounding a specific log line.
- Using filters and parsing rules, you can explore and edit your log data.
- Query your data to generate custom visualisations, or add these to dashboards.
- Structure your organization's log data and enhance query performance by implementing data partitions.
- Create alert conditions for issues you wish to avoid.
Essentials for Best Logs UI
The ideal Logs user interface avoids extremes of plain text or overbearing decorations in favour of simplicity and sophistication. It should be simple to use and navigate. The qualities of an approachable Logs UI are outlined in the parts that follow:
- The Log Display Area: The primary user interface area where log entries are shown. Generally, logs are shown in a time-ordered manner so that users can monitor events in chronological order.
- Search and Filter Options: Users can locate certain logs using search functionality by using keywords, phrases, or patterns. Users can apply filters to limit log entries according to parameters like severity level, time, or individual components.
- Colour-coded Severity Levels: Logs frequently include severity ratings (INFO, WARNING, ERROR, etc.). Colour-coded indications are used by a decent Logs UI to help users rapidly determine the severity of each log item.
- Timestamps: Every log entry has a timestamp to show the exact moment the incident happened. This is necessary to analyse the timeline and comprehend the order of occurrences.
- Structured Log Data: Structured data, such as key-value pairs or JSON format, can be found in logs. This data can be analysed and presented in the UI in a more legible and organised manner.
- Real-time Updates: The Logs UI may occasionally allow for real-time updates, guaranteeing that users view the most recent log entries as soon as they happen.
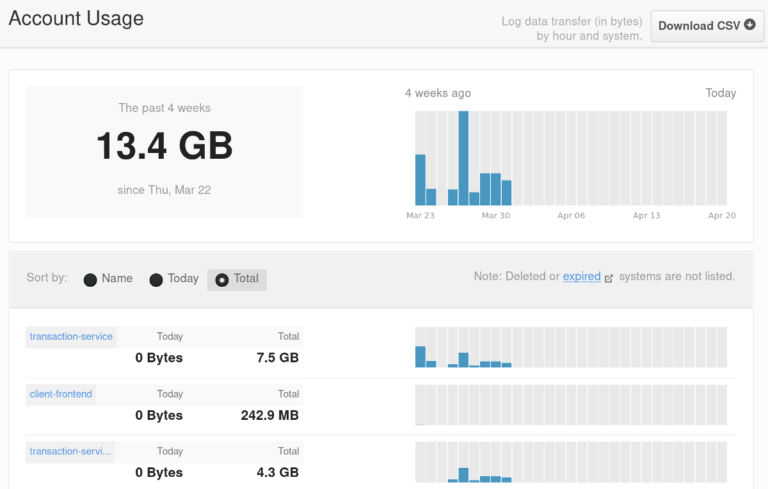
- Export and Download Options: Logs can frequently be exported by users for additional examination or shared with other team members. This may offer options to download logs in a certain format (CSV, JSON, etc.).
- Integration with Monitoring Tools: Log UIs are frequently integrated into broader monitoring and observability platforms, combining metrics, traces, and other monitoring tools to provide a holistic view of system health.
- User Permissions and Access Control: Access to log data can be restricted based on user roles and permissions. A Logs UI should include functionality for managing user access securely.
Top 10 Log Monitoring Solutions:
The top Logs Monitoring tools preferred mostly by the software community are:
1. Atatus
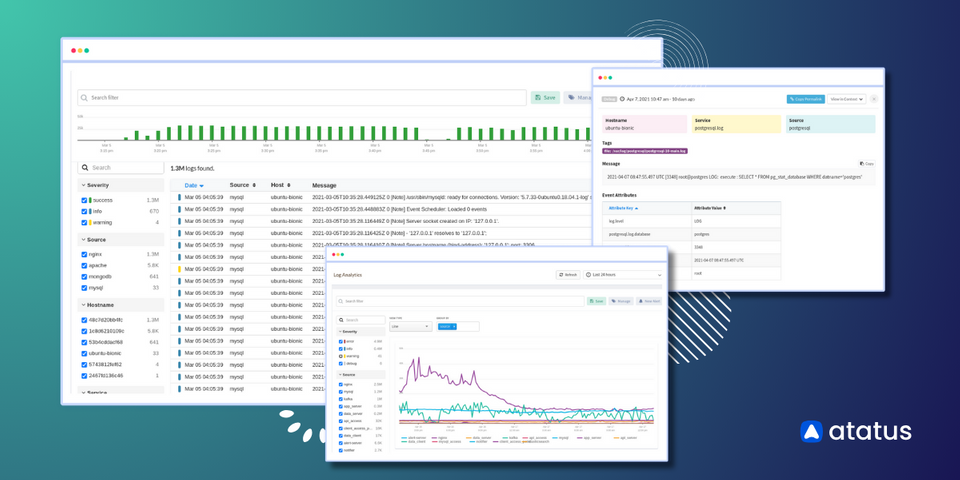
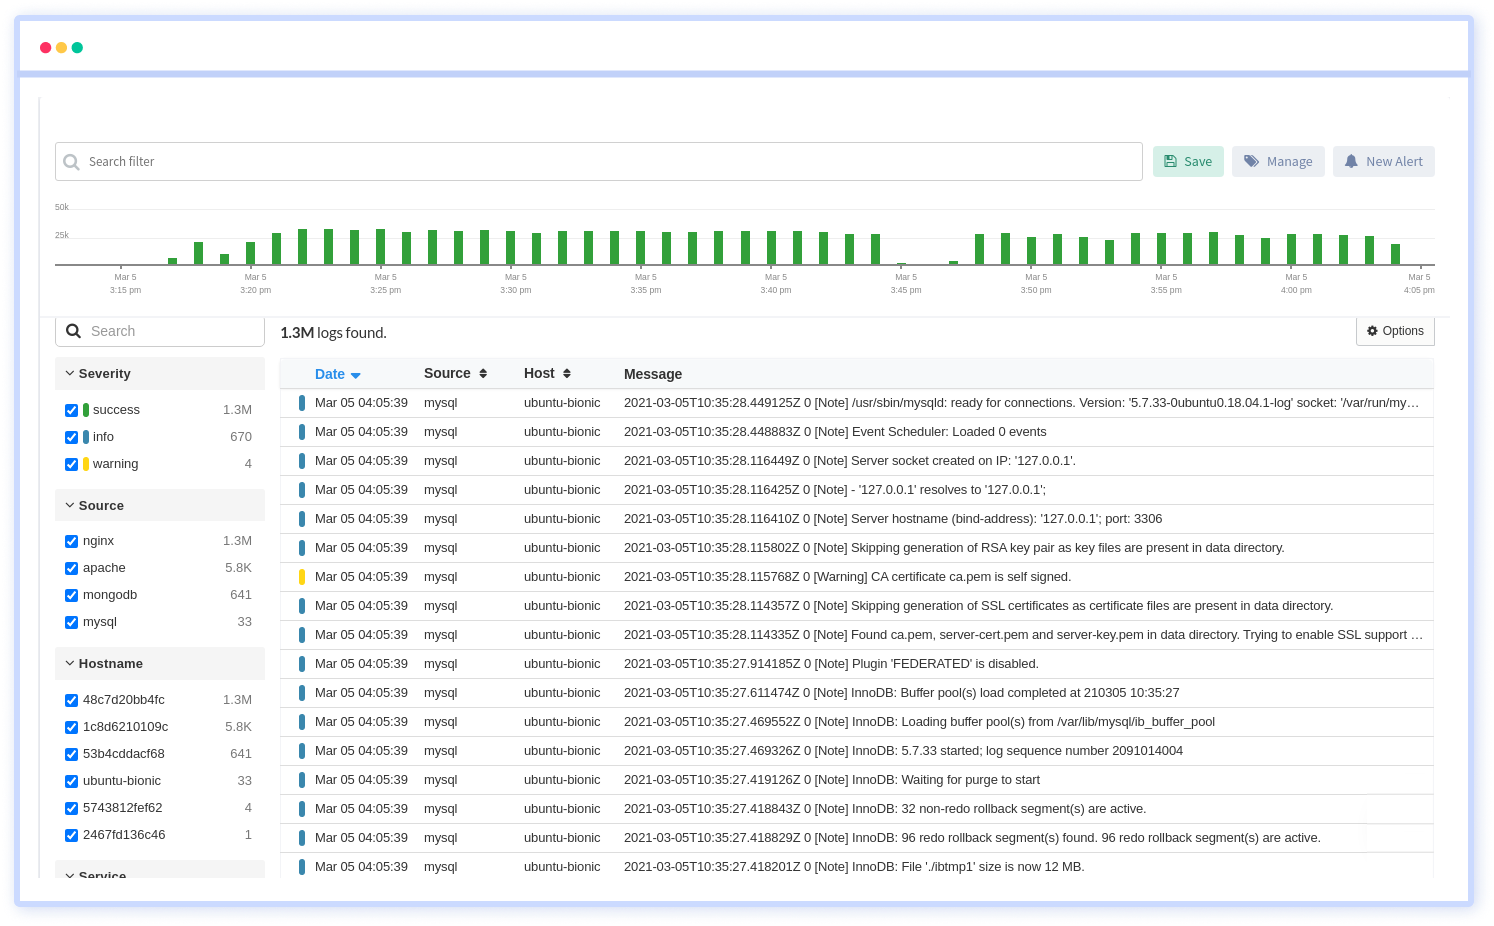
Atatus is a comprehensive application performance monitoring (APM) platform that also offers logs monitoring capabilities. It allows you to track and analyze logs in real-time, enabling you to identify and troubleshoot issues quickly.
Atatus provides features such as log aggregation, search, and visualization to help you gain insights into your application's behavior and performance.
Features
- Allows users to centralize log data from diverse sources such as applications, servers, containers, and cloud services
- Enables real-time log streaming, ensuring that log data is continuously collected and processed as it is generated.
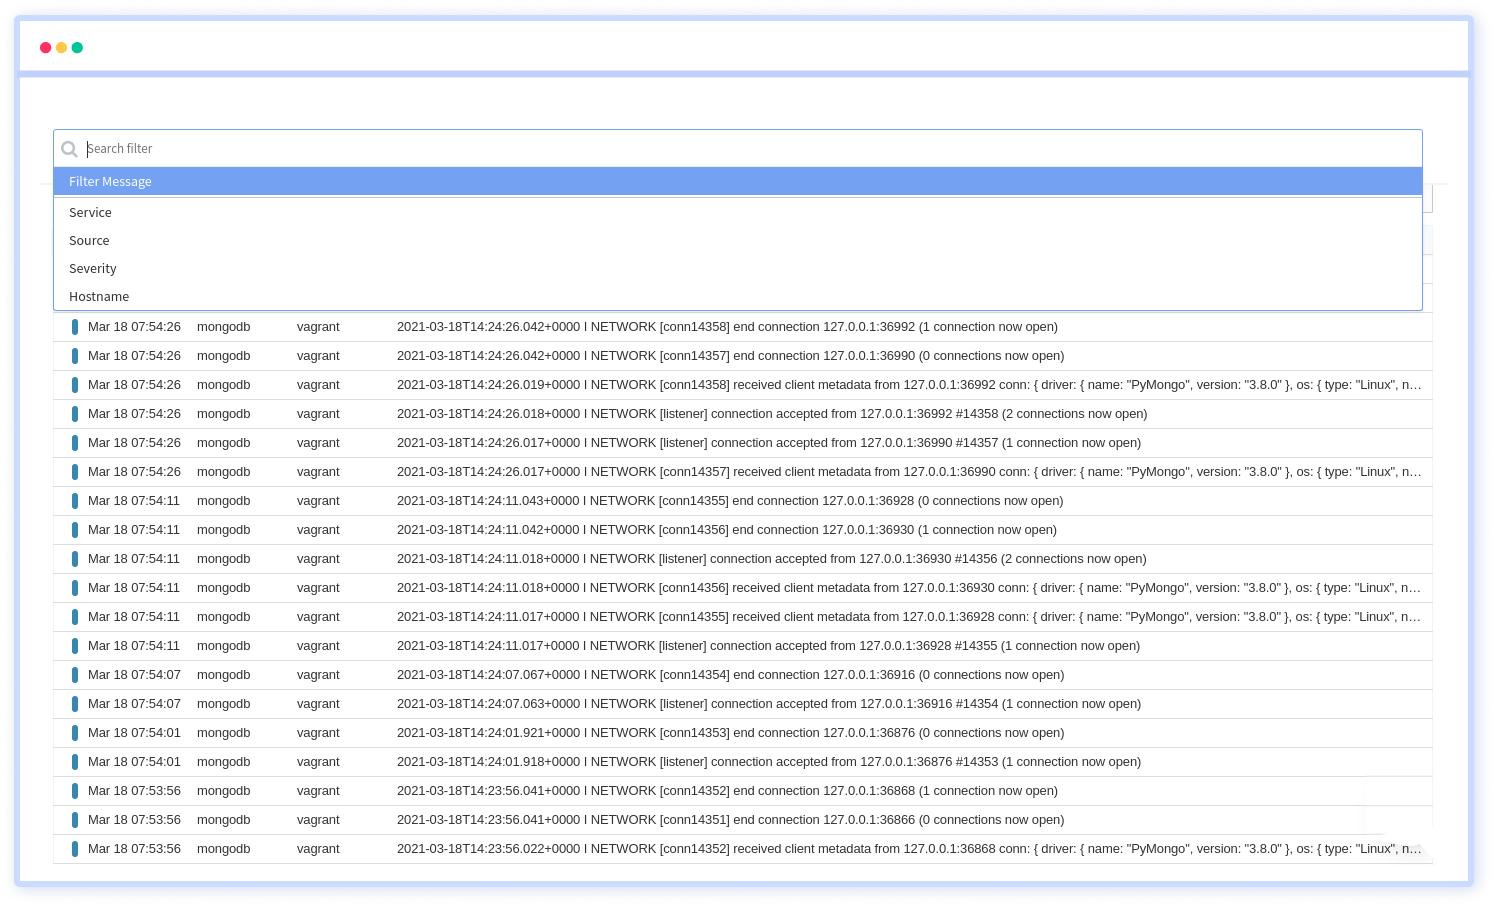
- Provides powerful search and filtering capabilities, allowing users to quickly find relevant log data using keywords, tags, or custom filters.
- Offers customizable parsing capabilities, allowing users to define parsing rules and extract structured data from log messages.
- Users can define alerting rules based on log content, patterns, or thresholds, ensuring timely detection and response to critical issues.
Pros
- Easy-to-use UI for effortless navigation
- Simple to get up and get going—they provide a free 14-day trial without requiring a credit card!
- Personalised changes and alerts
- Designed to expand as the application does
- It is ideal for keeping an eye on small and large companies alike.
- Effectively supports third-party integrations
- Ideal costs and a reduced learning curve
- Frequent updates regarding new features
2. Kibana(ELK Stack)
Kibana, which is a component of the ELK Stack (Elasticsearch, Logstash, Kibana), is renowned for its potent data visualisation features. It provides an intuitive user interface to explore, visualize, and analyze data stored in Elasticsearch indices, including log data.
With Kibana, you can create various visualizations, dashboards, and perform advanced analytics on log data, making it easier to monitor and troubleshoot your systems.
Features
- Create customizable dashboards for real-time monitoring and visualization of log data.
- Easily navigate and analyze log data with intuitive exploration tools.
- Generate various visual representations of log data for better insights.
- Perform advanced queries to filter and search through log data efficiently.
- Save frequently used search queries for quick access and reuse.
- Leverage machine learning algorithms for anomaly detection and trend analysis.
- Utilize time series data visualization and analysis capabilities.
- Ensure log data security through access controls, authentication, and encryption.
- Set up alerts based on predefined conditions to notify about important log events.
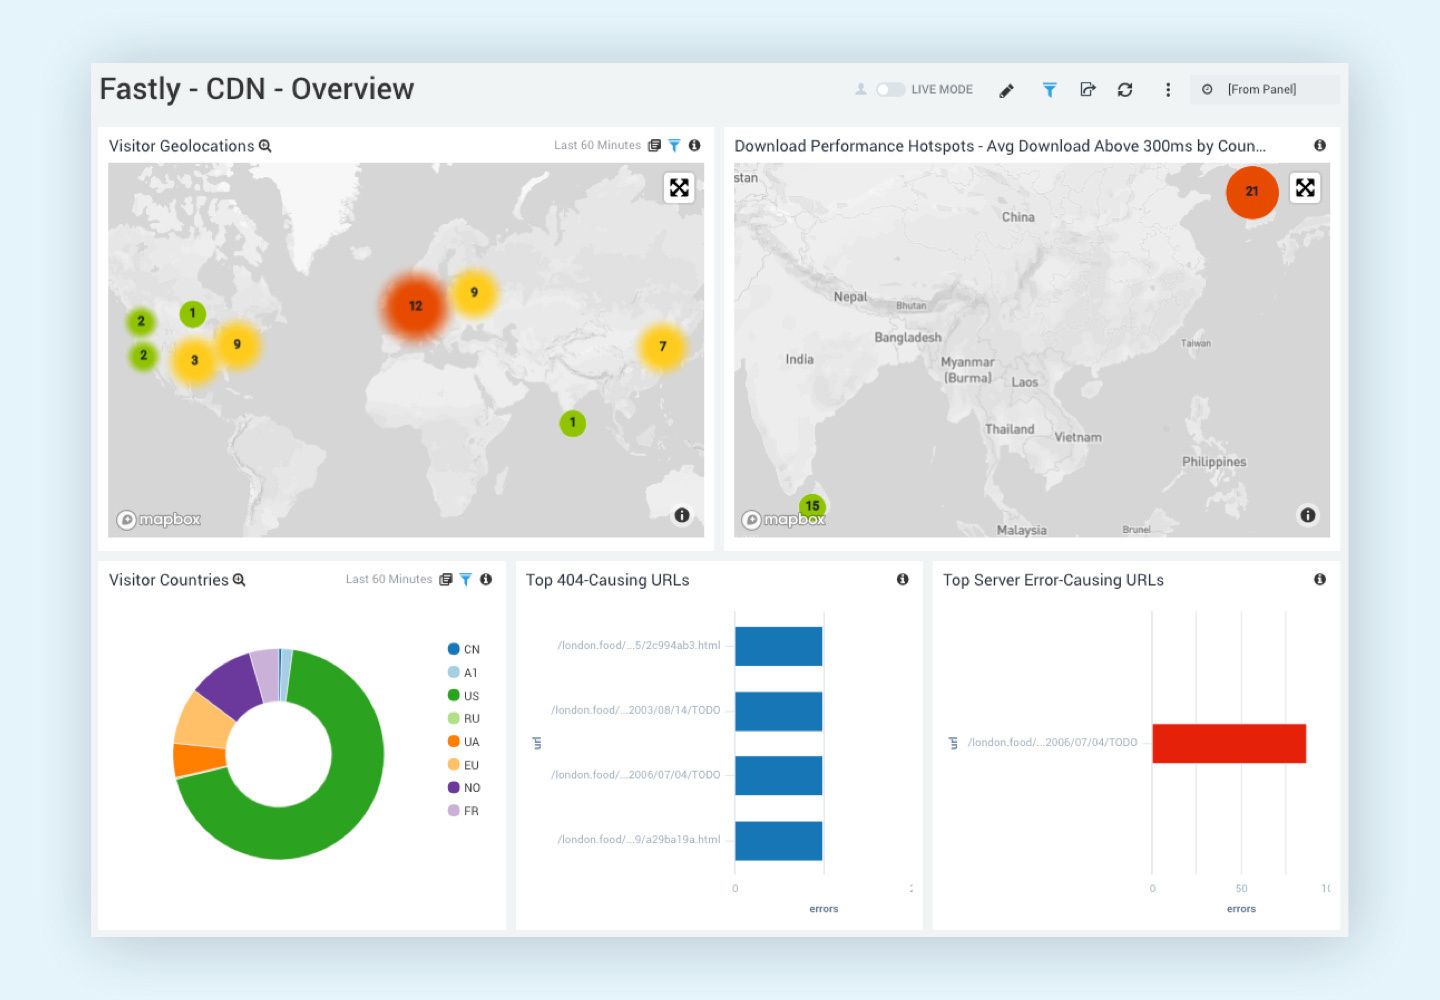
- Visualize log data on maps to analyze geospatial patterns and trends.
Pros
- Easy for all users
- Powerful charts and graphs
- Works seamlessly with Elasticsearch
- Open-source and free-to-use
- Create tailored dashboards
- Set up alerts and actively monitor data
- Supported by a helpful community
Cons
- Takes time for beginners
- Can be resource-intensive
- Effectiveness tied to Elasticsearch
- Works best with Elasticsearch
- Requires extra security measures
- Creating complex visualisations may be challenging
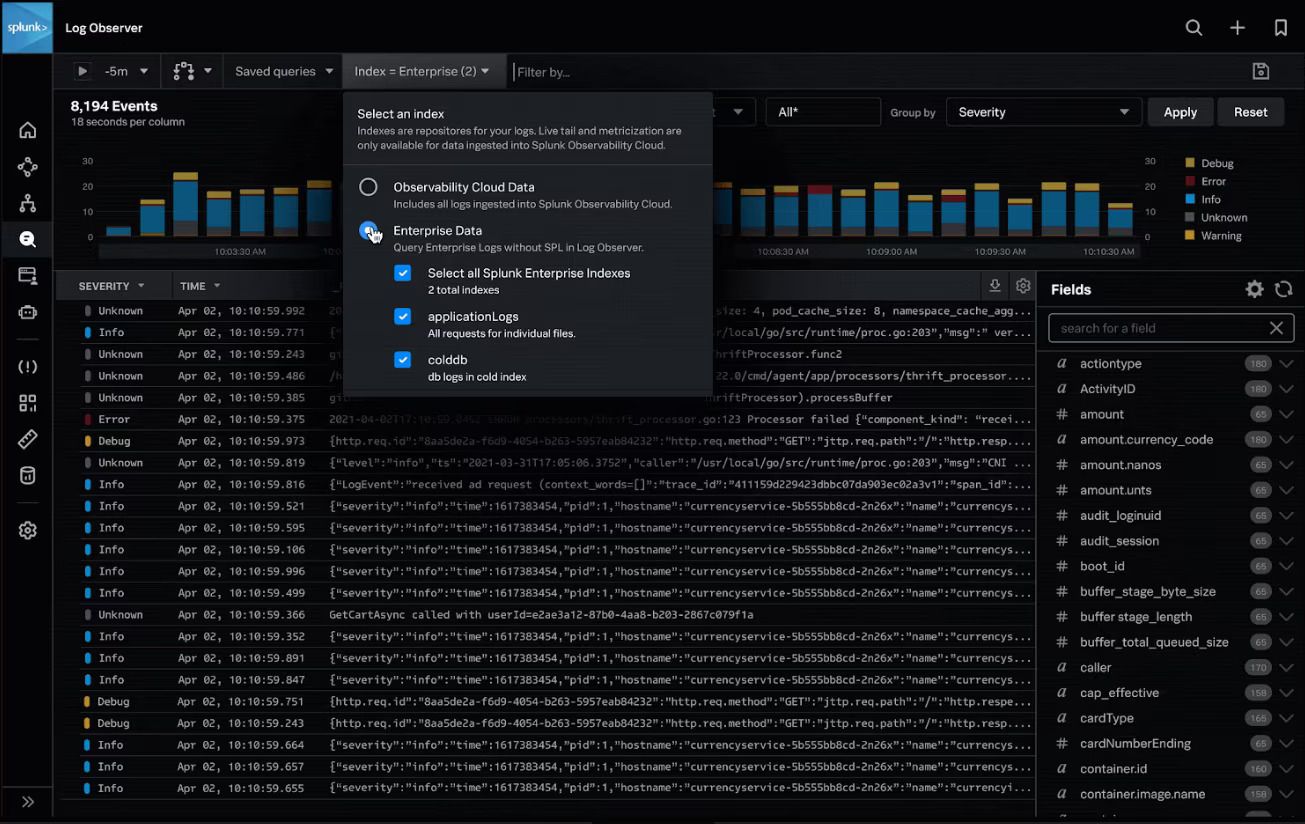
3. Splunk
Splunk is a well-known log management and analysis application that offers a full platform for monitoring, searching, and analysing data produced by machines, including logs. It provides an interface that is easy to customise and use.
Features
- Log management
- Search and Analytics
- Machine data analysis
- SIEM (security information and event management)
- IT Operations Monitoring
Pros
- Analytics enabled by machine learning and artificial intelligence
- Horizontally scalable
- On-premises or cloud-based deployment
- Works with unstructured data from diverse sources
Cons
- Stay current with Language for Splunk Processing
- Antiquated user interface
- Smaller-scale goods and features
4. Graylog
Graylog is an open-source log management programme that collects and analyses log data. It has a web-based interface for finding, analysing, and visualising log data, making it easy to monitor system activities.
Features
- Log Collection
- Search and Analysis
- Dashboards
- Alerting
- Data Processing Pipelines
- Access Control
- Elasticsearch Integration
- Plugins and Integrations
- Compliance and Auditing
Pros
- Free and customizable
- Manages log data from various sources centrally
- Efficient log data analysis
- Proactive monitoring through alerting
- Scales well with growing log data volumes
- Create and customize visual dashboards
- Define data processing for extraction and transformation
- Efficient storage and retrieval with Elasticsearch
- Secure user access with Role-Based Access Control (RBAC)
- Includes compliance reporting and auditing
Cons
- Beginners may face a learning curve
- Demands significant system resources for larger datasets
- The interface may be less intuitive for some users
- Integrating with certain systems may require additional configuration
5. DataDog
Datadog is a platform for analytics and monitoring that has log management capabilities. It gives users a consolidated platform for logs, traces, and analytics, giving them a thorough understanding of system performance.
Features
- Application Performance Monitoring
- Infrastructure Monitoring
- Log Management
- Synthetic Monitoring
- Real User Monitoring
- Network Performance Monitoring
Pros
- Tailorable dashboards and collaborative functionalities
- Adaptable alerting system
- A comprehensive repository of integrations
- Incorporation of machine learning and anomaly detection
- Ongoing profiler for the examination of code-level errors
Cons
- Costly
- Steep learning curve
- Subpar customer service
- The interface may not suit everyone's preferences
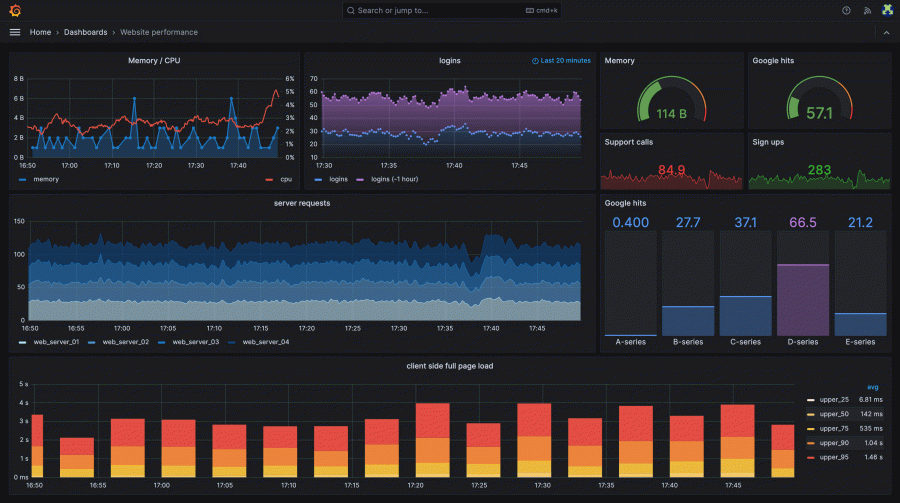
6. Grafana
Grafana, while best renowned for its time-series data visualisation, also supports log data. It offers a configurable and customisable dashboard, which makes it a popular monitoring and analytics tool.
Features
- Graphing and Visualization
- Dashboard Creation
- Data Source Integrations
- Alerting and Notifications
- Plugins and Extensibility
- User Authentication and Authorization
- Templating
- Annotations
- Explore Mode
Pros
- Dynamic and adaptable data visualization
- Various databases and cloud services
- Create and customize dashboards according to their needs
- Strong alerting features
- Active community for continuous development and assistance
- Compatible with different operating systems for broader accessibility
- Explore data without predefined dashboards
- Secure access control with user authentication and role-based permissions
Cons
- Some users may encounter a learning curve, especially with advanced features
- Can demand significant resources, particularly with large datasets
- Initial setup and configuration may be somewhat complex
- More complex data transformations may need to be handled within the data source
- Fine-tuning alert configurations might be intricate
- While open source, commercial support options may involve additional expenses for enterprises
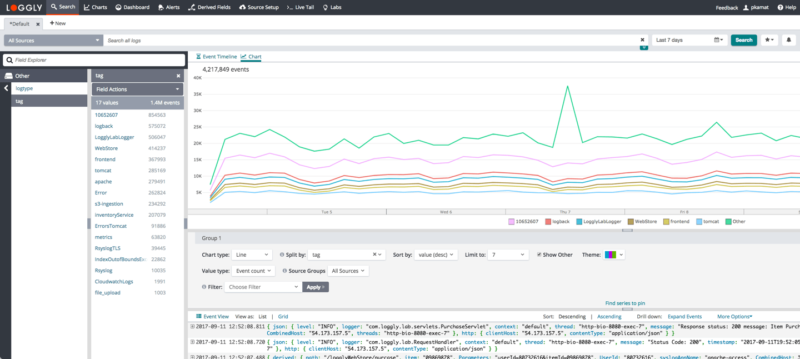
7. Loggly
Loggly is a cloud-based log management and analysis platform that helps organizations monitor, analyze, and troubleshoot their log data effectively. It offers features such as log aggregation, search, and visualization, allowing users to gain insights into application performance and system behavior.
Loggly provides real-time alerts and integrations with other monitoring tools to streamline log management workflows.
Features
- Log Collection
- Real-time Analysis Search and Query
- Dashboards and Visualizations
- Alerting
- Dynamic Field Explorer
- Integration with technologies
- Compliance and Security
- Log Anomaly Detection
- Archiving and Retention
- Live Tail
- Custom Parsing
- Role-Based Access Control (RBAC)
- Collaboration and Sharing
- RESTful API
Pros
- Gathers logs from diverse sources in a single location
- Rapidly identifies issues through real-time analysis
- Quickly retrieves log data with powerful search capabilities
- Customizable dashboards provide insights into log data trends
- Dynamically explores log fields for enhanced comprehension
- Supports compliance requirements and secures log data
- Identifies unusual log patterns using machine learning
- Enables archiving and retention of log data
- Real-time log streaming facilitates immediate monitoring and response
- Offers an API for seamless integration with other tools
Cons
- Costs may escalate, particularly for larger datasets
- Some users may face a learning curve during usage
- Handling substantial log volumes may demand significant resources
- As a cloud-based service, Loggly relies on internet connectivity
- Integrating with specific platforms may involve additional configuration
- Choices for on-premises deployment are restricted
- Fine-tuning alert configurations may pose challenges
8. Papertrail
A cloud-based log management solution noted for its simplicity and convenience of use. It allows users to centralize logs from various sources, making it easier to monitor and troubleshoot systems in real-time.
Papertrail offers features such as keyword search, live tailing, and customizable alerts, enabling organizations to gain visibility into their log data and react quickly to issues.
Features
- SolarWinds Observability
- Application Performance Monitoring
- Log Viewer
- Firewall Log Analyser
- Centralized Log Management
- Log Analysis
- Application Log Management
- Access Log Analyser
- Tail Logging
- Cron Job Monitoring
Pros
- Consolidates logs from diverse sources into one platform
- Facilitates quick and real-time analysis of log events
- Permits setting up alerts based on specific log events or patterns
- Provides real-time streaming of log events for immediate monitoring
- Visualizes log data trends on dashboards that can be tailored
- Archives and retains log data for compliance or historical analysis
- Integrates seamlessly with various cloud services for application flexibility
- Implements secure access control with role-based permissions
- Ensures secure log transmission through encryption
- Provides API access for seamless integration with other tools and automation
- Sends log data to multiple destinations for backup and redundancy
- Permits the saving of specific search queries for efficient log analysis
- Supports log parsing for various formats, enhancing adaptability
Cons
- Costs may escalate
- Users may face a learning curve
- As a cloud-based service, Papertrail relies on internet connectivity
- On-premises deployment choices are restricted
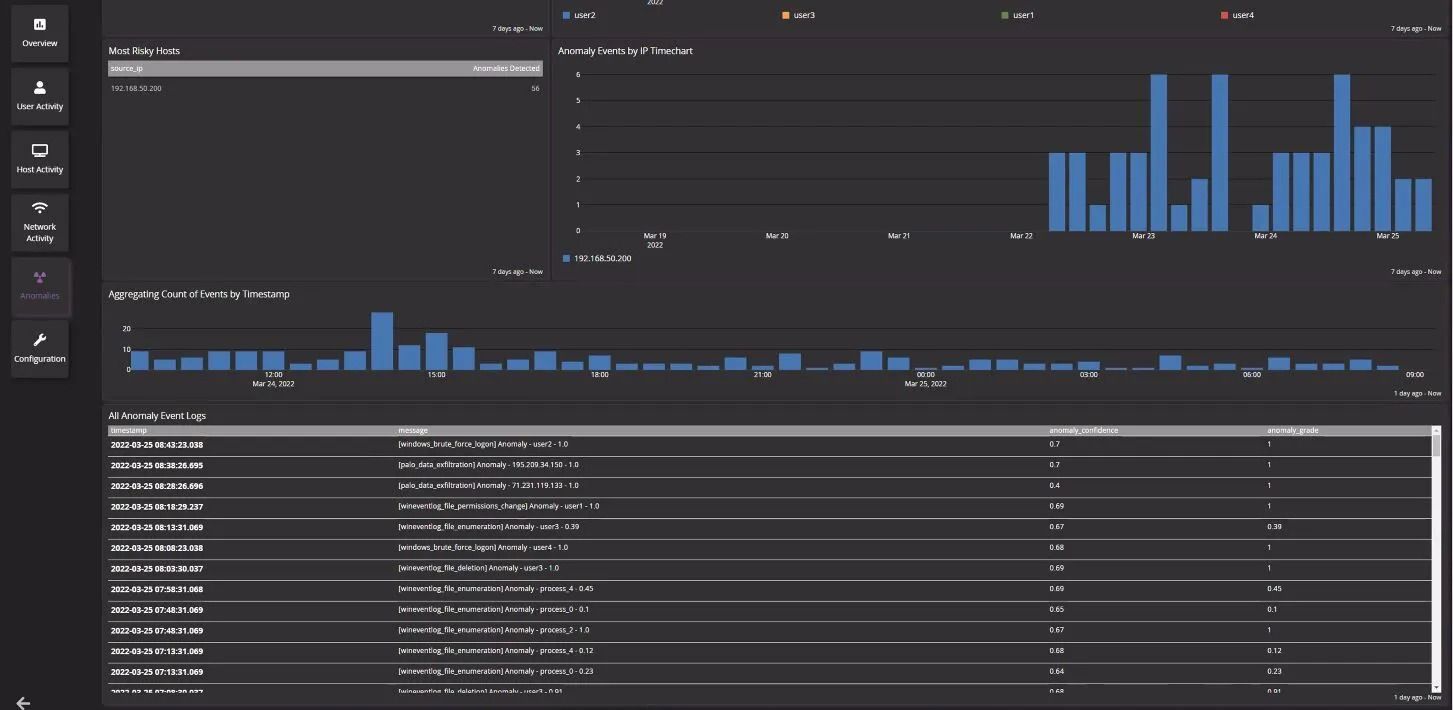
Sumo Logic
SumoLogic is a cloud-native log management and analytics platform that helps organizations gain insights into their log data for monitoring, troubleshooting, and security purposes.
It supports integration with other monitoring tools and provides advanced analytics capabilities for deep insights into system performance and behavior.
Features
- Troubleshooting and Monitoring
- Cloud Infrastructure
- Security
- Compliance and Audit
- Cloud SIEM
- Auto-Discovery for OpenTelemetry Collectors
- Log Message Inspector
- Kubernetes Unified Collection using OpenTelemetry
Pros
- Gathers and organizes logs from diverse sources in one central location
- Swiftly identifies issues and trends through real-time analysis
- Applies machine learning for detecting unusual log patterns and predicting potential issues
- Tailors dashboards for visualizing log data trends to specific needs
- Sends alerts based on specific log events or patterns to ensure timely response
- Designed to handle increasing log data volumes as your organization grows
- Easily integrates with various cloud services and tools for seamless operations
- Incorporates security features and supports compliance requirements
- Maintains logs for compliance adherence and historical analysis
Cons
- Costs can become significant, especially for larger organizations
- Managing large log volumes may require substantial system resources
- Requires internet connectivity as a cloud-based solution
- Query language complexity may be a hurdle, especially for beginners
- Integrating with specific platforms may involve additional configuration steps
- Options for on-premises deployment are limited
New Relic Logs
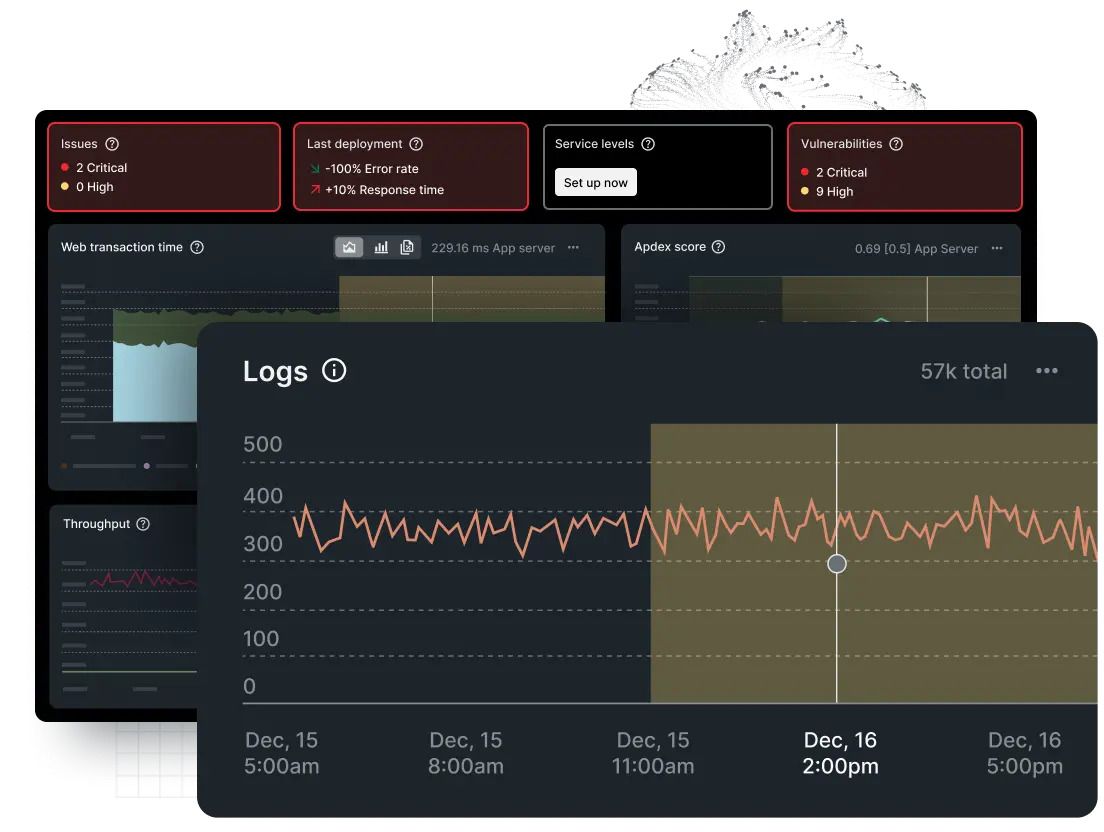
New Relic is a cloud-based observability platform that offers log management as part of its comprehensive monitoring and analytics capabilities. It allows users to collect, analyze, and visualize log data alongside metrics and traces, providing holistic insights into application performance and system behavior.
It offers features such as log aggregation, search, and visualization, along with advanced analytics and alerting capabilities to help organizations monitor and troubleshoot their environments effectively.
Features
- Logs Monitoring
- Network Monitoring
- Cloud Monitoring
- Kubernetes Monitoring
- Profiling
- Error Tracking
- CodeStream
- Application Performance Monitoring
- Dashboards
- Security
- AI Monitoring
Pros
- Keeps an eye on applications, infrastructure, and user experiences
- Provides quick insights into application and user performance
- Easily creates dashboards to display important data and performance metrics
- Sends alerts when potential problems arise, helping proactive management
- Shows the complete picture of what's happening across your technology stack
- Monitors infrastructure health to ensure smooth operations
- Tracks user interactions for an improved experience
- Seamlessly integrates with various cloud services and platforms
- Facilitates decision-making based on detailed analytics and reports
- Implements features to safeguard application data
Cons
- Costs may increase, especially for larger organizations
- Learning to utilize all features might require some time
- Managing a large volume of data could demand significant system resources
- Relies on an internet connection as a cloud-based tool
- Connecting with certain platforms may involve additional setup
- Continuous monitoring may have a slight effect on application performance
You must assess these solutions according to your unique requirements, including the amount of logs, integration possibilities, scalability, and financial constraints.
Conclusion
Companies who want to improve their log management procedures should implement a Logs UI that satisfies the listed requirements. Access to an intuitive and feature-rich Logs User Interface (UI) is crucial for effectively managing the intricacies of log data, regardless of your role in IT operations, development, or system administration.
To sum up, choosing the finest Logs UI is the first step towards better log management. Organisations can improve their overall system observability and be proactive in addressing potential issues by giving priority to elements like balanced design, easy navigation, effective query performance, customisation options, and real-time updates.
Atatus Logs Monitoring and Management
Atatus offers a Logs Monitoring solution which is delivered as a fully managed cloud service with minimal setup at any scale that requires no maintenance. It monitors logs from all of your systems and applications into a centralized and easy-to-navigate user interface, allowing you to troubleshoot faster.

We give a cost-effective, scalable method to centralized logging, so you can obtain total insight across your complex architecture. To cut through the noise and focus on the key events that matter, you can search the logs by hostname, service, source, messages, and more. When you can correlate log events with APM slow traces and errors, troubleshooting becomes easy.
#1 Solution for Logs, Traces & Metrics
![]() APM
APM
![]() Kubernetes
Kubernetes
![]() Logs
Logs
![]() Synthetics
Synthetics
![]() RUM
RUM
![]() Serverless
Serverless
![]() Security
Security
![]() More
More

![Splunk vs Prometheus: A Side-by-Side Comparison [2025 Guide]](/blog/content/images/size/w960/2024/08/Datadog-vs-sentry--13-.png)