Troubleshooting Kubernetes Deployment at Every Level
Kubernetes has emerged as the de facto standard for container orchestration, with its ability to automate deployment, scaling, and management of containerized applications.
However, even with the best practices and expertise, Kubernetes deployment can sometimes be a complex and challenging process. It involves multiple layers of infrastructure, including the application, Kubernetes cluster, nodes, network, and storage, and each layer can have its own set of issues and challenges.
In this blog post, we will explore the Kubernetes deployment troubleshooting process at every level, from the application code to the infrastructure and Kubernetes components. We will delve into some common issues that can arise during the deployment process, such as container image pull errors, pod scheduling issues, network connectivity problems, and storage issues.
We will also discuss some best practices and tools that can help diagnose and resolve these issues quickly and efficiently.
By the end of this post, you'll have a better understanding of how to troubleshoot issues at every level of your Kubernetes deployment, and be better equipped to manage your applications in Kubernetes.
Table Of Contents
- Accessing Pod Details
- Troubleshooting Common Pod Errors
- Troubleshooting Application-level Issues
- Troubleshooting Infrastructure Errors
Accessing Pod Details
In Kubernetes, you can access pods and retrieve various information about their state, status, and other details using the kubectl command-line tool or by interacting with the Kubernetes API directly. Here are some common commands to access pod information:
1. To list all pods in the current namespace, use:
kubectl get pods2. To get detailed information about a specific pod, including its status, events, and conditions, use:
kubectl describe pod <pod-name>3. To access the logs of a specific pod, use:
kubectl logs <pod-name>4. To access an interactive shell inside a running container in a pod, use:
kubectl exec -it <pod-name> -- container-name /bin/bash5. To check the status of a pod, use:
kubectl get pod <pod-name> -o jsonpath='{.status.phase}'6. To view the events related to a specific pod, use:
kubectl get events --field-selector involvedObject.kind=Pod,involvedObject.name=<pod-name>7. To get the IP address assigned to a pod, use:
kubectl get pod <pod-name> -o jsonpath='{.status.podIP}'8. To find the node on which a pod is running, use:
kubectl get pod <pod-name> -o jsonpath='{.spec.nodeName}'9. To see the status of containers within a pod, use:
kubectl get pod <pod-name> -o jsonpath='{.status.containerStatuses[*].state}'10. To view CPU and memory resource usage for a pod, use:
kubectl top pod <pod-name>Troubleshooting Common Pod Errors
In a Kubernetes environment, pods are the smallest and most fundamental units for running containers. Monitoring and troubleshooting pod-related issues are critical to maintaining the stability and performance of your applications.
Upon executing the kubectl get pods command, you can observe the pods' status, and any visible errors will be displayed.
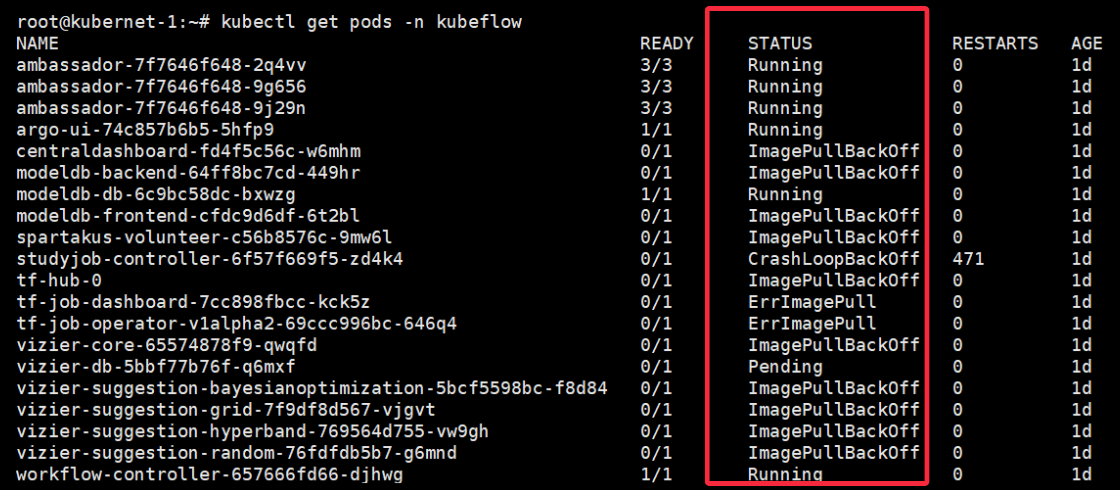
In this article, we'll explore some common pod errors that can occur in a Kubernetes cluster and how to monitor and resolve them effectively.
1. ImagePullBackOff Error
The ImagePullBackOff error occurs when Kubernetes cannot pull the specified container image from the container registry. It often happens due to incorrect image names or credentials.
Possible Causes:
- Incorrect image name or tag specified in the deployment manifest.
- Missing or incorrect container registry credentials.
Fix:
- Double-check the image name and tag in the pod's YAML manifest to ensure they are accurate.
- Verify the container registry credentials are correct and have sufficient permissions to access the image.
- Ensure that the container registry is accessible from within the Kubernetes cluster.
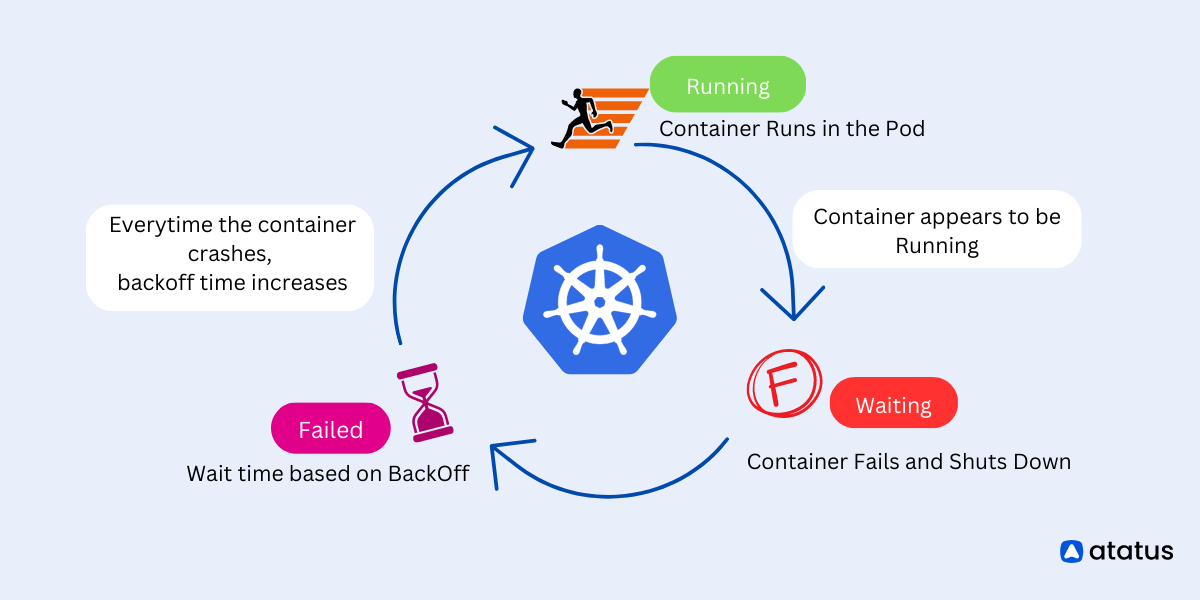
2. CrashLoopBackOff Error
The CrashLoopBackOff error indicates that the pod is restarting continuously because the application inside the container keeps crashing.
Possible Causes:
- Misconfigured application code or dependencies.
- Application errors that cause it to terminate unexpectedly.
- Incorrectly specified resource limits leading to
out-of-memoryorout-of-CPUerrors.
Fix:
- Review the pod logs to identify the specific error or crash message.
- Investigate the application code for bugs and correct any issues.
- Ensure that all necessary dependencies are properly installed within the container.
- Adjust resource requests and limits to match the application's actual resource requirements.
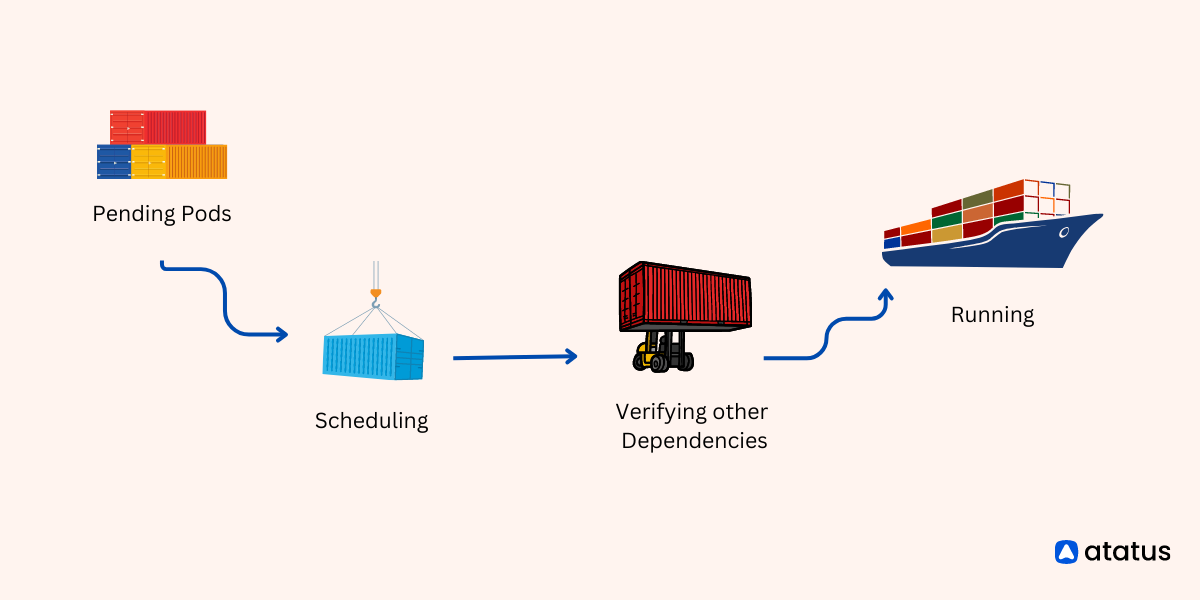
3. Pending State
Pods in the Pending state are waiting to be scheduled onto a node but are unable to do so due to resource constraints or node unavailability.
Possible Causes:
- Insufficient node resources (CPU, memory) to accommodate the pod.
- Node taints preventing pod scheduling.
- Resource requests exceeding available capacity.
Fix:
- Check the cluster's resource utilization and allocate more resources if needed.
- Review node taints and tolerations to ensure they do not block pod scheduling.
- Adjust resource requests and limits to match the cluster's capacity.
4. ErrImagePull Error
The ErrImagePull error occurs when Kubernetes cannot fetch the container image from the specified registry. Unlike ImagePullBackOff, this error typically involves image retrieval failures from intermittent connectivity issues or registry server problems.
Possible Causes:
- Network connectivity issues between the cluster and the container registry.
- Registry server problems affecting image availability.
Fix:
- Check the network connectivity between the Kubernetes nodes and the container registry.
- Review the container registry's status and performance for any server-side issues.
- Consider using container image caches or local mirrors to improve image retrieval reliability.
Troubleshooting Application-level Issues
Application errors typically originate from issues within the application code, configurations, or dependencies. We will look at some common application-level errors and ways to troubleshoot them here.
- Incorrect Application Configurations
- Inadequate Resource Allocation
- Data Integrity and Consistency Issues
- Service Discovery Problems
- Application-Specific Environment Issues
- Authentication and Authorization Errors
- Resource Quota Violations
1. Incorrect Application Configurations
Misconfigured environment variables, configuration files, or application settings causing runtime issues.
Fix:
- Review the application's configurations in the deployment manifest for any mistakes.
- Inspect
ConfigMapsand Secrets to ensure they are mounted correctly and providing the expected values. - Validate that environment variables are set appropriately for the application to function correctly.
2. Inadequate Resource Allocation
The application may perform poorly or crash due to insufficient CPU or memory resources.
Fix:
- Monitor resource utilization using
kubectl top podsandkubectl top nodes. - Adjust resource requests and limits in the deployment manifest to match the application's requirements.
- Scale the cluster or allocate more resources to nodes if needed.
3. Data Integrity and Consistency Issues
The application experiences data integrity problems, such as inconsistent database records or data corruption.
Fix:
- Verify the application's data storage mechanisms, such as databases and distributed storage solutions.
- Use Kubernetes
StatefulSetsor Deployment strategies that ensure data consistency. - Set up database backups and data consistency checks.
4. Service Discovery Problems
The application cannot discover or connect to other services within the cluster.
Fix:
- Verify that service names and DNS resolution are working correctly.
- Use service discovery methods like Kubernetes DNS to access other services.
- Check Network Policies and firewall rules that may block service communication.
5. Application-Specific Environment Issues
The application relies on specific runtime environments or external configurations that are not set correctly.
Fix:
- Check the application documentation for specific environment requirements.
- Verify that the necessary
ConfigMaps, Secrets, or environment variables are set correctly in the pod manifest. - Use Kubernetes health checks (readiness and liveness probes) to monitor the application's state.
6. Authentication and Authorization Errors
The application encounters issues with authentication or authorization to access resources or APIs.
Fix:
- Review RBAC configurations to ensure the correct permissions are granted to the application.
- Check for errors in service account configurations and authentication mechanisms.
- Test the application's access to specific resources manually if required.
7. Resource Quota Violations
Resource quotas set at the namespace level can lead to pod scheduling failures if exceeded.
Fix:
- Check resource quotas using
kubectl get resourcequotaand review resource usage in the namespace. - Increase resource quotas if required or optimize resource requests and limits for deployed pods.
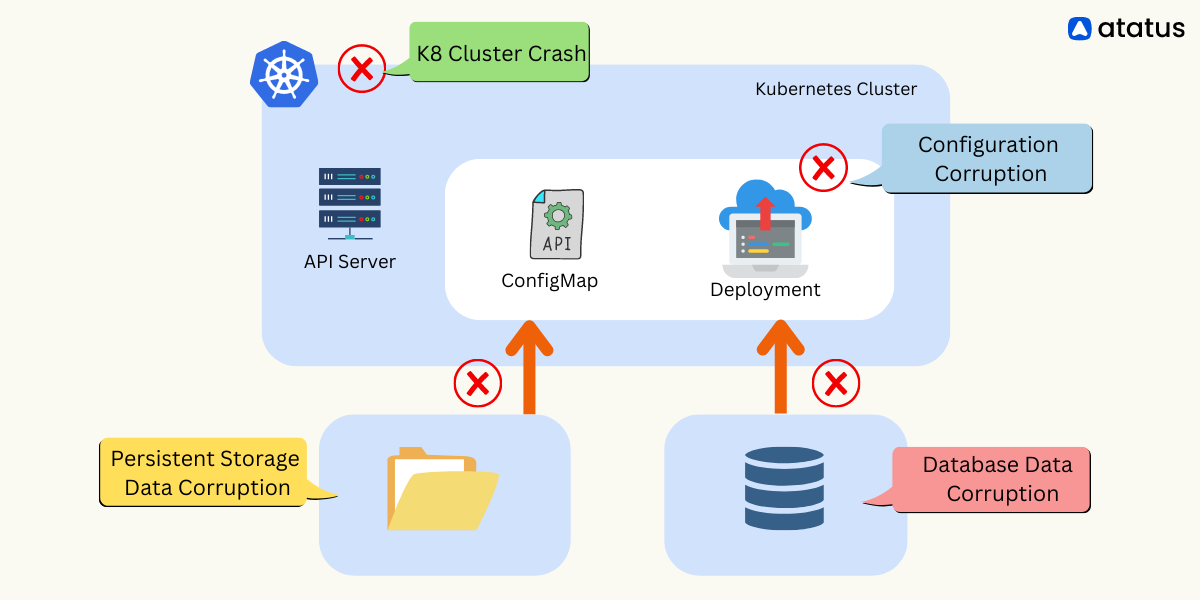
Troubleshooting Infrastructure Errors
Infrastructure errors can arise from issues related to nodes, networking, storage, and other fundamental components.
Troubleshooting infrastructure errors in Kubernetes deployments is essential to maintain the cluster's stability and ensure the applications run smoothly.
Let’s look at some of those:
- Node Not Ready
- Networking Issues
- Storage Provisioning Errors
- Cluster API Errors
- Etcd Errors
- DNS Resolution Problems
- Cloud Provider Integration Errors
- Kernel and OS Issues
- Ingress Controller-Errors
1. Node Not Ready
Nodes in the NotReady state are not functioning correctly, causing issues with pod scheduling and operation.
Fix:
- Use
kubectl get nodesandkubectl describe nodes <node-name>to check the node's status and identify any errors or problems. - Look for messages in the system logs (e.g.,
journalctlordmesg) on the node to pinpoint the issue. - Ensure that the node has enough resources (CPU, memory) available for pods to be scheduled.
2. Networking Issues
Network-related errors can lead to pod communication failures and service unavailability.
Fix:
- Check pod IP addresses and network configurations using
kubectl get pods -o wide. - Verify that network policies are correctly configured and not blocking required traffic.
- Look for firewall rules or network overlays that may cause connectivity problems.
3. Storage Provisioning Errors
Issues with storage provisioning can lead to problems with PersistentVolumes and PersistentVolumeClaims.
Fix:
- Check the status of
PersistentVolumesandPersistentVolumeClaimsusing kubectlget pvandkubectl get pvc. - Ensure the storage classes are available and bound to the correct
PersistentVolumes. - Verify that the storage provider (e.g., AWS EBS, GCP PD) is functioning correctly.
4. Cluster API Errors
Errors related to Kubernetes API interactions, such as accessing resources, creating/deleting objects, or authenticating API requests.
Fix:
- Inspect the Kubernetes API server logs to identify any API-related issues.
- Review the
kube-apiserverservice status and ensure it is healthy.
5. Etcd Errors
Etcd is the key-value store that stores Kubernetes cluster state. Issues with etcd can lead to cluster-wide problems.
Fix:
- Monitor the health of
etcdcluster members and check for any connectivity or replication issues. - Review etcd logs and consider increasing the resource capacity if
etcdis under high load.
6. DNS Resolution Problems
DNS resolution issues can cause service discovery problems and affect pod communication.
Fix:
- Verify DNS configuration in the
CoreDNSorkube-dnsdeployment manifests. - Check for any issues with the DNS service itself, such as logs or status.
7. Cloud Provider Integration Errors
If the Kubernetes cluster is running in a cloud environment, integration errors with cloud providers may occur.
Fix:
- Check the cloud provider's status and ensure that the cluster has the necessary permissions to interact with the provider's APIs.
- Monitor cloud-specific resources (e.g., load balancers, storage) to detect any issues.
8. Kernel and OS Issues
Problems at the kernel or operating system level can cause instability in the cluster.
Fix:
- Inspect system logs (
journalctl,dmesg) and system metrics for any anomalies or errors. - Check for OS updates and kernel stability.
9. Ingress Controller Errors
Ingress controllers are responsible for routing external traffic to services. Errors can lead to inaccessible services.
Fix:
- Check the status of the Ingress controller and review its logs for any issues.
- Verify that Ingress rules are correctly configured for the desired services.
Summing Up!
Troubleshooting Kubernetes deployment requires a deep understanding of the system and its components at every level. Starting from the code level, it's essential to ensure that the container images are built correctly and are compatible with the Kubernetes version.
Moving up to the cluster level, the Kubernetes components need to be monitored and managed to ensure their proper functioning. At the application level, identifying and resolving issues with networking, storage, and resource allocation is crucial.
Finally, troubleshooting at the infrastructure level involves identifying and resolving issues with the underlying infrastructure, including the nodes, virtual machines, and network configurations.
By employing monitoring solutions and best practices, you can detect issues early and take timely corrective actions to maintain a healthy Kubernetes cluster. Understanding these common pod errors will help you build a robust and resilient containerized infrastructure.
Atatus Kubernetes Monitoring
With Atatus Kubernetes Monitoring, users can gain valuable insights into the health and performance of their Kubernetes clusters and the applications running on them. The platform collects and analyzes metrics, logs, and traces from Kubernetes environments, allowing users to detect issues, troubleshoot problems, and optimize application performance.
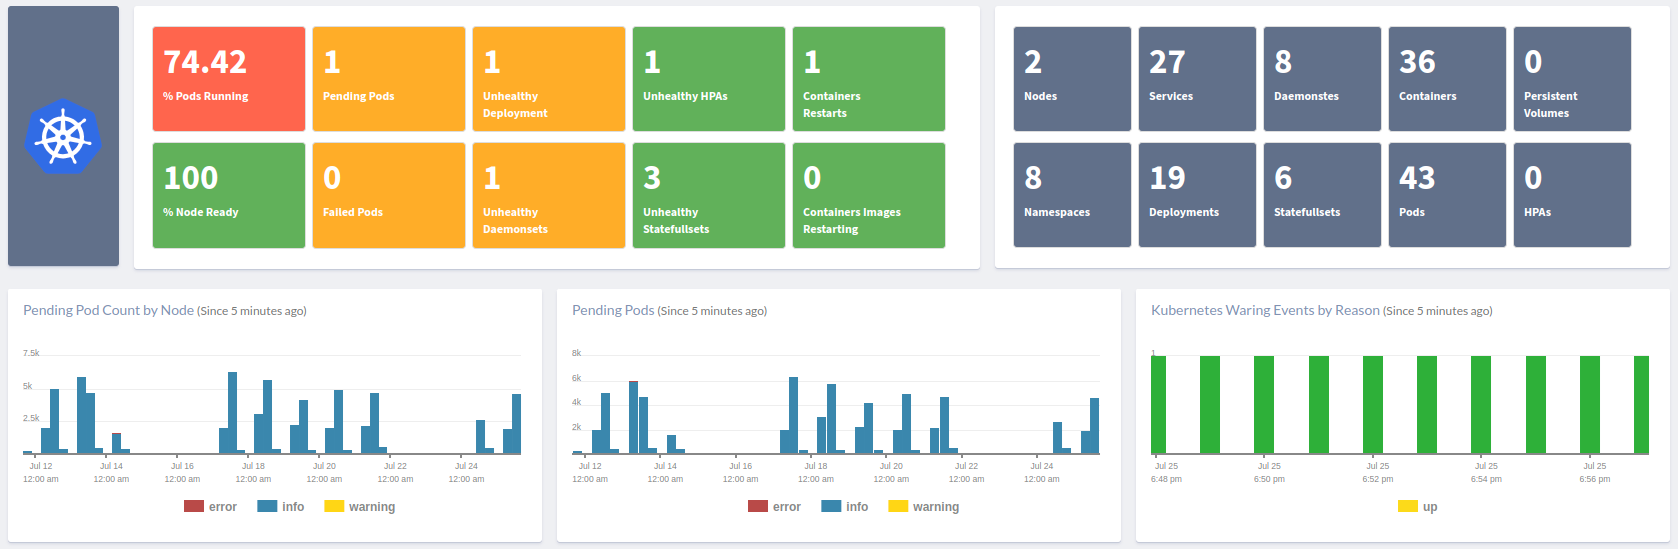
You can easily track the performance of individual Kubernetes containers and pods. This granular level of monitoring helps to pinpoint resource-heavy containers or problematic pods affecting the overall cluster performance.
#1 Solution for Logs, Traces & Metrics
![]() APM
APM
![]() Kubernetes
Kubernetes
![]() Logs
Logs
![]() Synthetics
Synthetics
![]() RUM
RUM
![]() Serverless
Serverless
![]() Security
Security
![]() More
More


![New Relic vs Splunk - In-depth Comparison [2026]](/blog/content/images/size/w960/2024/10/Datadog-vs-sentry--19-.png)