Real User Monitoring is a type of performance monitoring that records and analyses every transaction that a website or application's users make. Real user measurement, real user metrics, end-user experience monitoring, and simply RUM are some of the terms used to describe it. It's a crucial part of application performance management because it's utilized to assess user experience, including important metrics like load time and transaction pathways.
We will cover the following:
- What is Real User Monitoring?
- How does Real User Monitoring Work?
- Components of Real User Monitoring
- Benefits of Real User Monitoring
- Limitations of Real User Monitoring
What is Real User Monitoring?
Real User Monitoring (RUM) is a passive monitoring tool that records all user interactions with a website or a client connecting with a server or cloud-based application. Operators must monitor actual user engagement with a website or application to assess whether users are being served fast and without errors, and, if not, where the aspect of the business process is malfunctioning.
RUM is used by software as a service (SaaS) and application service providers (ASP) to monitor and manage the quality of services provided to its customers. Real-time user monitoring data is used to determine the actual service-level quality supplied to end-users and to discover website problems or slowdowns. The data can also be used to see if modifications made to websites have the desired effect or generate errors.
RUM is commonly used in organizations to test changes in the production environment or to predict behavioral changes in a website or application using A/B testing or other methodologies. As technology evolves to include hybrid environments such as hybrid cloud, fat clients, widgets, and applications, it becomes increasingly vital to track application usage from within the client.
How does Real User Monitoring Work?
RUM uses technologies to collect performance metrics from a website or application directly through the browser of the end-user. Data is collected from all users as they click, scroll, pause, exit, or otherwise utilize the page using a tiny piece of JavaScript included in every page. The data is then returned to be analyzed.
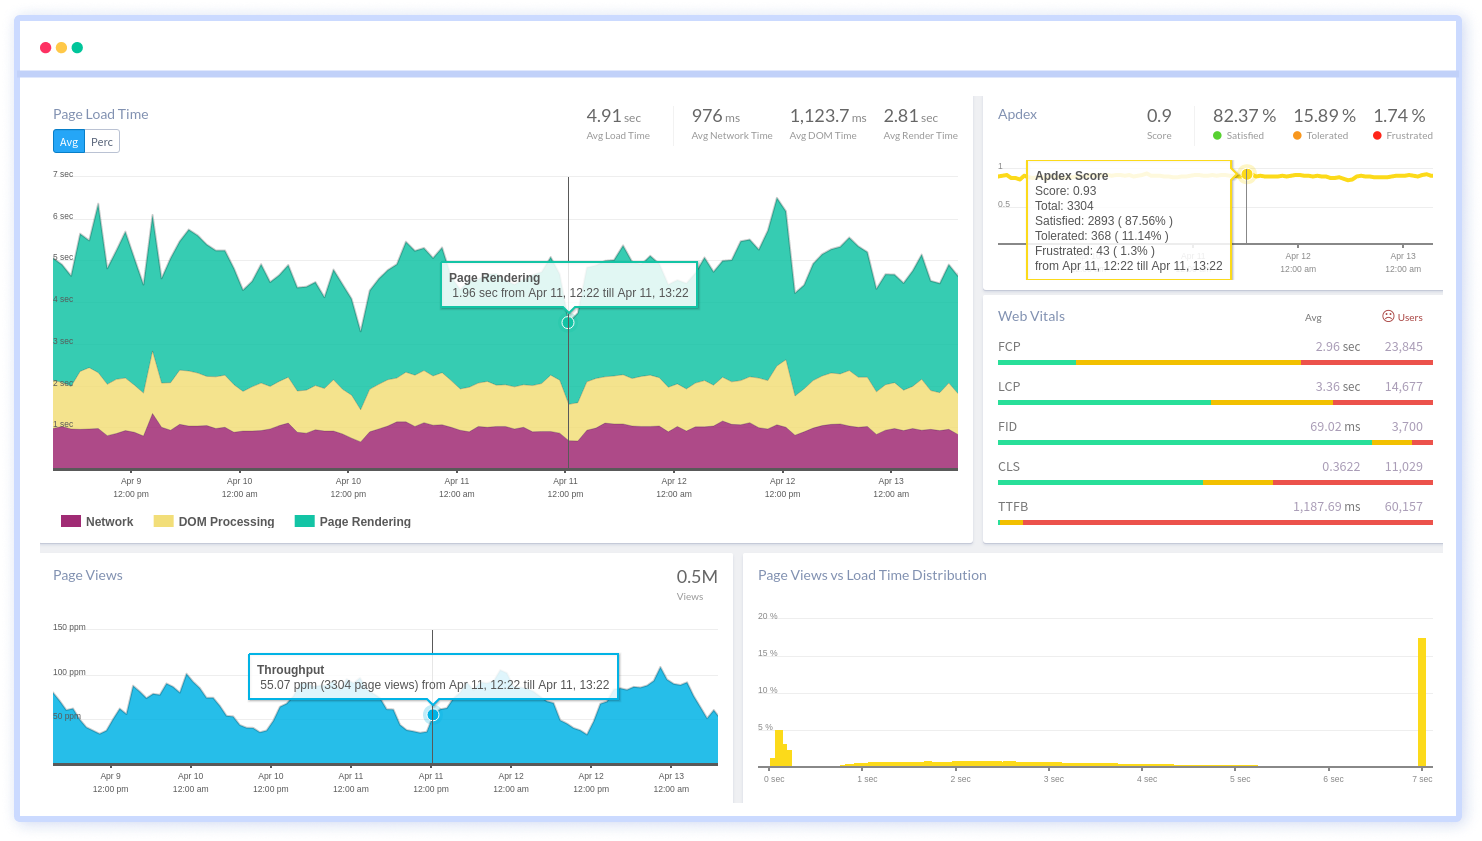
Typically, RUM includes the ability to generate reports using data that has been displayed. Because of the massive amount of data acquired by RUM, such reports are particularly valuable for platforms with high user throughput and a wide range of metrics. This data is easily legible by a wider audience and can be utilized to collect actionable insights with ease due to visualizations like charts, bars, and area graphs.
Professional web developers and system administrators that specialize in application performance monitoring typically utilize specialist RUM software to analyze website availability and response times throughout the day and to undertake in-depth and multi-tiered analysis that simpler solutions cannot.
The difference between simple tools like Google Analytics and more comprehensive RUM solutions is mostly a matter of depth, resolution, and dimensionality—specialized RUM systems focus on the examination of website/application performance from the perspective of users. Google Analytics and other simpler solutions concentrate on establishing user profiles.
Full-featured RUM solutions track and analyze client-side performance by automatically reinjecting small bits of JavaScript code into massive data volumes. As users wait for a page to load or tap through an application, RUM keeps track of essential identifying information and important milestones.
TCP connect time, DNS resolution, SSL encryption negotiation, navigation display, first-byte transmission, page render time, and TCP out-of-order segments are all occurrences that RUM keeps track of. A RUM tool can collect additional information such as the operating system, network provider, web browser version, application version, user geography, device specifications, connection type, available end-to-end bandwidth, and network latency.
Components of Real User Monitoring

RUM is used by developers to track which pages users visit, how long it takes for a response, and how and when specific websites fail. While particular monitoring is an important part of RUM, the following main components reflect the true core of this cutting-edge user experience tracking solution.
- Capturing
RUM-based application monitoring captures object and page hits from a variety of sources, including JavaScript within a web browser, load balancers, passive network taps, and server logs. Even when the content being sought is housed on another website, application monitoring solutions record details such as JSON and requests for pages and other resources from web browsers to remote servers. - Sessionization
The data received from these website visits are reassembled into a database containing the components and pages of individual visits as well as timing data. For each visit, captured data is regrouped into records that are split down into pieces like pages, page components, and timing and duration data. - Problem Detection
Errors, navigation issues, and times of delayed processing, among other things, are rigorously examined in objects, visits, and pages. All objects, pages, and sessions are evaluated for any unexpected behavior, such as delayed response times, system difficulties, web navigation errors, and other malfunctions. - Individual Visit Reporting
Individual visits can be reproduced using recorded data and examined by the technical team utilizing RUM. The nature of recreated visits varies depending on the solution—some provide only a summary of the visit, while others can replay the screens exactly as they appeared on the visitor's device screen. Technicians can utilize this data to dig into the recreated sessions of particular users and assess various elements of usage as needed. - Reporting and Segmentation
Another important feature of RUM is the ability to view aggregate data, such as how well an application works in different browser versions or how accessible a specific page is. The data is reviewed in aggregate to see if there are any issues with page availability or performance across different browser types or user categories. - Alerting
RUM constantly trawls the website or application and is likely to notice an issue promptly—especially if other, specialized monitoring tools are not implemented—it can be relied on to notify the development team in the event of any urgent issues detected by inbuilt monitoring systems. If a serious problem is detected, the system launches a warning mechanism that notifies all relevant teams, allowing them to quickly resolve the issue.
Benefits of Real User Monitoring
RUM can help to determine how visitors use a website or application. It also provides page analytics like load time for the page, object, and even individual visit analysis.
- Problem Solving
RUM helps you in identifying what is preventing your users from having a near-perfect digital experience and debugging those issues to improve their digital experience. - Segmentation
Since not everyone uses the same browsers, connection types, and other factors, limiting your speed enhancements or testing to a single operating system, browser, location, or other factor doesn't cover the majority of users who will interact with your website or web application. - Faster Actionable Sights
Know what's hurting your UX right now. A real-time monitoring function in your RUM solution helps you to receive meaningful insights about your consumers' website or application experience. - Measure Service Level
By tracking actual visitors and supplying top-level data on actual use cases, it provides a real-world measurement of critical targets. - Determine Hitches
Like needles in a haystack, issues with a website's lowest levels can be difficult to identify. Even if the problems are rare or created by uncommon conditions, it might bring them to light.
Limitations of Real User Monitoring
Despite its many benefits, RUM has several limitations. The gaps are nicely filled when the process is paired with synthetic monitoring.
- Lack of Benchmarking
RUM is unable to research your competitors' websites. As a result, comparing your website's performance against that of others is challenging. - Limited Pre-production Settings
It's not that RUM doesn't operate in pre-production environments (it does), but most clients don't have much traffic in those environments. - Too Much Data
Even with some of the better-prepackaged solutions on the market, some users say that sorting through the massive amounts of data available is challenging.
Conclusion
Customers demand the greatest experience possible every time they utilize your service. Slow or incomplete page loads, transaction problems, and other issues aren't just inconvenient; they can leave a lasting impression on your clients. No other solution can discover the barriers to a great customer experience like real user monitoring, allowing you to maintain your website or application running at optimum performance - and keep consumers coming back.
Real User Monitoring solutions are quick, effective, clear, unobtrusive, and simple to use. RUM provides incredibly relevant business insights, making it easier than ever to justify investing in it. Finally, today's RUM is simple to set up, use, and comprehend.
Also Read:
Cloud Access Security Broker (CASB)
Atatus Real User Monitoring
Atatus is a scalable end-user experience monitoring system that allows you to see which areas of your website are underperforming and affecting your users. Understand the causes of your front-end performance issues and how to improve the user experience.
By understanding the complicated frontend performance issues that develop due to slow page loads, route modifications, delayed static assets, poor XMLHttpRequest, JS errors, and more, you can discover and fix poor end-user performance with Real User Monitoring (RUM).
You can get a detailed view of each page-load event to quickly detect and fix front-end performance issues affecting actual users. With filterable data by URL, connection type, device, country, and more, you examine a detailed complete resource waterfall view to see which assets are slowing down your pages.