7 Best Docker Container Monitoring Tools in 2024
Monitoring tools aid DevOps teams in finding and resolving performance issues more quickly. With the popularity of Kubernetes and Docker continuing to grow, it's critical to establish proper container monitoring and log management practices early on.
This is no simple task. Docker container monitoring is quite difficult. Creating a strategy and a suitable monitoring system is not at all easy.
We'll go into great detail about docker container monitoring in this post, explain why you need it, and compare the top tools on the market right now.
We will go over the following:
- What is Container Monitoring?
- Why do we need to Monitor Docker Containers?
- Best Docker Container Monitoring Tools
What is Container Monitoring?
A container is a standardized software component that wraps up a code and its dependencies (much like a shipping container). This enables the deployment of applications in any computing environment simply and dependably.
A standalone, executable software package called a "docker container image" contains everything you need to run an application. An image must be run on Docker Engine to become a container.
By gathering and examining performance indicators, container monitoring keeps track of how well applications using microservice architectures function. Containers are more complex and difficult to manage than conventional applications operating on virtual machines or bare metal servers because of their transient nature.
Containers are stateless and ephemeral. Metrics and logs must be gathered and sent right away to a central location for storage. If not, they will be deleted when the container is removed. This is why it presents more of a challenge than traditional VMs and servers.
A vital step in ensuring the best performance of your containers is monitoring such an infrastructure setup.
Why do we need to monitor Docker Containers?
User experience expectations have increased to previously unheard-of levels in a short period of time. Applications that operate smoothly are the only kind that users will accept. The provision of a high-quality user experience, however, requires continual upkeep and performance control.
If you don't have a tool for monitoring Docker, you cannot know whether performance is satisfactory. To put it another way, you won't be able to evaluate its effectiveness. You won't have the tools you need to prevent performance degradation and a bad user experience without the required visibility.
Additionally, with the required visibility, you will be able to identify production-level performance concerns and gain from long-term capacity planning.
Best Docker Container Monitoring Tools
#1 AppOptics
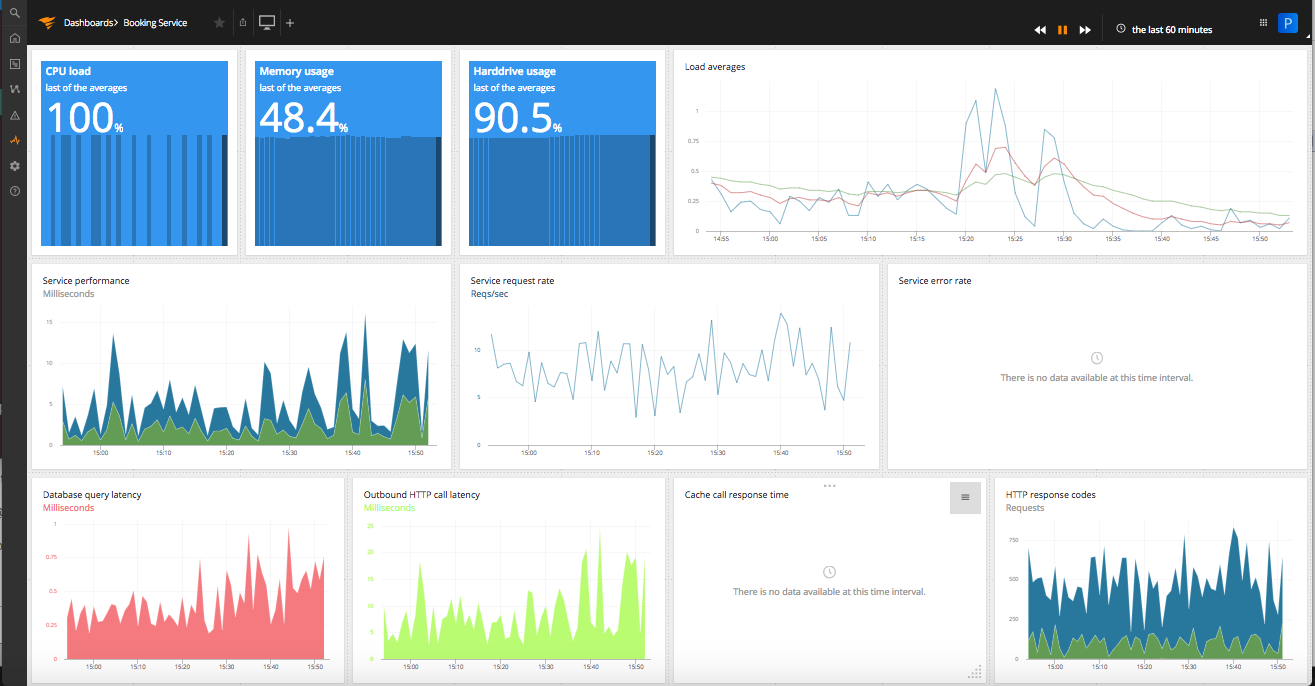
SolarWinds operates the cloud-based application monitoring solution known as AppOptics. It is offered at two different service levels. The service's top tier is known as application performance monitoring (APM).
AppOptics infrastructure refers to AppOptics' more detailed plan. The APM plan takes the infrastructure system into account. AppOptics infrastructure includes monitoring for docker.
The monitored system must have an agent program installed to use the AppOptics system. The SolarWinds Snap Agent is the name of this agent. This agent includes a Docket plug-in that is provided with AppOptics infrastructure for free but needs to be activated and installed to track resource utilization by docker containers.
The server statuses as they relate to docker activities are reported by the docker plug-in. These elements include CPU and memory activity for each container individually as well as for docker as a whole.
The plug-in also provides information on network statistics and server I/O activities, including the number of packets delivered from the server for each container and the number of packets lost.
The AppOptics infrastructure plan will be sufficient if all you want to do is monitor docker. However, if there are other apps that you believe may be delivered more effectively, you should have a look at AppOptics APM, which also includes the infrastructure package for docker monitoring.
Features:
- Easily scalable, built as a cloud service
- Monitor Docker, Azure, and Hyper-V platforms
- Provides stunning visuals of current and historical health metrics and resource usage
- Tracks CPU, memory, and network usage
AppOptics is a subscription service with up-front costs. Compared to AppOptics Infrastructure, the AppOptics APM plan is more expensive. To determine if you require the full services of that package or whether you could satisfy all of your requirements with just the infrastructure module, you can sign up for a 14-day free trial of the full AppOptics APM service.
#2 Site24x7
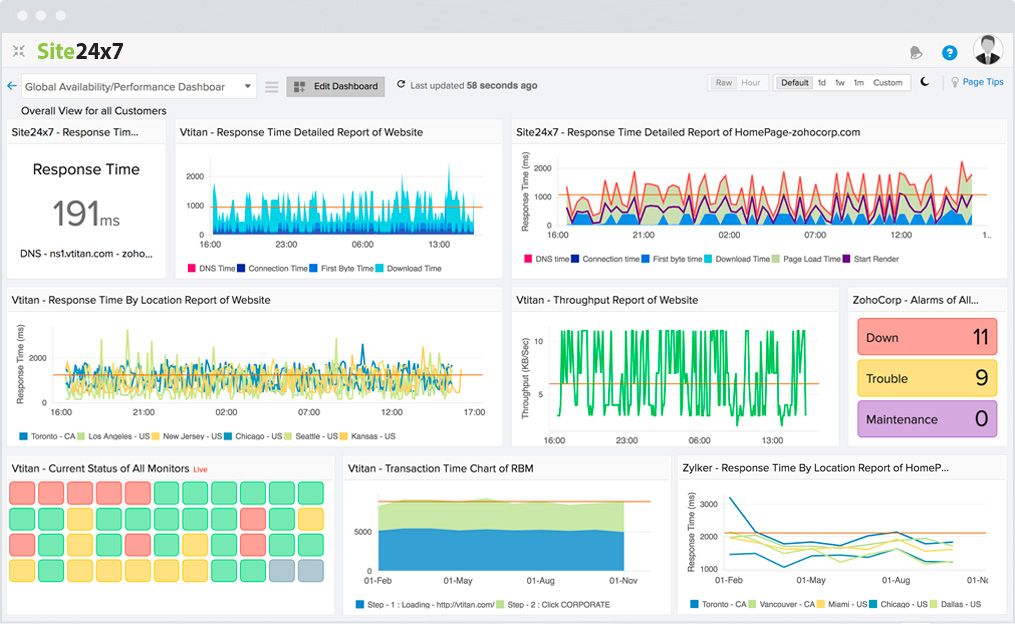
Site24x7 is a website and network monitoring service. The service's infrastructure strategy includes container monitoring for Docker activities. No matter where or with what operating system your server is running, Site24x7 Docker Monitoring will provide you with complete control over its operations.
All Docker container activity is monitored by Site24x7. Each metric is gathered, and the service console displays the data. The dashboard contains a Start/Stop facility that allows it to control containers in addition to monitoring them.
This system can monitor activity produced by your own internal servers as well as containers on cloud platforms like AWS EC2, Google Cloud Platform, and Azure.
You can gain complete supervisory control over a variety of networking and application services, not just Docker containers, with a Site24x7 Infrastructure account. It can also keep an eye on Hyper-V and VMware hypervisor systems.
The Site24x7 Infrastructure plan maintains data for time series analysis in addition to giving real-time feedback on Docker activity. One of the most comprehensive monitoring solutions on the market, supporting actual user monitoring, networks, and infrastructure on a single platform.
Features:
- Good for virtualization
- Live monitoring and historical analysis
- Monitors on-premises and cloud hosts
The pricing structure for the infrastructure plan is complicated. It is a monthly subscription service with a starting cost of $7. The package includes a range of add-on services and can monitor up to 10 servers. A 30-day free trial of Site24x7 Infrastructure is available.
#3 Sematext
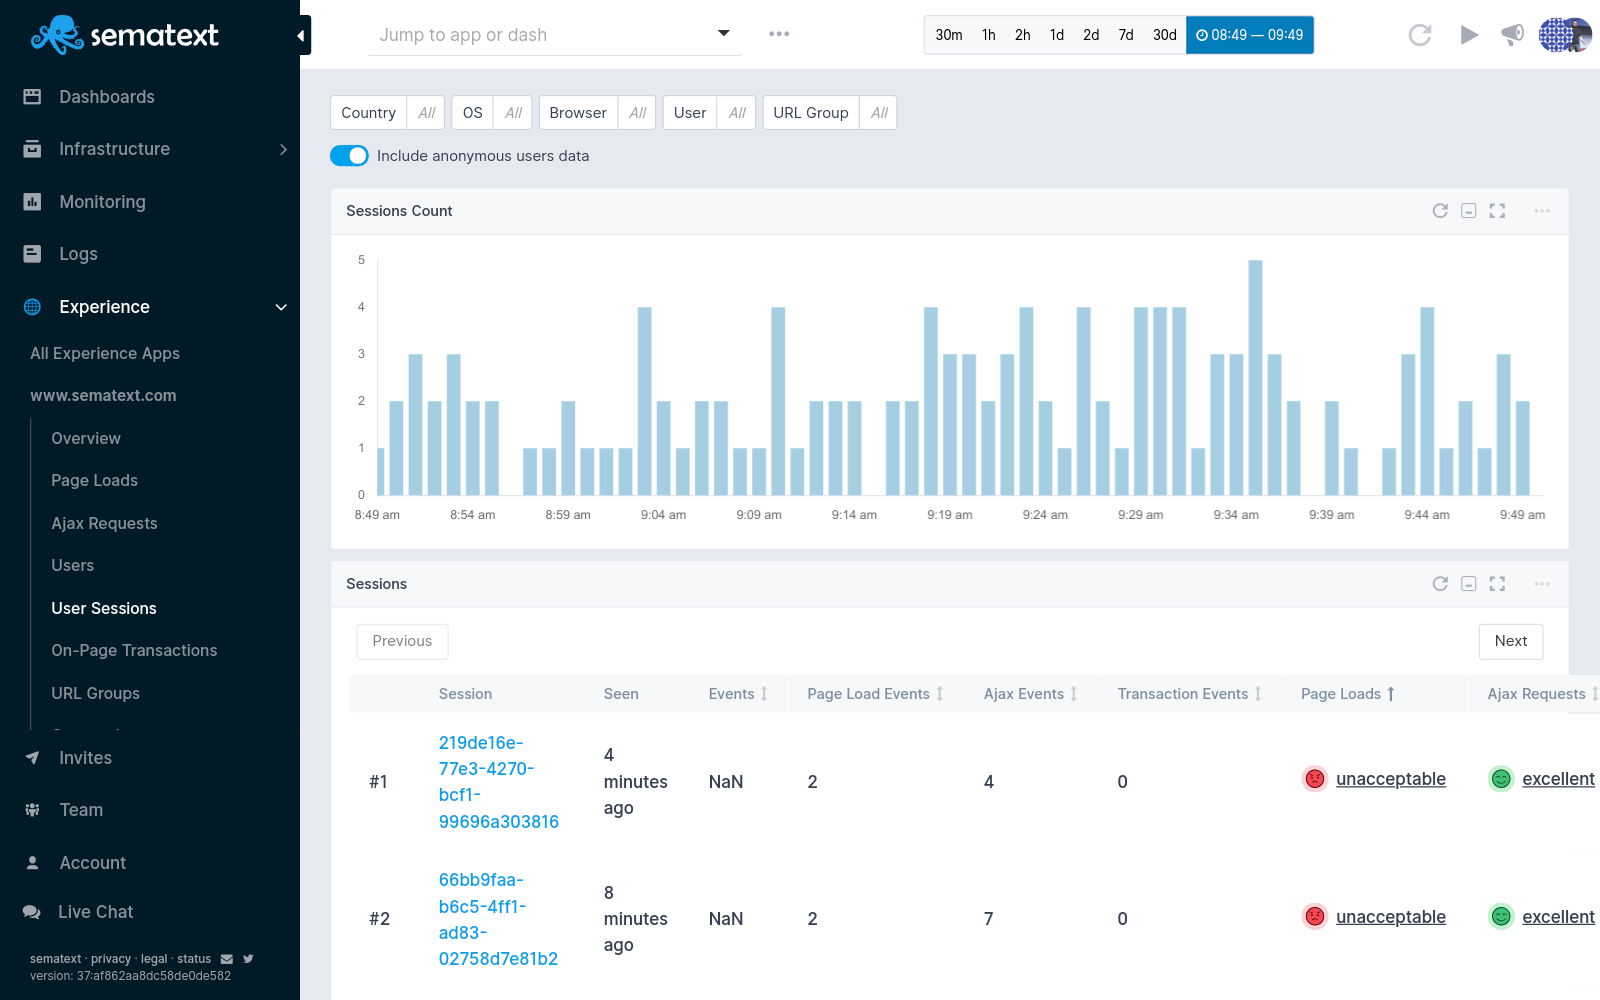
Sematext is a full-stack observability solution with support for Docker monitoring. It offers a more thorough monitoring dashboard that is simple to set up for metrics, events, and logs, giving you useful information about containers and infrastructure.
You can get everything you need in one place, for better and quicker troubleshooting, including anomaly detection, alerts, and correlations between all components of your infrastructure, clusters, and containers.
Sematext's auto-discovery features allow you to start services and log monitoring immediately through the user interface without additional steps, and it automatically recognizes new containers and the containerized apps running in them.
You gain complete awareness of and knowledge of your infrastructure. Whether you are using bare metal, virtual machines, or an orchestrated container environment like Docker Swarm, Rancher, or Kubernetes, it makes no difference what platform you are using.
The Sematext Agent leverages containerization to gather performance metrics for the entire system in addition to statistics on Docker performance.
Each Docker container's host resource usage can be tracked by the agent. The CPU, memory, page swaps, disk I/O, and errors are all listed. Additionally, the service collects information on the amount of network traffic produced by the running Docker containers.
Features:
- 100+ integrations for the most popular stacks
- Automated Discovery and Sematext Agent
- Good for hybrid environments
- Has a freeware version for testing
- Supports threshold-based alerts
The Sematext dashboard can be accessed from anywhere using any common browser because it is a cloud-based system. The service is paid for through a subscription, with live monitoring charged at a fee per hour and log monitoring payable every month. A 30-day free trial of the Sematext monitoring is available.
#4 Dynatrace
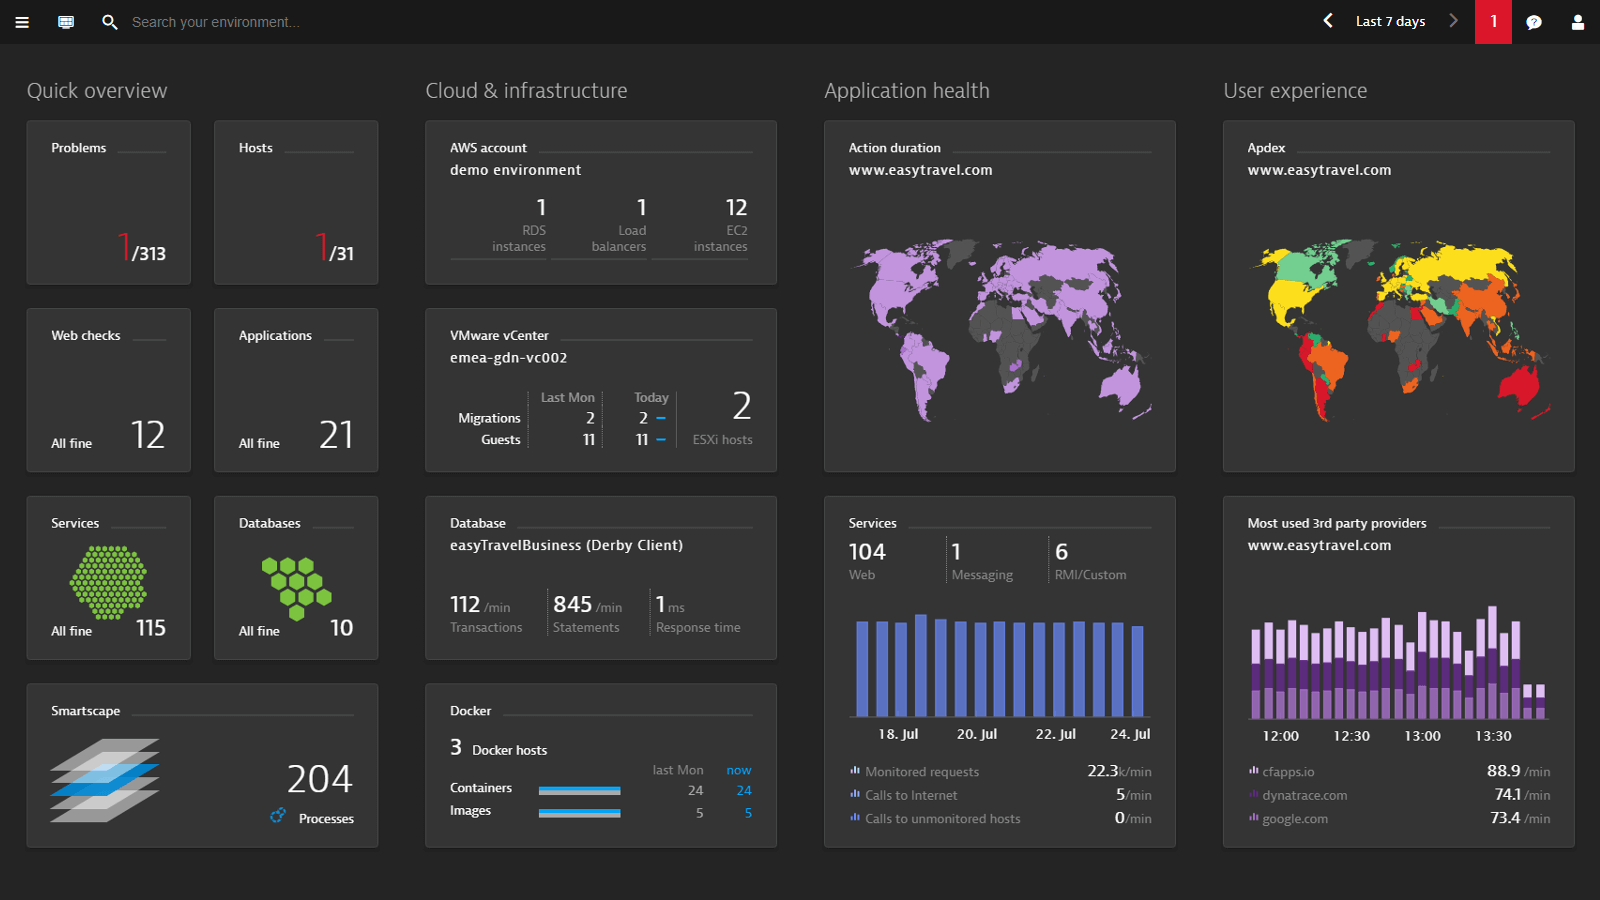
Dynatrace is a full-stack observability solution that offers an approach that is user-friendly for monitoring your Docker container metrics and logs. Similar to what you could only obtain by running the docker stats command, Dynatrace enables you to examine the container resource utilization of various hosts.
For container platforms like Kubernetes, OpenShift, Cloud Foundry, and Docker, Dynatrace delivers automation and AI technologies. You can achieve full-stack observability with Dynatrace and keep an eye on the resource usage, health, and availability of your containerized infrastructure.
Using pre-defined rules or making your own to track custom metrics, you can keep an eye on all the crucial indicators. The data gathered will all be represented visually. Dynatraces AI provides ongoing dependency mapping and self-discovery.
The infrastructure monitoring solution includes Docker monitoring. Data from the cloud, hybrid, containers, VMs, networks, servers, storage, and many other sources is gathered by Dynatrace.
It will meet the majority of your monitoring requirements for Docker, its logs, and the infrastructure it is running on and is available in both software as a service (SaaS) and on-premise models.
Features:
- Also tracks microservices
- Application dependency mapping
- Container discovery
- Highly visual and customizable dashboards
- Platform-independent
Dynatrace is a great option if you're looking for a scalable Docker monitoring solution. You must speak with the company directly to view the cost of Dynatrace.
#5 ManageEngine
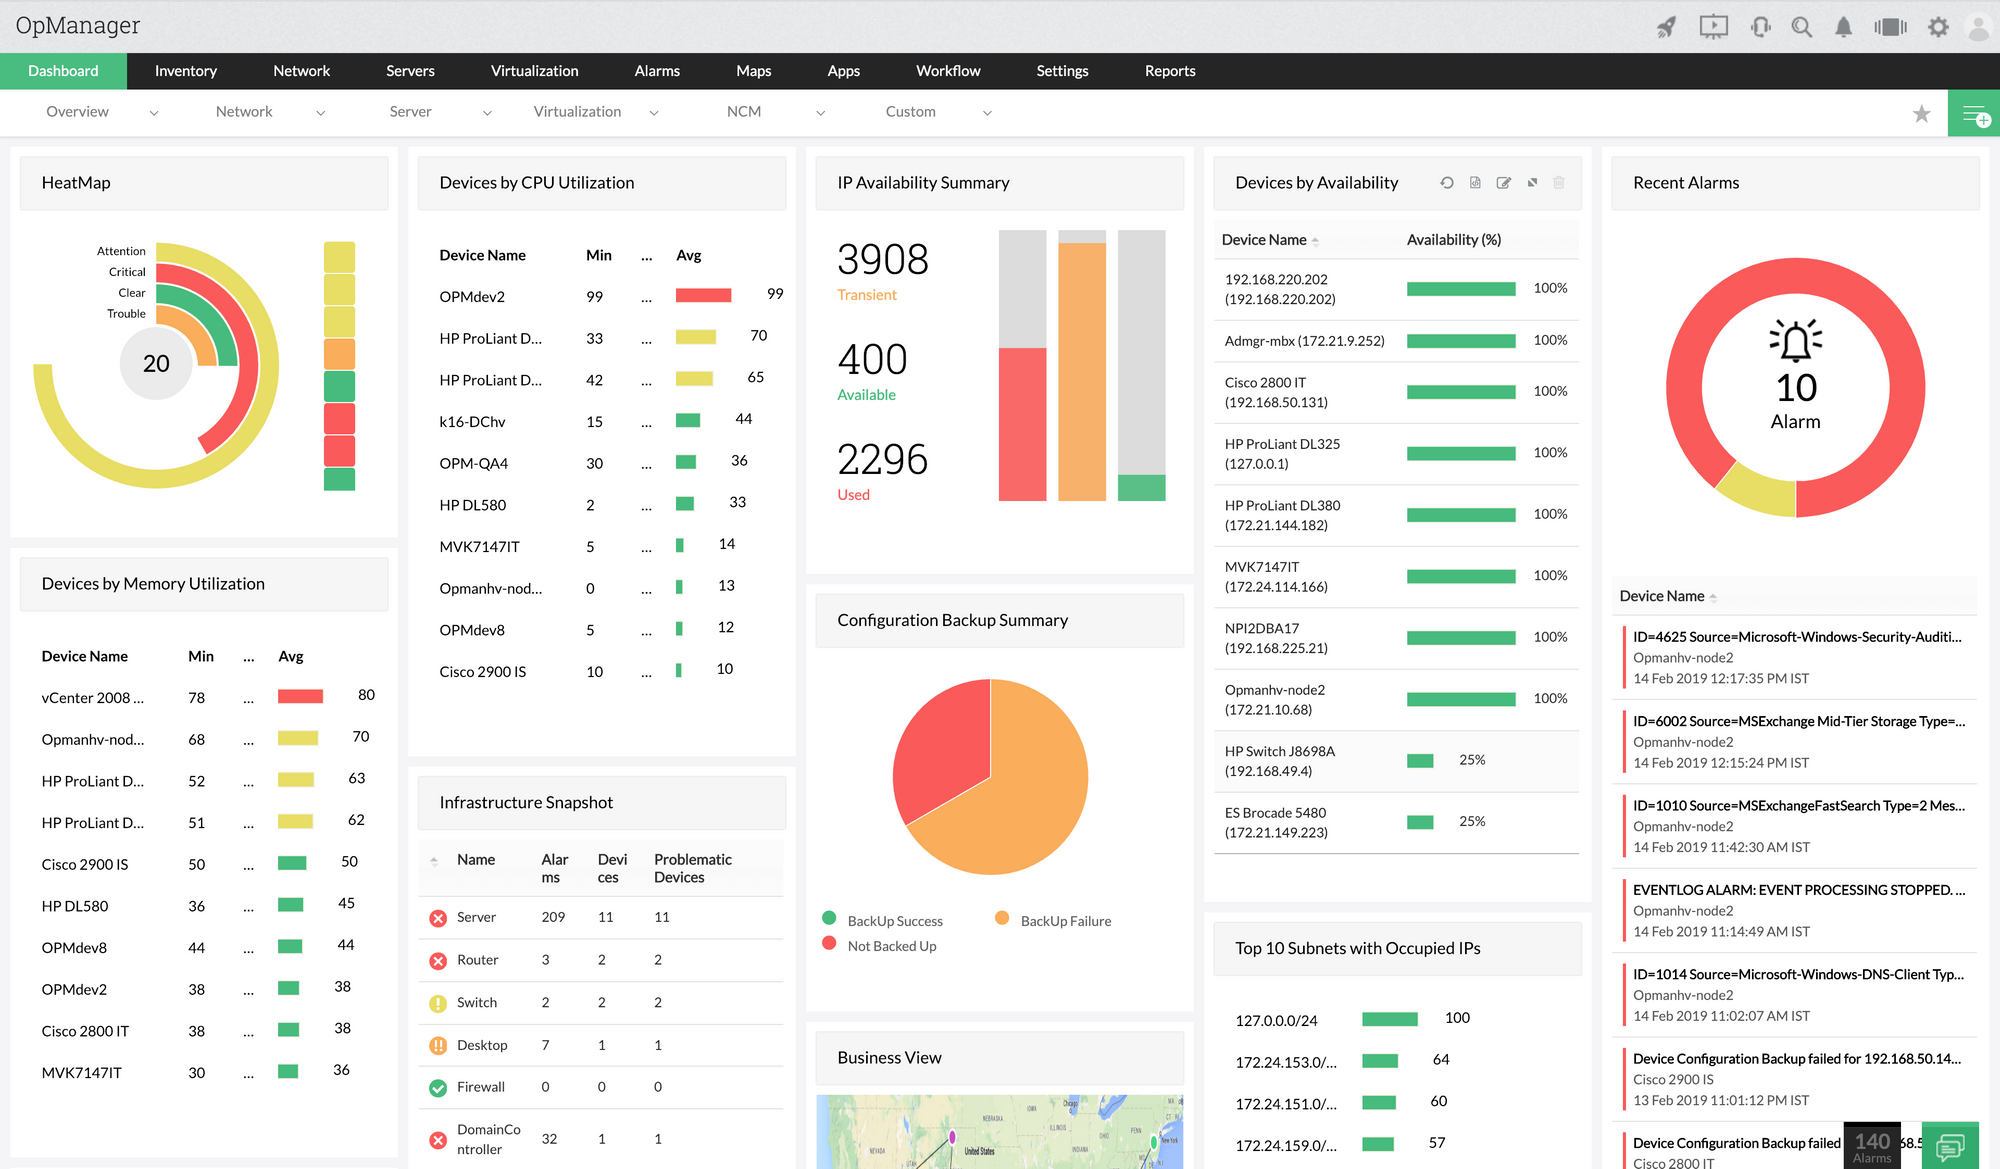
The ManageEngine APM tool called the applications manager has built-in support for monitoring Docker. From the URL to the line of code, it lets you quickly identify and resolve performance issues throughout your whole application stack. Gaining visibility into servers, virtual machines, and databases both locally and in the cloud.
For all of your server and application monitoring requirements, it is an integrated APM. Applications Manager provides proactive application monitoring services to track performance metrics in real-time for thorough infrastructure monitoring.
Applications Manager supports more than 100 popular technologies than other application monitoring solutions, including servers, virtual machines, containers, application servers, databases, big data stores, middleware & messaging components, web servers, web services, etc.
Additionally, ManageEngine Applications Manager allows you to create thorough reports. Data about active files, inactive files, RAM paging, and caching is included in reports. This data can be used to determine how well your resources are being used.
The software also has a system for alerts that sends out notifications by alert guidelines. Alerts can be set up to send by SMS and email. Additionally, you can automate tasks like starting, halting, or restarting a container. Automation helps handle problems that constantly coming up.
Features:
- Dependency mapping
- Memory, CPU, and disk monitoring
- Offers on-premise and cloud deployment options
- Root cause analysis
For monitoring up to five servers or applications, ManageEngine Applications Manager is free to use. You can purchase the Professional and Enterprise editions, both of which are paid. The 30-day free trial can be downloaded to get started.
#6 Sumo Logic
Sumo Logic provides central, container-aware log management that enables correlation between container events, configuration data, and host and daemon logs. A log management solution from Sumo Logic is offered in the cloud, on-premises, and hybrid configurations.
Log centralization enables you to establish several dashboards, observe all of your monitors at once, correlate issues, and do root-cause analyses that are supported by machine learning.
Additionally, Sumo Logic offers security and compliance management. It delivers quick threat identification, aids in breach detection, and makes use of other threat intelligence products due to its log analysis capabilities.
Predictive analytics, anomaly detection, and outlier detection give you in-depth insights into the performance of your architecture. Sumo logic offers real-time visibility into cloud apps and infrastructure on AWS, Azure, and GCP.
In addition, you have access to over 150 native integrations and apps, giving you complete out-of-the-box visibility into third-party technologies.
With Sumo Logic, you have access to both a live dashboard and an interactive dashboard. The live dashboard displays several real-time data in the chronological sequence that they are received. However, there isn't an option to access older data.
Features:
- AI-based problem detection
- Anomaly-based detection
- Great dashboard visualizations, highly customizable
- Uses intelligent alerting
Sumo Logic is available in three different editions: Free, Professional, and Enterprise. Sumo Free is free and supports log input of up to 500MB, and 4GB of space for logs.
The Professional version has a minimum of 3GB of log input and 30GB of log storage at $108 (£86) per GB/month. The Enterprise edition has the same log restrictions as the Professional version and costs $180 (£144) per GB per month. The free trial period of 30 days is available.
#7 Datadog
A platform for monitoring applications and services called Datadog integrates Docker. To create a full-stack monitoring suite, it combines Docker monitoring with the application, server, and network monitoring.
The Datadog platform is a good option for a Docker container monitoring system since this application can keep an eye on servers, networks, and apps, giving it a complete picture of everything that goes into a Docker container.
Additionally, the service can produce application dependency maps that show which services use containers and which support Docker. When any component of your IT infrastructure exhibits performance issues, you can immediately undertake root cause analysis with the use of this information.
The Datadog agent must only be installed. You are ready to go if the agent is already installed. If not, simply download the agent package and adhere to the instructions.
The 350 metrics per monitored instance default restriction is the only thing to be aware of. If you want complete insight into your containers, you can also automatically collect Docker logs.
Features:
- Alerts for performance problems
- Customizable dashboards
- Server resource monitoring
- Supports auto-discovery
- Tracks container creation and destruction
Datadog is offered in four different editions: Infrastructure, APM, Log Management, and Synthetics. Start with a 14-day free trial to get going.
Conclusion
There are several tools available to monitor our Docker containers. It is always up to the requirements and metrics we need to monitor, as well as the combination of the current DevOps toolchain employed in our infrastructure, to make a precise pick from among this diversity of tools.
To optimize our systems and applications, it is important to keep a close check on what happens inside these containers.
Simply put, every container runs its environments, processes, and variables, and has its virtual network and storage configuration, making monitoring philosophy already difficult in docker systems.
We have made an effort to cover the most well-liked tools available by combining free software with premium platforms and tools in this article.
We can compare these tools based on a few metrics, the user interface (UI), the price, and the performance, but the optimal monitoring solution will rely on the tools we now have the problems we face, and the demands we have.
Monitor Your Entire Application with Atatus
Atatus is a Full Stack Observability Platform that lets you review problems as if they happened in your application. Instead of guessing why errors happen or asking users for screenshots and log dumps, Atatus lets you replay the session to quickly understand what went wrong.
We offer Application Performance Monitoring, Real User Monitoring, Serverless Monitoring, Logs Monitoring, Synthetic Monitoring, Uptime Monitoring, and API Analytics. It works perfectly with any application, regardless of framework, and has plugins.

Atatus can be beneficial to your business, which provides a comprehensive view of your application, including how it works, where performance bottlenecks exist, which users are most impacted, and which errors break your code for your frontend, backend, and infrastructure.
If you are not yet an Atatus customer, you can sign up for a 14-day free trial.
#1 Solution for Logs, Traces & Metrics
![]() APM
APM
![]() Kubernetes
Kubernetes
![]() Logs
Logs
![]() Synthetics
Synthetics
![]() RUM
RUM
![]() Serverless
Serverless
![]() Security
Security
![]() More
More