Why Your APM Needs Observability - Metrics, Logs, and Traces Explained
Modern software applications are increasingly complex. Microservices, cloud infrastructure, and distributed architectures make it challenging for developers, DevOps engineers, and SREs to maintain high performance and a seamless user experience. Traditional Application Performance Monitoring (APM) provides critical insights into how applications perform, but alone, it often leaves blind spots when it comes to diagnosing issues or understanding the full system behavior. This is where observability comes in, expanding APM with deeper, correlated insights across metrics, logs, and traces.
In this blog,
- Understanding APM and Observability
- The Three Pillars of Observability
- Metrics: Quantitative Performance Indicators
- Logs: Detailed Event Records
- Traces: Transaction and Request Flows
- How Observability Enhances APM
- Benefits of Combining APM with Observability
- Achieve Full Visibility with Atatus Observability
Understanding APM and Observability
Application Performance Monitoring (APM) focuses on application performance metrics and transactions, providing a high-level view, while observability is a broader approach that uses telemetry data like logs, metrics, and traces to provide deep, holistic insights into a system's internal state.
What is Application Performance Monitoring (APM)?
A method for monitoring the performance and availability of software applications. It tracks metrics like response times, transaction throughput, and error rates.
APM helps understand how an application is performing from a high-level, user-experience perspective. APM tools often use agents that sit within the application's code to collect data.
What is Observability?
Observability is a broader concept that goes beyond APM. It enables teams to understand a system’s internal state by analyzing external outputs such as metrics, logs, and traces.
By correlating data from multiple sources, observability provides deep technical insights into complex systems. It helps developers explore system behavior, uncover hidden dependencies, and investigate unexpected issues.
The Three Pillars of Observability
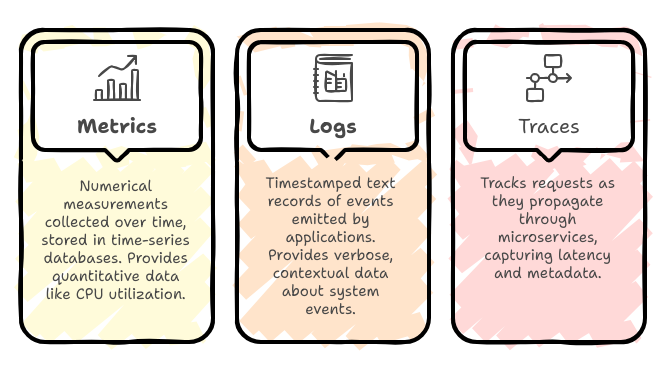
Observability relies on three core telemetry data types: metrics, logs, and traces. Each offers unique and complementary perspectives on system health, together creating a comprehensive understanding.
Metrics: Quantitative Performance Indicators
Metrics are numerical measurements collected over time, typically stored in time-series databases. They provide quantitative data such as CPU utilization, request rates, error counts, and latency distributions.
- Purpose: Metrics allow developers and SREs to monitor system trends and performance baselines, trigger alerts based on thresholds or anomalies, and visualise system health via dashboards.
- Use case: For example, tracking HTTP error rates helps identify sudden spikes that indicate application or network issues.
- Advantage: Metrics are lightweight and efficient to store/aggregate, making them ideal for real-time monitoring of large-scale infrastructure.
💡Also read →Top 15 Application Performance Metrics for Developers and SREs
Logs: Detailed Event Records
Logs are timestamped, often unstructured or semi-structured text records of discrete events emitted by applications, services, or infrastructure components. They provide verbose, contextual data about what happened in the system at a specific time.
- Purpose: Logs are invaluable for root cause analysis and forensic troubleshooting by showing detailed error messages, stack traces, and system states.
- Use case: When a service fails intermittently, engineers can analyze correlated logs to identify the sequence of events preceding the failure.
- Challenge: Log data can be voluminous and costly to store; maintaining and querying logs efficiently requires advanced indexing and storage solutions.
Traces: Transaction and Request Flows
Distributed tracing tracks requests as they propagate through various microservices or components, capturing latency and metadata at each hop.
- Purpose: Tracing provides visibility into the end-to-end flow of transactions, illustrating where delays, errors, or bottlenecks occur in the architecture.
- Use case: In a microservices environment, traces can pinpoint a slow database query causing overall service latency, a task difficult to detect from metrics alone.
- Benefit: Traces correlate distributed events, enabling teams to visualise dependencies and troubleshoot complex, multi-service interactions.
How Observability Enhances APM
In traditional APM, the scope is limited to application-level performance metrics. These metrics help you detect anomalies but not necessarily diagnose them. Observability extends APM by providing correlated, high-dimensional telemetry data, metrics, logs, and traces enabling deep system-level visibility and precise root cause analysis across distributed architectures.
1. End-to-End Correlation Across Telemetry Data: Observability links metrics, logs, and traces using shared Trace IDs via OpenTelemetry. This correlation lets APM tools track every request across services and instantly pinpoint where and why failures occur.
2. Root Cause Analysis Through Distributed Tracing: Distributed tracing visualizes each request path with spans showing latency, operation names, and metadata. It helps isolate slow services, failed dependencies, or network delays at a granular level.
3. Contextual Event Analysis via Log Correlation: Embedding trace context in logs enables direct mapping between errors and traces. Engineers can move from a failing API call to the exact log event or SQL query in seconds.
4. Multi-Dimensional Metrics and Adaptive Alerting: Observability introduces high-cardinality metrics labeled by service, endpoint, or version. Combined alerts across latency, error rate, and resource use improve detection accuracy.
5. System-Level Visibility Beyond the Application Layer: It extends APM visibility into infrastructure, containers, and external APIs, correlating system and application telemetry to find the real cause of performance degradation.
| Aspect | Traditional APM | APM with Observability |
|---|---|---|
| Data Collected | Metrics only (CPU, latency, throughput) | Metrics + Logs + Traces for full context |
| Visibility | App-level only | End-to-end across services, infra, APIs |
| Root Cause Analysis | Manual correlation from metrics/logs | Correlated traces pinpoint root cause fast |
| Correlation | Disconnected tools and datasets | Unified telemetry via trace/span IDs |
| Instrumentation | Agent-based, limited automation | OpenTelemetry auto-instrumentation |
| Alerting | Static thresholds per metric | Anomaly + multi-signal alerting |
| Scalability | Struggles with microservices | Built for distributed, cloud-native systems |
| Troubleshooting Speed | Slow, manual log digging | Instant trace-to-log correlation |
| Use Case | Monitor app uptime and performance | Understand system behavior under any condition |
Benefits of Combining APM with Observability
- Faster Troubleshooting: By correlating metrics, traces, and logs via unified trace IDs, engineers can pinpoint the root cause of latency spikes or failures instantly. This reduces MTTR by eliminating manual log searches and fragmented dashboards.
- Proactive Detection: Observability enables real-time anomaly detection through multi-signal monitoring, combining latency, error rate, and resource metrics. Early deviations trigger alerts before user-facing impact occurs.
- Improved Collaboration: With shared telemetry pipelines, Developers, DevOps, and SREs operate from a single data context. Trace-linked metrics and logs ensure faster triage and coordinated response without cross-team friction.
- Data-Driven Optimisation: Correlated traces expose inefficient queries, redundant API calls, or slow microservice dependencies. Teams can make evidence-based performance tuning decisions using actual runtime behavior data.
- Enhanced User Experience: Continuous visibility across the full request path ensures minimal latency, lower error rates, and consistent performance directly improving user satisfaction, retention, and conversion rates.
Achieve Full Visibility with Atatus Observability
Modern applications are complex, and performance issues can arise anywhere from microservices and databases to third-party APIs. Atatus Observability combines metrics, logs, and distributed traces into a single, unified platform, giving you complete visibility across your systems.
With Atatus, you can:
- Correlate metrics, logs, and traces instantly: Identify exactly which service, endpoint, or query is causing latency or errors.
- Perform precise root cause analysis: Distributed tracing lets DevOps engineers and SREs pinpoint slow requests and failed dependencies across microservices.
- Monitor in real time: High-cardinality metrics and multi-signal alerts detect anomalies before they impact users.
- Optimize system performance: Correlated telemetry highlights inefficient queries, redundant API calls, or misconfigured services, enabling data-driven improvements.
FAQs
1. What is Application Performance Monitoring (APM)?
APM is the process of tracking how well an application performs in real time. It monitors metrics like response times, error rates, and transaction throughput to ensure users get a smooth experience. APM tools help detect performance bottlenecks, slow transactions, or code-level issues before they affect users.
2. What does APM stand for?
APM stands for Application Performance Monitoring. It’s a set of tools and practices that allow developers, DevOps engineers, and SREs to detect, diagnose, and resolve application performance issues in real time.
3. What is observability in software systems?
Observability is the ability to understand what’s happening inside a system by analyzing data generated from it mainly metrics, logs, and traces. It gives teams deep insights into system behavior, helping them troubleshoot faster and understand why an issue occurred, not just where.
4. What is the difference between APM and observability?
APM is focused on monitoring application performance measuring how fast, reliable, and efficient your software runs. Observability goes deeper by helping teams understand why issues occur. While APM tells you something is wrong, observability helps you find out why it’s wrong. In modern microservices environments, both work hand-in-hand to ensure reliable and high-performing applications.
5. What are the three pillars of observability?
The three pillars of observability are:
- Metrics: Numerical data that reflect system performance (e.g., CPU usage, response time).
- Logs: Event records that capture what happened within a system.
- Traces: Detailed request paths that show how different services interact.
Together, these pillars help teams understand, debug, and optimise distributed systems.
#1 Solution for Logs, Traces & Metrics
![]() APM
APM
![]() Kubernetes
Kubernetes
![]() Logs
Logs
![]() Synthetics
Synthetics
![]() RUM
RUM
![]() Serverless
Serverless
![]() Security
Security
![]() More
More