What are CDN Logs and Why Do They Matter
Content Delivery Network produces numerous log files called CDN logs to deliver video across the internet to our homes and mobile devices. These logs contain crucial information about the CDN servers' performance and video streaming quality.
Also, it contains terabytes of data, which has its own set of hurdles in terms of handling it in real-time and performing analytics to understand user experience and network concerns.
A content delivery network (CDN) is a collection of servers located across the globe that work together to deliver internet content quickly. A CDN allows for the rapid distribution of elements like HTML pages, JavaScript files, stylesheets, photos, and videos that are needed to load internet content.
CDN services are becoming increasingly popular, and they now handle the bulk of web traffic, including traffic from major sites like Facebook, Netflix, and Amazon.
Here’s how it is done:
- Introduction
- Using CDN Logs
- CDN Logs Collection and Delivery
- A Common Web Access Log
- CDN Logs for Performance Monitoring
- Benefits of CDN Logs
Introduction
According to recent research conducted by an observability tool vendor, more than half of developers and operators rely on customers to notify them of issues, indicating that their monitoring systems have a significant blind spot. Teams with full monitoring and observability solutions were 30 percent more likely to be among the top-performing DevOps teams.
Let's look at another gap in making web applications observable and discovering errors promptly today: gathering metrics from CDN (Content Delivery Network) logs and providing real-time insights, such as rises in error rates on certain websites or dips in processed traffic.
CDNs generate CDN logs that can be analyzed, and the data is priceless. CDNs are meant to help scale your traffic without overloading your load balancers by hosting servers all over the world. In addition, a CDN provides additional protection against many of the most prevalent cyber-attacks.
CDN log analysis is the missing element in your observability, and ignoring them is a mistake. Since a CDN is such an important aspect of your infrastructure, it deserves to be treated as such in your alerting and monitoring conversations.
If you're only attempting to transfer static content like images and the like, the lack of logging isn't a major concern because you probably have decent statistics based on access to the base page or a tracking counter or something similar.
However, if you're attempting to keep track of things like software downloads, it's a far bigger issue. CDN Logs also allow you to verify exactly what is going on, which can be useful for troubleshooting and resolving billing issues.
Using CDN Logs
Using CDNs like Akamai, HTTP log streams can be made available for an entire website, spanning all underlying applications. This allows for real-time data processing, allowing for a better understanding of the web replies received by users. The challenge with processing CDN logs is that there is so much data. The goal is to provide a scalable, low-cost solution that can handle millions of daily log lines.
Depending on whatever CDN provider you choose, accessing the logs will be different. Consider the following scenario:
- The Log Delivery Service from Akamai allows you to capture logs from their edge cache servers.
- Fastly has its own log streaming approach for extracting logs.
- Cloudfront is linked with many major AWS products, such as S3 and Kinesis, to offer real-time data and access logs.
- Cloudflare offers two services: LogPush, which lets you select where your logs should be transmitted, and LogPull, which lets you query logs whenever you want.
Whatever approach you use, you'll need to come up with a way to retrieve logs straight from your provider. After you've obtained the logs, you'll need to know what you're looking at.
Edgesense is an open-source solution that uses Amazon Web Services' serverless functionalities and streaming services. This is how it works:
- Data is gathered from the CDN
- The data is processed in order to map URLs to specific types of pages and stages in the user journey
- Calculate data metrics such as the total number of requests, the number of requests by HTTP status code, and the number of requests by URL pattern
- Make metrics available to monitoring systems, so they can view the data and send alerts
You'll be able to easily detect problems after several software releases, reducing the Mean Time To Resolve (MTTR). DevOps metrics, like error rates, are also reported using CDN logs.
CDN Logs Collection and Delivery
You can see how your websites, applications, content, and hardware/software resources are used and performed by looking at access logs. They can also assist you in analyzing and debugging new or problematic features.
Response times, resource use, traffic, trending, geographic patterns, errors, and a plethora of other data can be gathered from the CDN edge servers' access logs.
Since the volume of log data generated by high-request-rate properties can be enormous, you'll want to plan ahead and factor in the resources needed to collect and analyze it.
Formats for Log Delivery
The delivery of log data can be done in two ways. Logs are typically brought from the edge to you within five minutes.
- Log Streaming
The log streaming processor parses the logs, maps them to customer endpoints, and then broadcasts the necessary messages to those endpoints. A generic, customer-specified host or a third-party cloud log analytic solution are examples of supported customer-designed endpoints. The Log Streaming application uses HTTP or HTTPS protocols to send CDN access records. - Log File Delivery
The log file delivery processor parses the logs, maps them to specific customers, and sends the necessary files to the Origin Storage Platform's customer log file folder. W3C extended log file format is used for log files. The log data is written to your Origin Storage Platform (OSP) account using your primary alias after the service is activated for you, and it will be retained until you delete the log files.

Message Formats
JSON
Messages are either JSON messages separated by newline characters or array messages in JSON format. The following is a simple JSON example:
{
    "cached": 1,
    "referer": "http://www.test.com/some/referrer/path",
    "content-type": "application/json",
    "status": 200,
    "user-agent": "Mozilla/5.0 (Macintosh; Intel Mac OS X 10_9_5) AppleWebKit/537.36 (KHTML, like Gecko) Chrome/59.0.3071.115 Safari/537.36",
    "cs-ip": "127.75.23.245",
    "cs-method": "get",
    "cs-uri": "/test/test.gif?auth=2r32423fds",
    "cs-version": "HTTP/1.1",
    "date": "2022-01-02",
    "sc-bytes": 383,
    "time": "22:27:10",
    "time-taken": 0.01,
    "x-disid": 2124407,
    "x-headersize": 340,
    "x-tcpinfo_rcv_space": 28960,
    "x-tcpinfo_rtt": 14000,
    "x-tcpinfo_rttvar": 7000,
    "x-tcpinfo_snd_cwnd": 32,
    "x-tcwait": 245,
    "x-tdwait": 0.003
}
Each POST can send an unlimited amount of messages in a batch. When the MaxBytes/Message (in bytes) or the MaxPostInterval (in seconds) has been reached since the last HTTP POST, messages will be delivered.
If a batch contains no messages to send, the system will avoid sending on that interval and wait until the batch contains at least one message. This is done for each process, one per machine at the moment. For optimal performance, both setup parameters have default values.
W3C File
The log file format is based on the World Wide Web Consortium's W3C Extended Log File Format. Messages will be available by default after the MaxBytesPerFile threshold is reached (default set to 1 Gig) or the MaxWaitSecForFinalWrite threshold is reached (default to 15-minute duration).
# Version: 1.0
# Software: 1.0
# Fields: date time cs-ip cs-method cs-uri status sc-bytes time-taken cs(Referer) cs(User-Agent) cs(Cookie) x-disid x-headersize cached cs(Range) x-tcwait x-tcpinfo_rtt x-tcpinfo_rttvar x-tcpinfo_snd_cwnd x-tcpinfo_rcv_space x-tdwait sc(Content-Type) cs-version

2020-03-04 21:21:31.336    80.12.34.56     GET /xyz.com/files/74c064e   206     66595 0.55    -       XYZ/10.0    - 584601  1059    1 bytes=38600704-38666239 551     47240   20750 9       29200   0.000 -       HTTP/1.1

2020-03-04 21:21:09.942    77.12.34.56   GET /xyz.com/files/ff5bd902-c750 206     132136  0.00 -       XYZ/10.0    - 580701  1064    1 bytes=78774272-78905343 0       71411   9533 100     29200   0.000 -       HTTP/1.1
A Common Web Access Log
A popular format for a web access log is as follows. Also remember that you can modify the format of your logs on contemporary CDN solutions to something better suited to CDN log analysis, such as JSON, but this example will show you the type of information that is generally available in your CDN logs and explain how to analyze them:
127.0.0.1 username [19/Jan/2021:15:04:20 +0000] “GET /my_image.gif HTTP/2.0” 200 150 1289Let's split this line into its constituent parts.
- IP Address (127.0.0.1)
This is the IP address that the user used to request their data. This is useful since you'll be able to see a high number of requests coming from the same IP address, which could indicate that your website is being abused. - Name of the User (username)
Some providers will try to figure out the username by decoding the authorization header in the incoming request. A basic authentication request, for example, has the username and password encoded. If you see any suspicious activity, you may be able to link it to a specific account that you can disable. - Timestamp (19/Jan/2022:15:04:20 +0000)
This part of the log indicates when the request was sent, as the name implies. When you're seeking to render this data on a graph, this is usually one of the most important values. For example, recognizing sudden traffic increases. - Request Line (“GET /my_image.gif HTTP/2.0”)
The request line specifies the type of request and the content of the request. We can observe that an HTTP GET request was made. This indicates that the user was most likely making a request to the server. Another example is POST, which involves the user delivering data to the server. You may also check what resource was requested and which HTTP protocol version was used. - HTTP Status (200)
The HTTP status indicates whether or not your server was able to complete the request. If your HTTP status code begins with the number 2, your request was most likely successful. Anything else denotes a different condition of affairs. 4XX status codes indicate that the request was unable to be performed for any reason. For example, a missing resource or a lack of authentication, as in the usual 404 error. - Latency (150)
Latency is a crucial metric to monitor. Latency spikes indicate a slowdown for your users and can be the first indication that something is wrong. The time it takes for a request to arrive at your CDN and for a response to be sent back to the user is known as latency. - Size of the Response (1289)
The response body size is a metric that is sometimes overlooked, yet it is crucial. Excessive use of an endpoint that returns a huge response body can result in the server having to do a lot more work. Understanding the response size might help you determine the true load on your application.
CDN Logs for Performance Monitoring
So now that you know what to expect from your CDN logs, what should you be on the lookout for?
Response Time Delays (Timestamp + Latency)
If you keep track of how much traffic you're getting, you'll be able to see if something is amiss right away. You can readily track when a slowdown is occurring if you include the latency attribute in this.
Running Live Events
If you're conducting a live event on your website, or directing website visitors from a webinar or live lecture, the unexpected flood of users will put a burden on your system and the CDN you're utilizing. You can monitor latency to see if there are any slowdowns or examine how much traffic you're getting. You might also check your logs for errors to see if users have discovered a bug.
Avoid Average Latency
Averages are valuable, yet they hide vital data, such as variation. If 9 of your requests respond in 100 milliseconds but one takes ten seconds, your average latency will be around one second. As a result, we can see that averages might obscure information, requiring the use of a different metric — percentiles.
It's recommended to use the data's median, 95th, and 99th percentiles. Using the same example, our data set's median would be 100 milliseconds, the 95th would be 5545 milliseconds, and the 99th would be 9109 milliseconds. This demonstrates that, even though our data is about 100ms, we have a variance to explore.
Benefits of CDN Logs
It's tempting to think of CDN logs as nothing more than operational metrics, but they're far more valuable.
- Information Security
CDN logs can help in the detection of malicious traffic. Web scraping software, for example, will go through your web pages. You can be sure this is a scraper if you notice someone fast-moving through every page on the website from the same IP address. You should probably blacklist this IP address. - Marketing Potential
You can discover your high-traffic pages by tracking the precise resources that users are requesting. These high-traffic websites will be ideal for displaying adverts or promoting products. You may also determine where users leave your website and attempt to improve those pages. - Decrease Server Load
A CDN placed strategically can reduce server load on interconnects, public and private peers, and backbones, freeing up capacity and lowering delivery costs. Instead of dumping all of the content onto a single massive server, the content is split among several servers. - Huge Reach
Over a third of the world's population is online, implying that internet usage has grown at an exponential rate over the last 15 years. Cloud acceleration with local point of presences (POP) is provided through CDNs. Due to its global reach, any latency issues that disrupt long-distance online transactions and create poor load times will be eliminated.
Final Thoughts!!!
These CDN logs are a goldmine of helpful information that will help you better understand your users' behavior, the performance of your business, and the frequency of fraudulent requests that arrive at your website. These insights are critical for learning and expanding your service so that you may scale securely and meet your objectives.
Atatus Logs Monitoring and Management
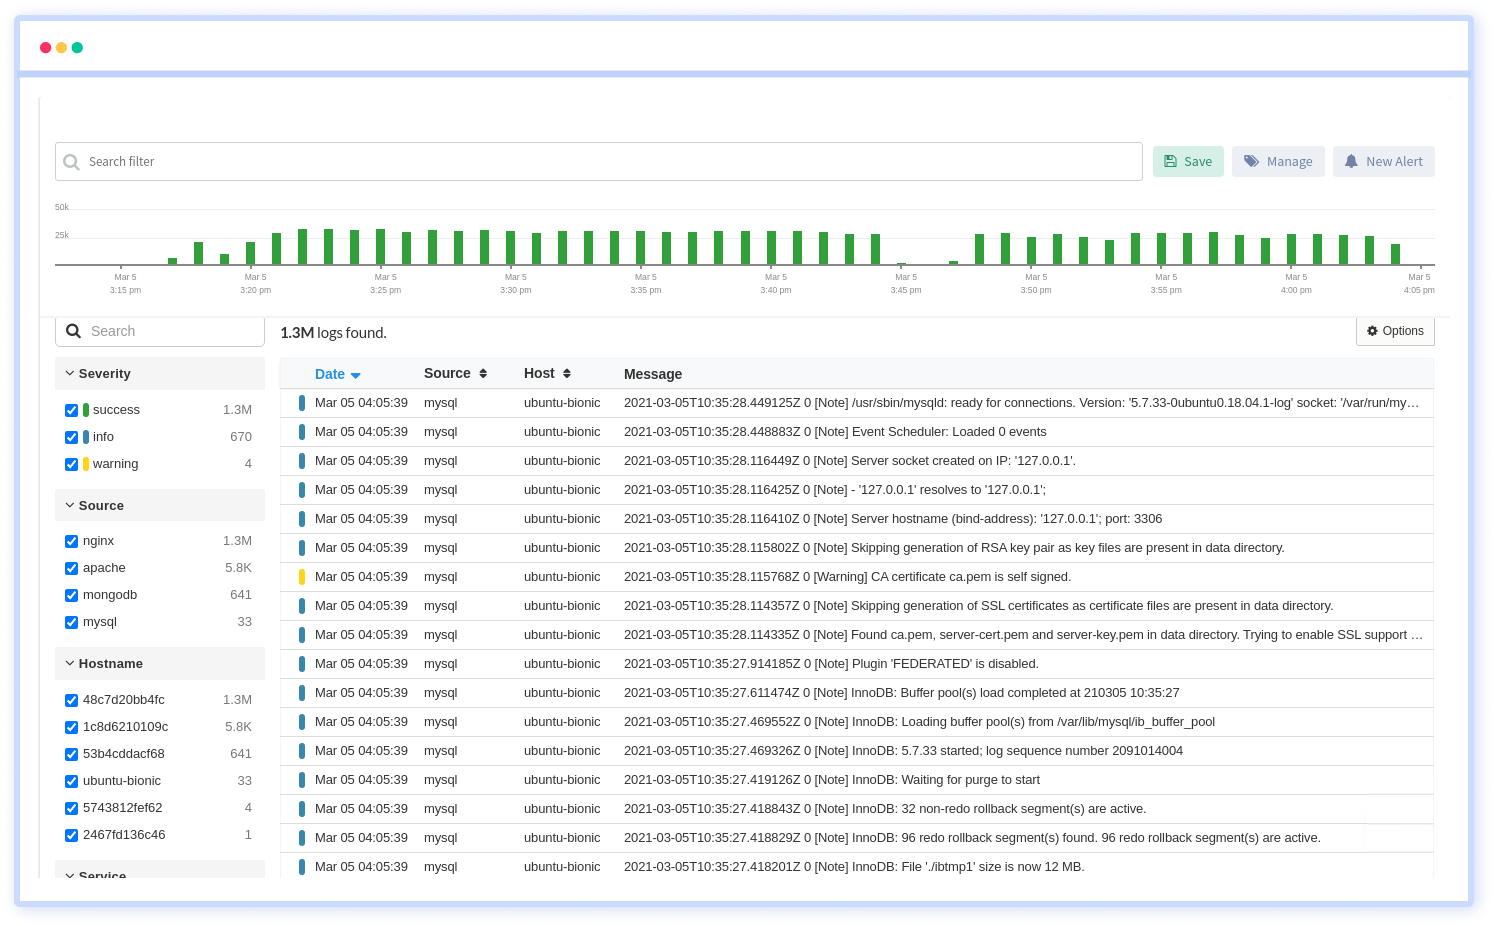
Atatus offers a Logs Monitoring solution which is delivered as a fully managed cloud service with minimal setup at any scale that requires no maintenance. It monitors logs from all of your systems and applications into a centralized and easy-to-navigate user interface, allowing you to troubleshoot faster.

We give a cost-effective, scalable method to centralized logging, so you can obtain total insight across your complex architecture. To cut through the noise and focus on the key events that matter, you can search the logs by hostname, service, source, messages, and more. When you can correlate log events with APM slow traces and errors, troubleshooting becomes easy.
#1 Solution for Logs, Traces & Metrics
APM
Kubernetes
Logs
Synthetics
RUM
Serverless
Security
More


![New Relic vs Splunk - In-depth Comparison [2025]](/blog/content/images/size/w960/2024/10/Datadog-vs-sentry--19-.png)

