How to Detect Memory Leaks in Java
One of the most important features of Java is the built-in garbage collector (GC), which automates memory management. The GC is capable of handling the majority of memory leak issues because it implicitly handles memory allocation and freeing.
While the GC is capable of handling a significant amount of memory, it does not provide a guaranteed solution to memory leaks. The GC is intelligent, but not without flaws. Even with the most attentive developer's applications, memory leaks can occur.
In Java, memory leaks are a real issue. We'll look at what causes memory leaks, how to spot them at runtime, and how to deal with them in our application.
Here’s how it is done:
- What is Memory Leak?
- Should I be Concerned About Memory Leaks?
- Types of Java Memory Leak
- How to Detect a Memory Leak in Java?
- How to Avoid Memory Leaks in Java?
- Tools for Identifying Memory Leaks in Java
What is Memory Leak?
A Memory Leak occurs when objects in the heap are no longer needed but the garbage collector is unable to remove them from memory, causing them to be kept in memory unnecessarily.
A memory leak is problematic since it eats memory resources and slows down the system over time. If this problem is not addressed, the application will eventually run out of resources, resulting in a fatal java.lang.OutOfMemoryError.
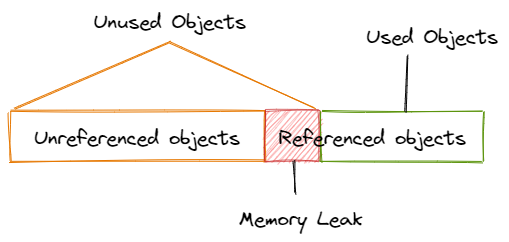
In Heap memory, there are two sorts of objects: Referenced and Unreferenced objects. Unreferenced objects do not have any active references within the application, whereas referenced objects do.
The garbage collector occasionally gathers unreferenced objects, but it never collects objects that are still referenced. Memory leaks can occur in this situation:
Symptoms of a Memory Leak
There are a few symptoms that can indicate that your Java application is experiencing memory leaks.
- When an application is continually operating for a long time, it suffers from severe performance degradation
- The application has an OutOfMemoryError heap error
- Unusual and unexpected application crashes
- Occasionally, the application runs out of connection objects
Should I be Concerned About Memory Leaks?
Small amounts of memory resources are frequently involved in memory leaks, which you might not expect to have issues with. However, if your applications throw a java.lang.OutOfMemoryError, the first and most likely suspect is a memory leak.
Memory leaks are frequently a symptom of sloppy programming. If you're the type of coder that demands perfection, you should look into every memory leak you come across. There is no way for a Java programmer to predict when a Java virtual machine will run the garbage collector.
This is true even if System.gc() is specified. When memory runs low or when available memory is less than what your program requires, the garbage collector will most likely kick in.
Your program will use memory from your operating system if the garbage collector does not free up adequate memory resources.
When compared to memory leaks in C++ and other programming languages, a Java memory leak isn't usually as serious. According to IBM developerWorks Jim Patrick, there are two aspects to consider when considering a memory leak:
- Size of the leak
- Program’s lifetime
A memory leak in a tiny Java application is unimportant if the JVM has adequate memory to run your program. Memory leaks, on the other hand, will be a problem if your Java application is continually running. This is because the software that runs indefinitely will ultimately run out of memory.
Memory leaks can also occur when a program uses a lot of temporary objects that take up a lot of memory. If these memory-hungry objects aren't de-referenced, the program will quickly run out of accessible memory.
Types of Java Memory Leak
Memory leaks can occur in any application for a variety of reasons. In this section, we'll talk about the most common ones.
1. Memory Leak Through static Fields
The extensive use of static variables is the first situation that can result in a memory leak.
Static fields in Java have a life that is usually equal to the lifetime of the running application (unless ClassLoader becomes eligible for garbage collection).
Let's make a basic Java application that fills a static List with data:
public class StaticListTest {

  public static List<Double> list = new ArrayList<Double>();

  public void populateList() {

    for (int i = 0; i < 10000000; i++) {
      list.add(Math.random());
    }

    Log.info("Point_2");
  }

  public static void main(String[] args) {
    Log.info("Point_1");
    new StaticListTest().populateList();
    Log.info("Point_3");
  }

}
If we look at the heap memory during this program's execution, we can see that it increased between Point_1 and Point_2, as expected.
However, the heap memory is not yet garbage collected when we exit the populateList() method at Point_3.
The first part until the debug point is nearly identical to what we got with static. However, because we don't have any reference to the list after leaving the populateList() method, all of its memory is garbage collected.
As a result, we must pay great attention to how we use static variables. If collections or large objects are defined as static, they will remain in memory throughout the application's lifetime, preventing crucial RAM from being used elsewhere.
2. Memory Leak Through Unclosed Resources
The JVM allocates RAM for these resources whenever we create a new connection or open a stream. Database connections, input streams, and session objects are just a few examples.
Forgetting to close these resources can cause memory to be blocked, keeping them out of GC's reach. This can also happen if a program error prevents the program from reaching the statement that handles the code to close these resources.
In either scenario, the open connection left by resources uses memory, and if we don't deal with it, performance will suffer and an OutOfMemoryError may occur.
3. Improper equals() and hashCode() Implementations
When creating new classes, it's typical to forget to provide proper override equals() and hashCode() methods.
HashSet and HashMap employ these methods in a variety of activities, and if they aren't overridden correctly, memory leaks can occur.
Let's use a simple Employee class as an example of how to utilize it as a key in a HashMap:
public class Employee {

  public String name;

  public Employee(String name) {
    this.name = name;
  }

}
Now we'll use this key to insert duplicate Employee objects into a Map.
Keep in mind that a Map cannot have duplicate keys:
@Test
public void givenMap_whenEqualsAndHashCodeNotOverridden_thenMemoryLeak() {

  Map<Employee, Integer> map = new HashMap<Employee, Integer>();

  for (int i = 0; i < 100; i++) {
    map.put(new employee("Joe"), 1);
  }

  Assert.assertFalse(map.size() == 1);
}
An Employee is key in this case. Since Map does not allow duplicate keys, the several duplicate Employee objects we've added as a key should not add to the memory use.
However, because we haven't written a proper equals() method, duplicate objects build up and take up more memory, which is why we see many instances in memory.
However, if we had properly overridden the equals() and hashCode() methods, this Map would only contain one Employee object.
Let's look at suitable equals() and hashCode() implementations for our Employee class:
public class Employee {
  public String name;

  public Employee(String name) {
    this.name = name;
  }

  @Override
  public boolean equals(Object o) {
    if (o == this) return true;

    if (!(o instanceof Employee)) {
      return false;
    }

    Employee emp = (Employee) o;
    return emp.name.equals(name);
  }

  @Override
  public int hashCode() {
    int result = 17;
    result = 31 * result + name.hashCode();
    return result;
  }
}

@Test
public void givenMap_whenEqualsAndHashCodeNotOverridden_thenMemoryLeak() {

  Map<Employee, Integer> map = new HashMap<Employee, Integer>();
  for (int i = 0; i < 2; i++) {
    map.put(new Employee("Joe"), 1);
  }
  Assert.assertTrue(map.size() == 1);
}

And in this instance, the following statements are correct:

@Test
public void givenMap_whenEqualsAndHashCodeNotOverridden_thenMemoryLeak() {

  Map<Employee, Integer> map = new HashMap<Employee, Integer>();
  for (int i = 0; i < 2; i++) {
    map.put(new Employee("Joe"), 1);
  }
  Assert.assertTrue(map.size() == 1);
}
4. Inner Classes That Reference Outer Classes
This occurs when non-static inner classes are used (anonymous classes). These inner classes always require an instance of the enclosing class to be initialized.
By default, every non-static Inner Class has an implicit reference to the containing class. If we use this inner class object in our application, it will not be trash collected even if our containing class object is no longer in scope.
This occurs because the inner class object maintains an implicit reference to the outer class object, making it a garbage collection candidate. In the case of anonymous classes, the same thing happens.
5. Memory Leak Through finalize() Methods
Another cause of potential memory leaks is the use of finalizers. When the finalize() method of a class is overridden, the objects of that class are not garbage collected immediately. Instead, the GC places them in a queue for finalization at a later time.
Furthermore, if the code written in finalize() method isn't optimized and the finalizer queue can't keep up with the Java garbage collector, our application will eventually encounter an OutOfMemoryError.
6. Memory Leak Through Interned Strings
When the Java String pool was moved from PermGen to HeapSpace in Java 7, it underwent a dramatic transformation. However, while working with huge Strings in applications running on version 6 and lower, we should be more cautious.
When we read a large gigantic String object and execute intern() on it, the object is placed in the string pool, which is located in PermGen (permanent memory) and will remain there for the duration of our application. This eats memory and results in a significant memory leak in our application.
How to Detect a Memory Leak in Java?
Memory leak detection requires the use of a variety of tools and techniques. The following are some of the most prevalent and effective methods:
Using Memory Profilers
Memory profilers are software tools that track memory utilization and help identify memory leaks in applications. Profilers can also assist in determining how resources are allocated inside an application, such as how much memory and CPU time each method uses. This can assist in identifying and narrowing down any problems.
Memory profiling in Java can be done with a variety of tools. Java VisualVM, JProfiler, and YourKit are three of the most popular.
Verbose Garbage Collection
Verbose garbage collection can be enabled to acquire a thorough trace of the Java GC. To enable verbose garbage collection, add the following argument to the JVM configuration:
-verbose:gcThe summary is shown by default in the error output, which can help you understand how memory is managed and discover any memory leaks.
Using Heap Dumps
Heap dumps are snapshots of a Java application's heap memory at a specific point in time. They tell you how many open object instances there are and how much memory they need. Heap dumps can be useful for determining how many objects are produced in an application and whether any of them are causing memory leaks.
How to Avoid Memory Leaks in Java?
You must pay attention to how you write your code to minimize memory leaks. Here are some specific strategies for preventing memory leaks.
Use Reference Objects to Avoid Memory Leaks
You can work with the garbage collector in your program by using the java.lang.ref package. This allows you to avoid accessing objects directly and instead utilize specific reference objects that are readily cleared by the garbage collector.
The specific subclasses allow you to make indirect references to objects. PhantomReference, SoftReference, and WeakReference are three subclasses of Reference.
The get method of a referent, or an object referred to by these subclasses, can be used to access it. The benefit of this method is that you can simply clear a reference by setting it to null, and the reference is almost immutable.
What is the behavior of the garbage collector with each sort of referent?

- SoftReference Object
When memory is running low, a garbage collector is necessary to delete all SoftReference objects. - WeakReference Object
When the garbage collector detects a weakly referenced object, it clears all references to it and eventually removes it from memory. - PhantomReference Object
The garbage collector is unable to automatically clear up PhantomReference objects, so you must clean up all PhantomReference objects and references manually.
You can cooperate with the garbage collector to automate the job of eliminating listeners that are only weakly reachable by using reference objects. WeakReference objects can help you avoid memory errors, especially when used in conjunction with a cleanup thread.
Avoid Memory Leaks Caused by a WebApp Classloader
You can avoid WebApp classloader pinning by using Jetty 7.6.6 or higher. Memory leaks are common when your code refers to a WebApp classloader repeatedly. In this scenario, there are two forms of leaks: Daemon threads and Static fields.
- Static Fields
These begin with the value of the classloader. The static reference persists even if Jetty stops deploying and then redeploys your web application, therefore the object cannot be cleared from memory. - Daemon threads
These are started outside of a web application's lifecycle and are prone to memory leaks because they have references to the classloader that started them.
Preventers can be used with Jetty to assist you to solve difficulties with WebApp classloaders. An application context leak preventer, such as appcontext.getappcontext(), for example, lets you preserve static references within the context classloader. You can also employ the following preventative measures:
- AWT leak preventer
- DOM leak preventer
- Driver manager leak preventer
- GC thread leak preventer
- Java2D leak preventer
- LDAP leak preventer
- Login configuration leak preventer
- Security provider leak preventer
Benchmarking
Benchmarks can be used to measure and examine the performance of Java code. This allows us to compare the results of different approaches to the same goal. This may assist us in selecting a better technique and preserving memories.
Know Best Performance Monitoring Tools for Java.
Code Reviews
Finally, there's always the old-fashioned technique of giving a short code walk-through. Even this seemingly insignificant solution can help solve some frequent memory leak issues in some circumstances.
Tools for Identifying Memory Leaks in Java
Now that you know your program has memory leaks, you can use these tools to assist you to correct them when they occur — ideally before they occur.
- GCeasy
This free tool, which is also regarded as a fantastic memory analyzer, swiftly addresses memory difficulties. It is the world's first garbage collection log analysis tool that is guided by a machine. - Eclipse MAT
This tool helps in the reduction of memory usage and the detection of memory leaks. Automatically generates reports with details about the error that prohibits the garbage collector from collecting objects. - PVS-Studio
PVS-Studio is a proprietary error-detection tool for C, C++, C#, and Java. Detects a wide range of memory leaks and other resource-related issues. - GlowCode
GlowCode is a commercial real-time performance and memory analyzer for Windows and .NET Framework. It detects memory leaks in applications built in C++, C#, or NET compatible languages that are currently running. - Deleaker
Deleaker is a proprietary standalone memory leak detecting tool that can also be used as a Visual C++ extension. It effortlessly interacts with any IDE and detects memory leaks in heaps and virtual memory.
Conclusion
Memory leaks can be thought of as a disease that wreaks havoc on our application's performance by preventing it from accessing essential memory resources. And, like any disease, if not treated, it might lead to fatal application crashes in the long run.
Memory leaks are difficult to detect, and locating them requires a thorough understanding and command of the Java programming language. There is no one-size-fits-all solution for memory leaks because they might arise as a result of a variety of circumstances.
We can reduce the danger of memory leaks in our application by following best practices and performing thorough code walk-throughs and profiling regularly.
Monitor Your Java Applications with Atatus
Atatus keeps track of your Java application to give you a complete picture of your clients' end-user experience. You can determine the source of delayed response times, database queries, and other issues by identifying backend performance bottlenecks for each API request.
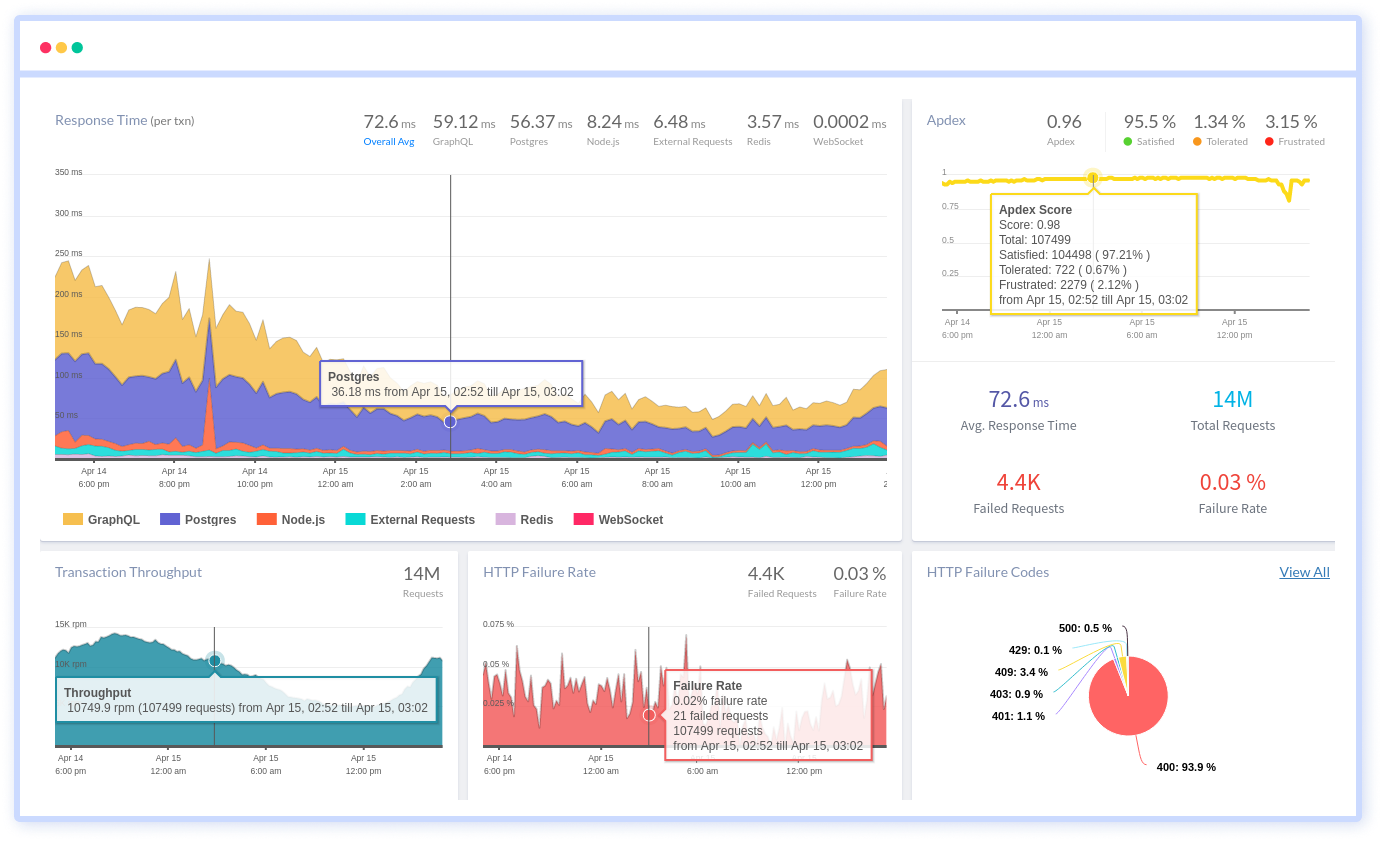
To make bug fixing easier, every Java error is captured with a full stack trace and the specific line of source code marked. To assist you in resolving the Java error, look at the user activities, console logs, and all Java requests that occurred at the moment. Error and exception alerts can be sent by email, Slack, PagerDuty, or webhooks.
#1 Solution for Logs, Traces & Metrics
![]() APM
APM
![]() Kubernetes
Kubernetes
![]() Logs
Logs
![]() Synthetics
Synthetics
![]() RUM
RUM
![]() Serverless
Serverless
![]() Security
Security
![]() More
More