15 Best JavaScript Chart Libraries in 2024
The need to show data as a chart or table has become more critical for every organization as data gathering has increased. To produce a dashboard and charts that everyone can understand, developers must mix many database records. However, since the introduction of chart libraries, data visualization has improved. Interactive charts are now available through libraries and plugins.
To make things easier for you, we have sifted through a variety of options to identify the best JavaScript Charting Library for your requirements.
We will go over the following:
- Chart.js
- FusionCharts
- Dygraphs
- Victory
- Chartist.js
- D3.js
- Recharts
- AmCharts
- Google Charts
- AnyChart
- Highcharts
- Billboard.js
- ApexCharts.js
- NVD3
- Vis.js
#1 Chart.js
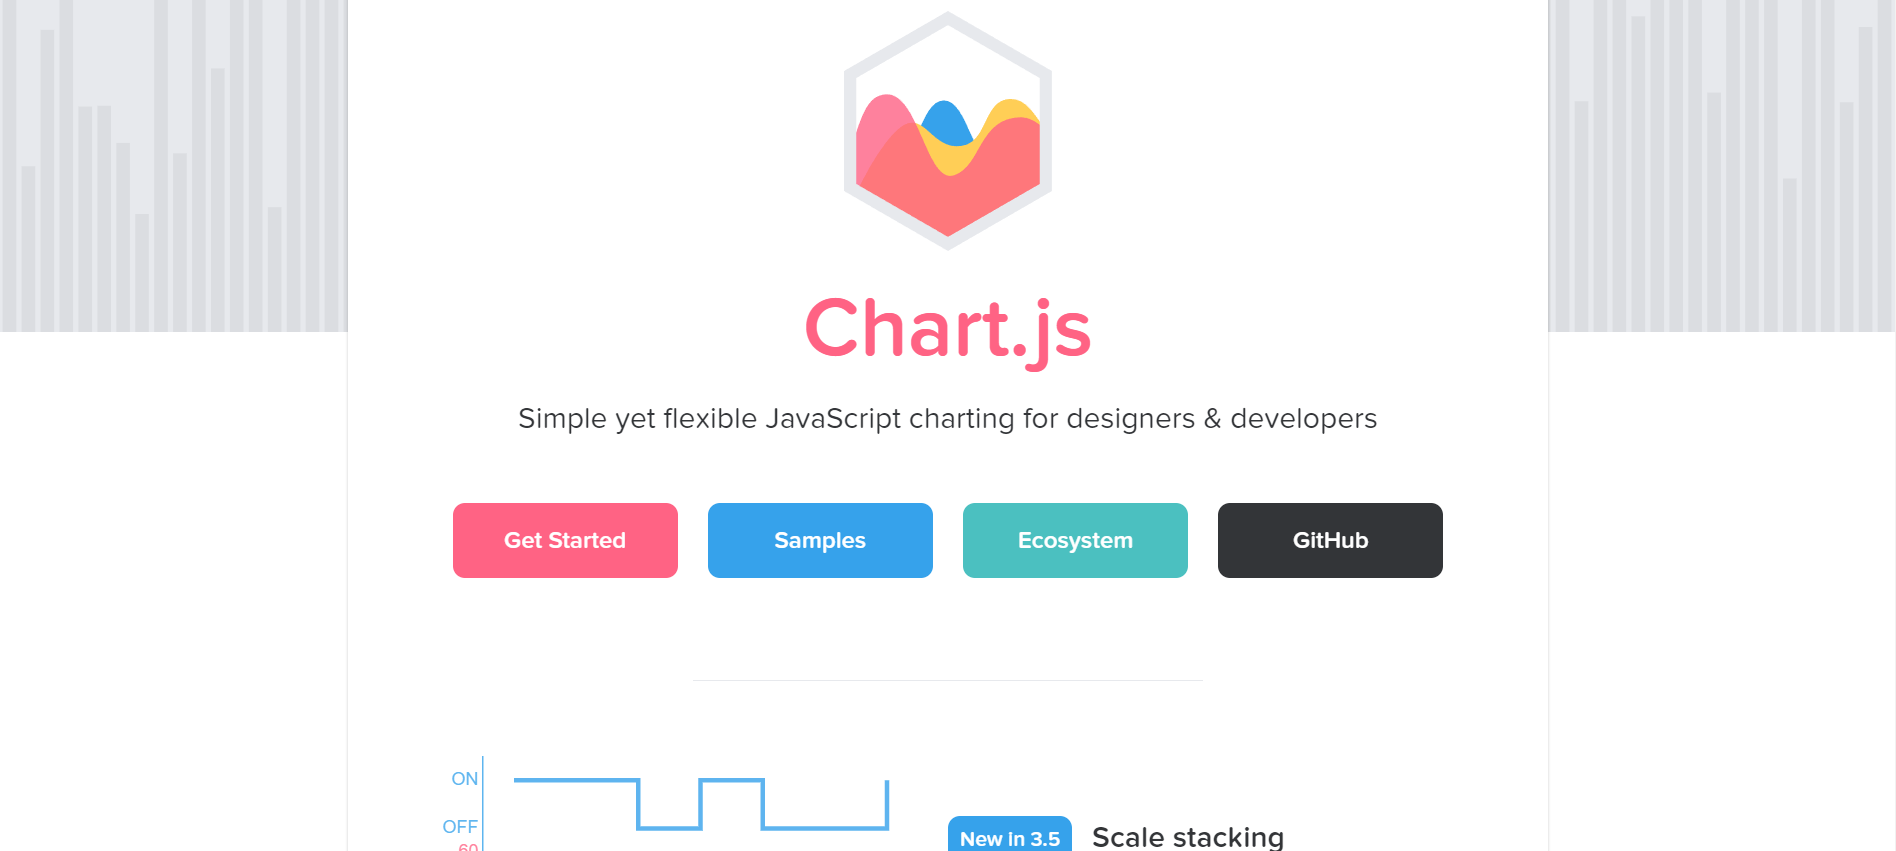
Chart.js is an open-source JavaScript library that supports eight different types of charts. It's only 60kb in size, thus it's a rather small JS library. Radar, inline charts, pie charts, bar charts, scatter plots, area charts, bubble charts, and mixed charts are all provided. The samples are fairly modern in appearance, and they feature the first animations when drawing for the first time. Time series are also supported. It uses the canvas element for rendering, and it is sensitive to window resizing to preserve scale granularity. It is backward compatible with Internet Explorer 9. Polyfills are also available to work with IE7.
Features:
- All chart types can be altered and animated, and all charts are responsive when used online
- Plugins can be used to increase the functionality of the system
- The documentation is excellent
- IE9+ is supported by most browsers
Chart Availability:
- Bar
- Line
- Pie
- Donut
- Bubble
- Area
- Scatter
- Radar
Pricing:
Free
#2 FusionCharts
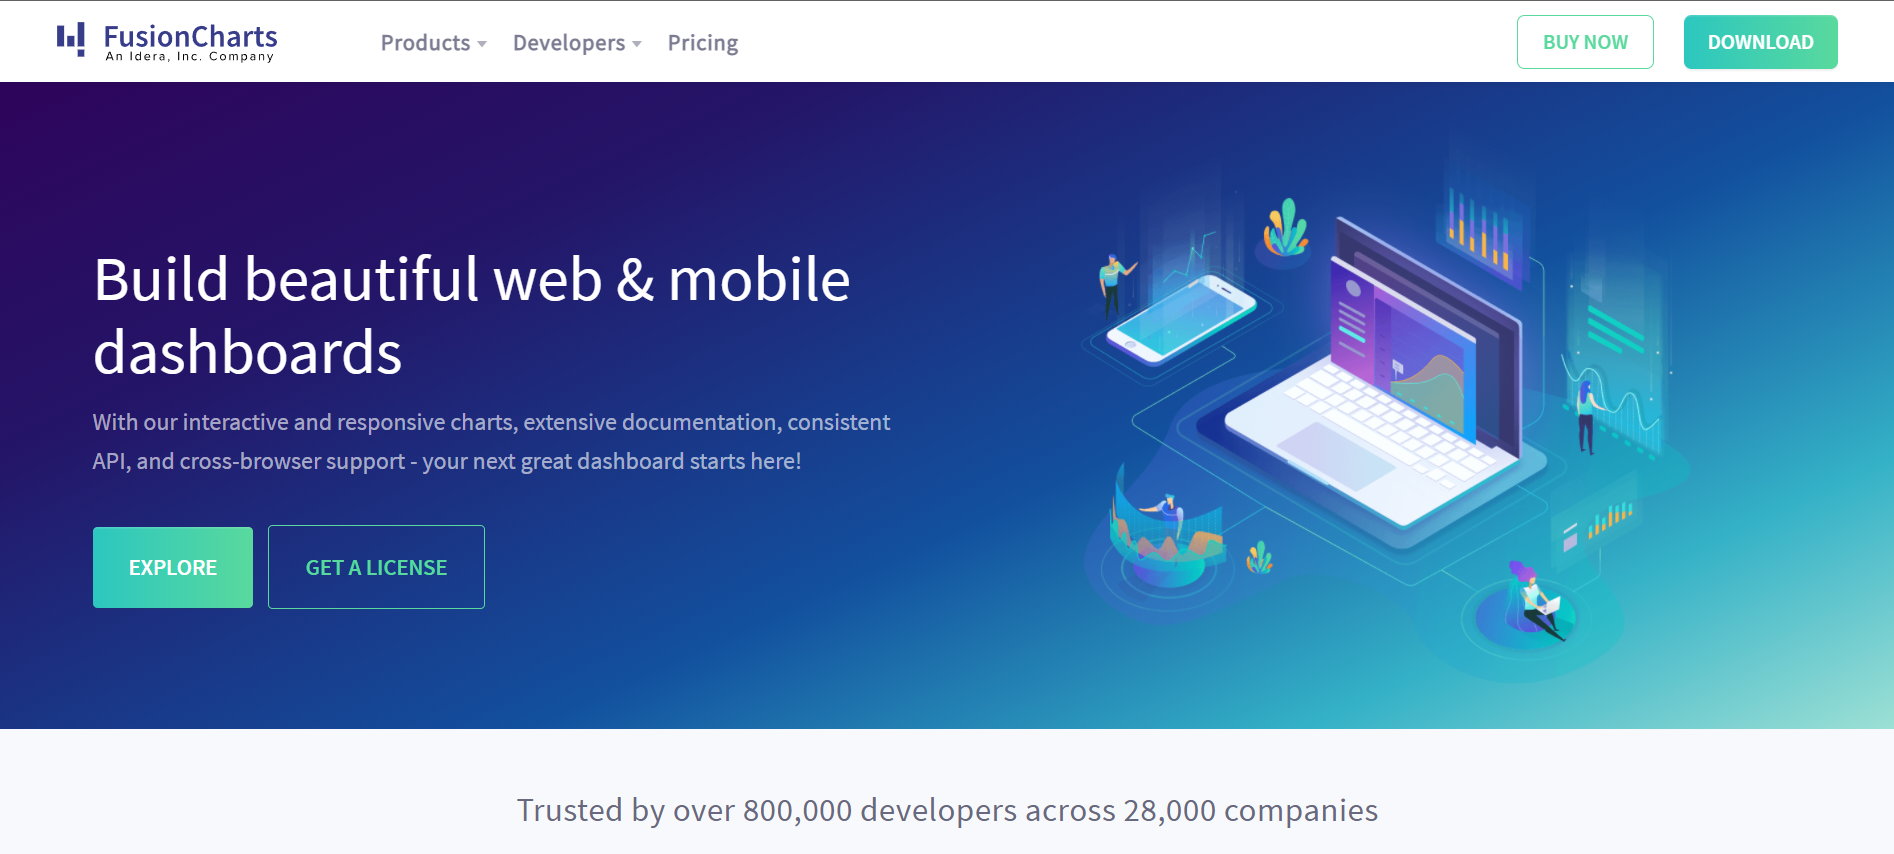
FusionCharts is the most complete JavaScript library on the market, with over 90 chart options and 900 maps that are ready to use right now. They claim to have the best-looking charts in the industry, and they back it up with a robust reporting experience via dashboards. That provides a birds-eye perspective of all business activities.
FusionCharts is compatible with a wide range of devices, including PCs, Macs, iPhones, and Android tablets, and they go above and beyond to ensure cross-browser compatibility, including IE6.
Features:
- There are dozens of chart options in 2D and 3D, as well as 950+ maps covering every continent
- Charts and maps that are animated and fully interactive
- ASP.NET, PHP, and Ruby on Rails server-side APIs
- jQuery, Angular, PHP, ASP.NET, React Native, Django, React, Ruby on Rails, Java, and others are all supported
- The user's handbook and API reference are both quite comprehensive
- There are several samples and dashboards to look at
- Support for older browsers is available
- PNG, JPG, or PDF files can be exported
- Support is available in the form of a knowledge base and a community forum
- License holders get unrestricted access to priority support
Chart Availability:
- Bar
- Column
- Line
- Area
- Pie
- Treemaps
- Heatmaps
- Gantt Charts
- Marimekko Charts
- Gauges
- Spider Charts
- Waterfall Charts
Pricing:
The plan starts from $499/year.
#3 Dygraphs
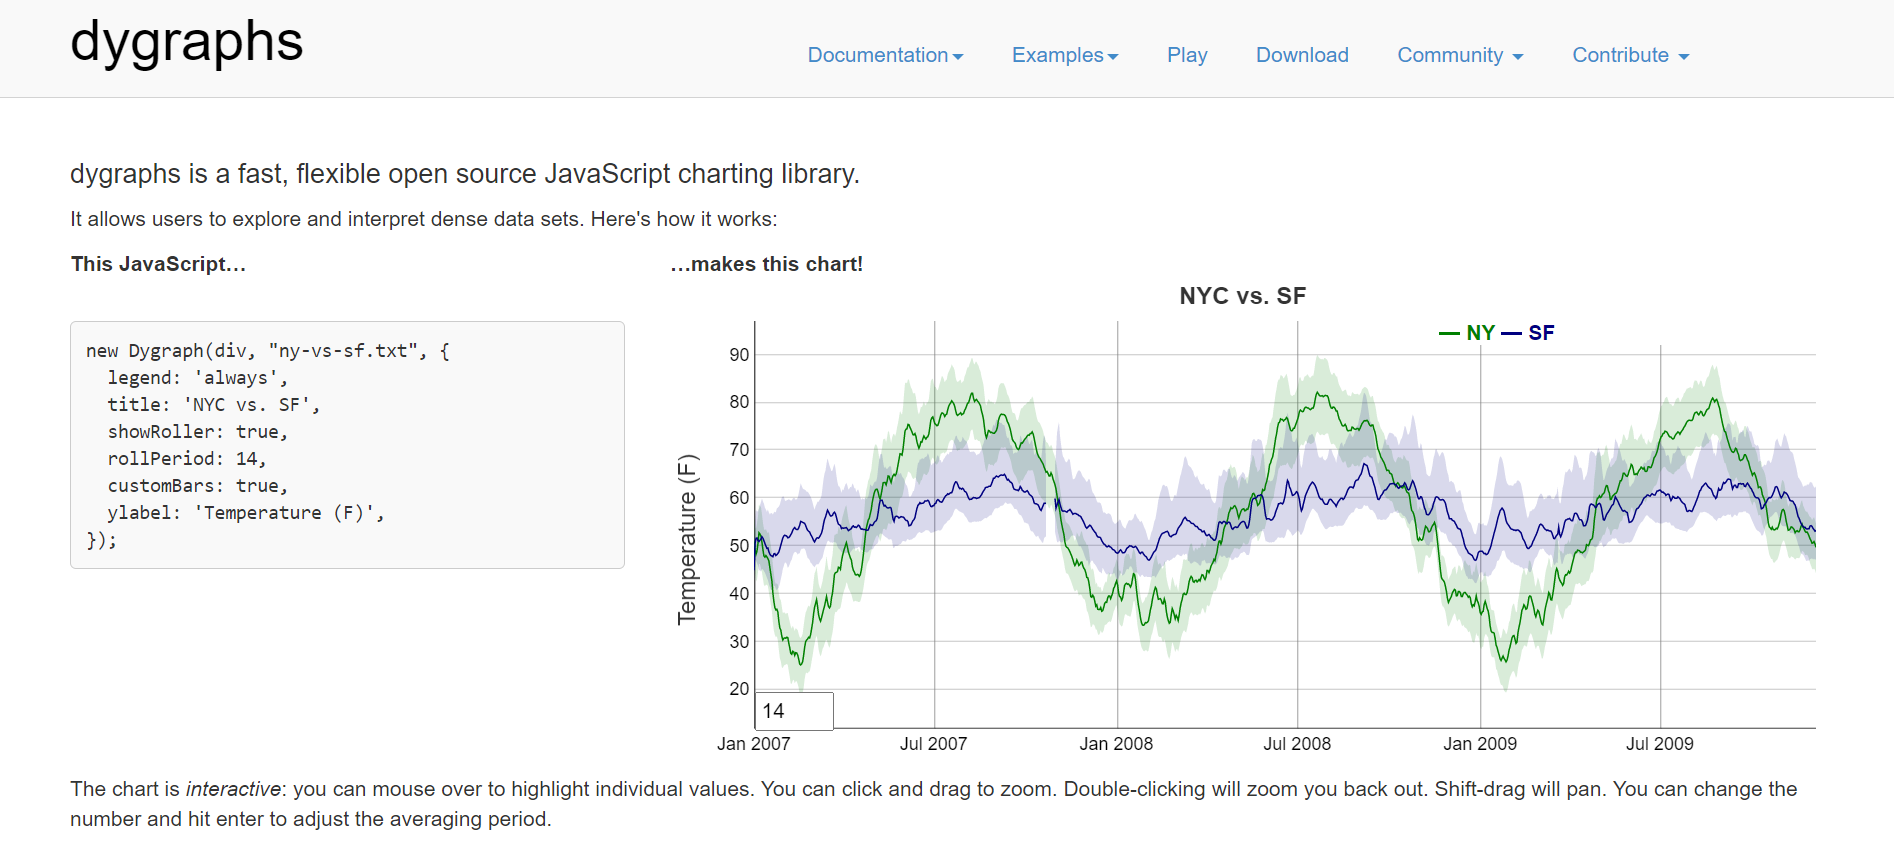
Dygraphs is an open-source library that is regarded as one of the industry's quickest chart rendering libraries. It can work with a large amount of data with ease. Data analysts can handle large data sets and provide an excellent user experience by using this JavaScript library. This library is capable of handling data sets in the tens of thousands while still providing an excellent user experience.
Features:
- Synchronization of many charts
- At that Range/Viewfinder, there are annotations and extremely customizable annotations
- It's very simple to get started
- It's ideal for displaying data in real-time
- Datapoint feedback is extremely fast, and data is displayed off-chart.
- Zoom in and out capabilities
- There are numerous samples with links to JSFiddles
- Data manipulation is simple with basic arrays, or data may be loaded from text or CSV files
Chart Availability:
- Line
- Multiline
Pricing:
Free
#4 Victory
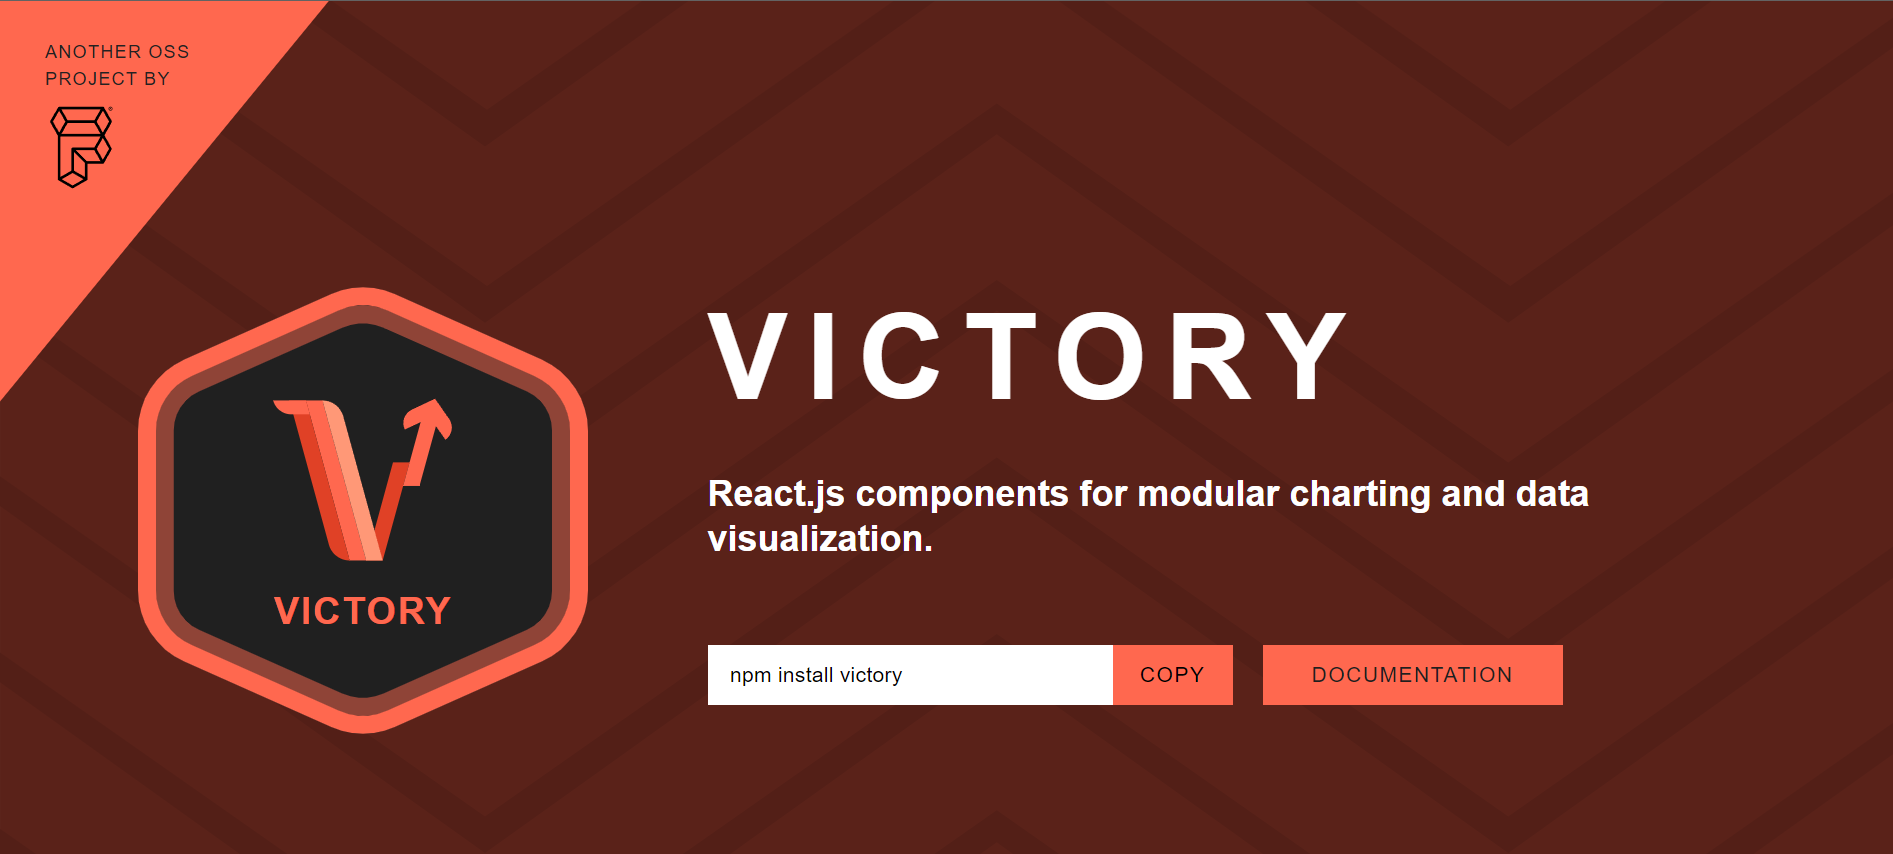
Victory does an excellent behavior of laying out the foundations for creating a chart. Customizing axes, labels, and passing in several data sets for a single graph is all rather simple, and adjusting style options and behavior is simple and intuitive. It's very effective, open-source and it allows you to create some nice-looking charts with very little code. It's worth a look if you're looking for cross-platform software.
Features:
- Easy to use components for complicated charting
- Self-contained and reusable data visualization modules are in charge of their style options and behaviors
- The Android and iOS systems have the same API
Chart Availability:
- Line
- Graph
- Pie
- Area Hover Styles
- Radar Chart
- Polar Cardioid
- Stream Graph
- Staked Histogram
Pricing:
Free
#5 Chartist.js
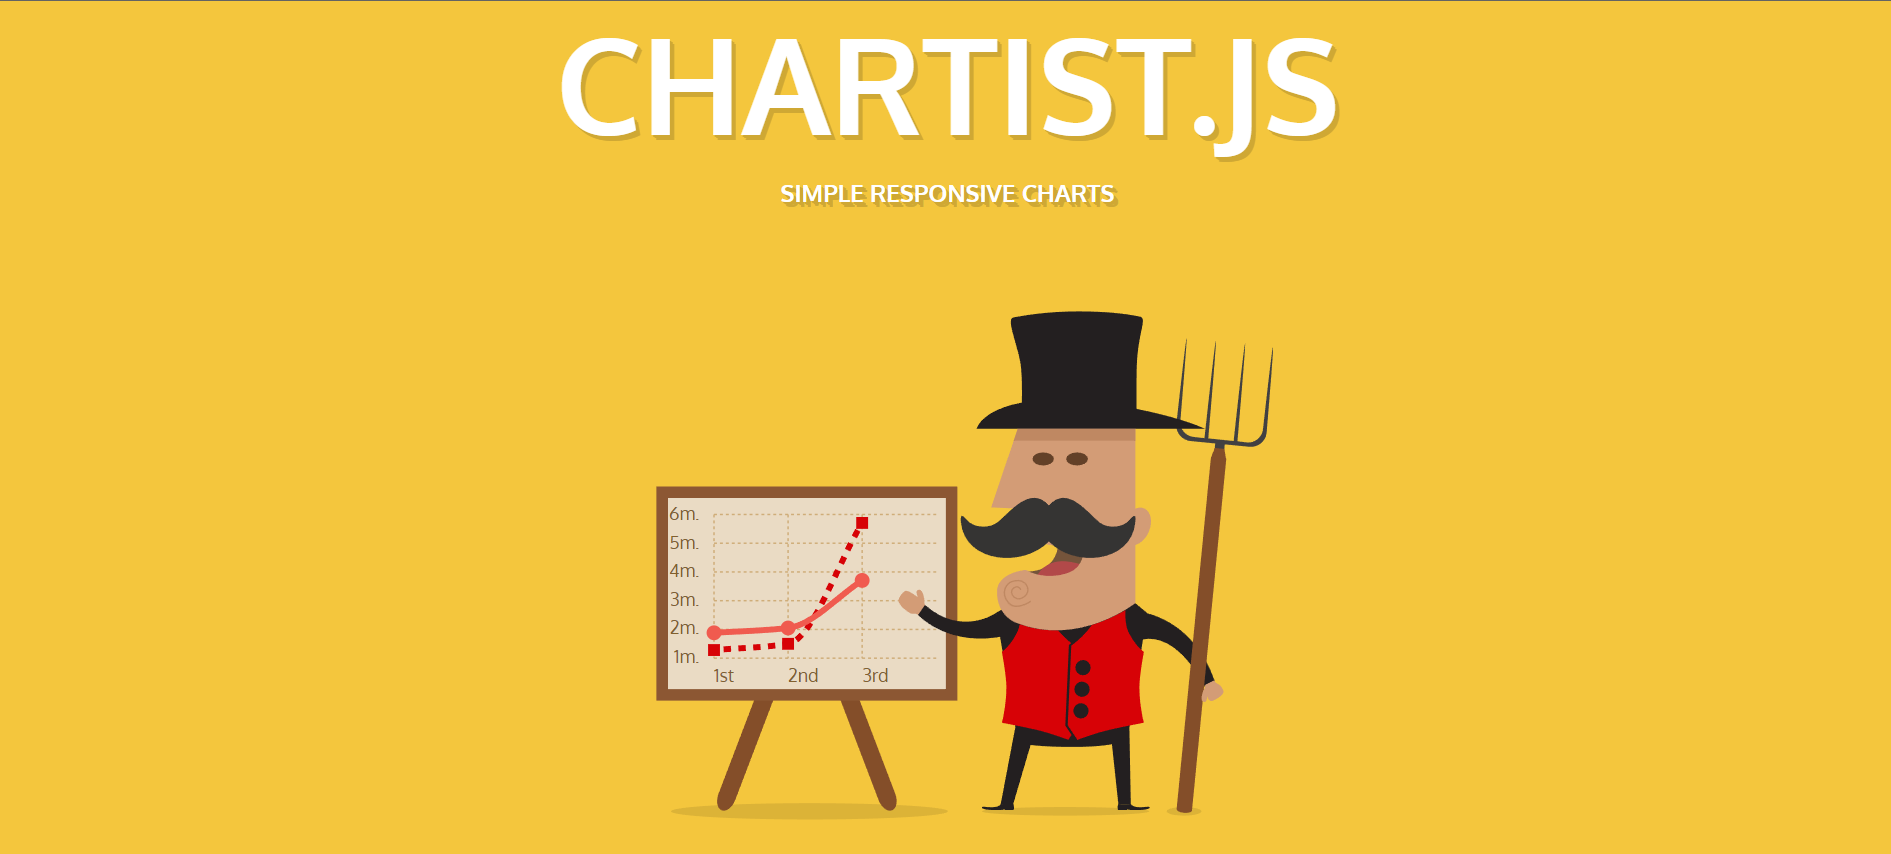
Chartist.js is a cutting-edge SVG library. The SVG animations in the charts created with this library are its most notable feature. It has a strong technological foundation, is open-source, and is simple to execute. You can create an exceptionally impressive graphic that interacts with any backend data source in minutes. Chartist is extremely simple to set up, as well as to customize using Sass.
Features:
- Fantastic animation
- Although API documentation offers all important information, it is inconvenient to explore, requiring extensive scrolls
- Plugins can be used to increase the capabilities
- The charts are drawn using SVG
- Support for older browsers is available
Chart Availability:
- Line
- Bar
- Pie
Pricing:
Free
#6 D3.js
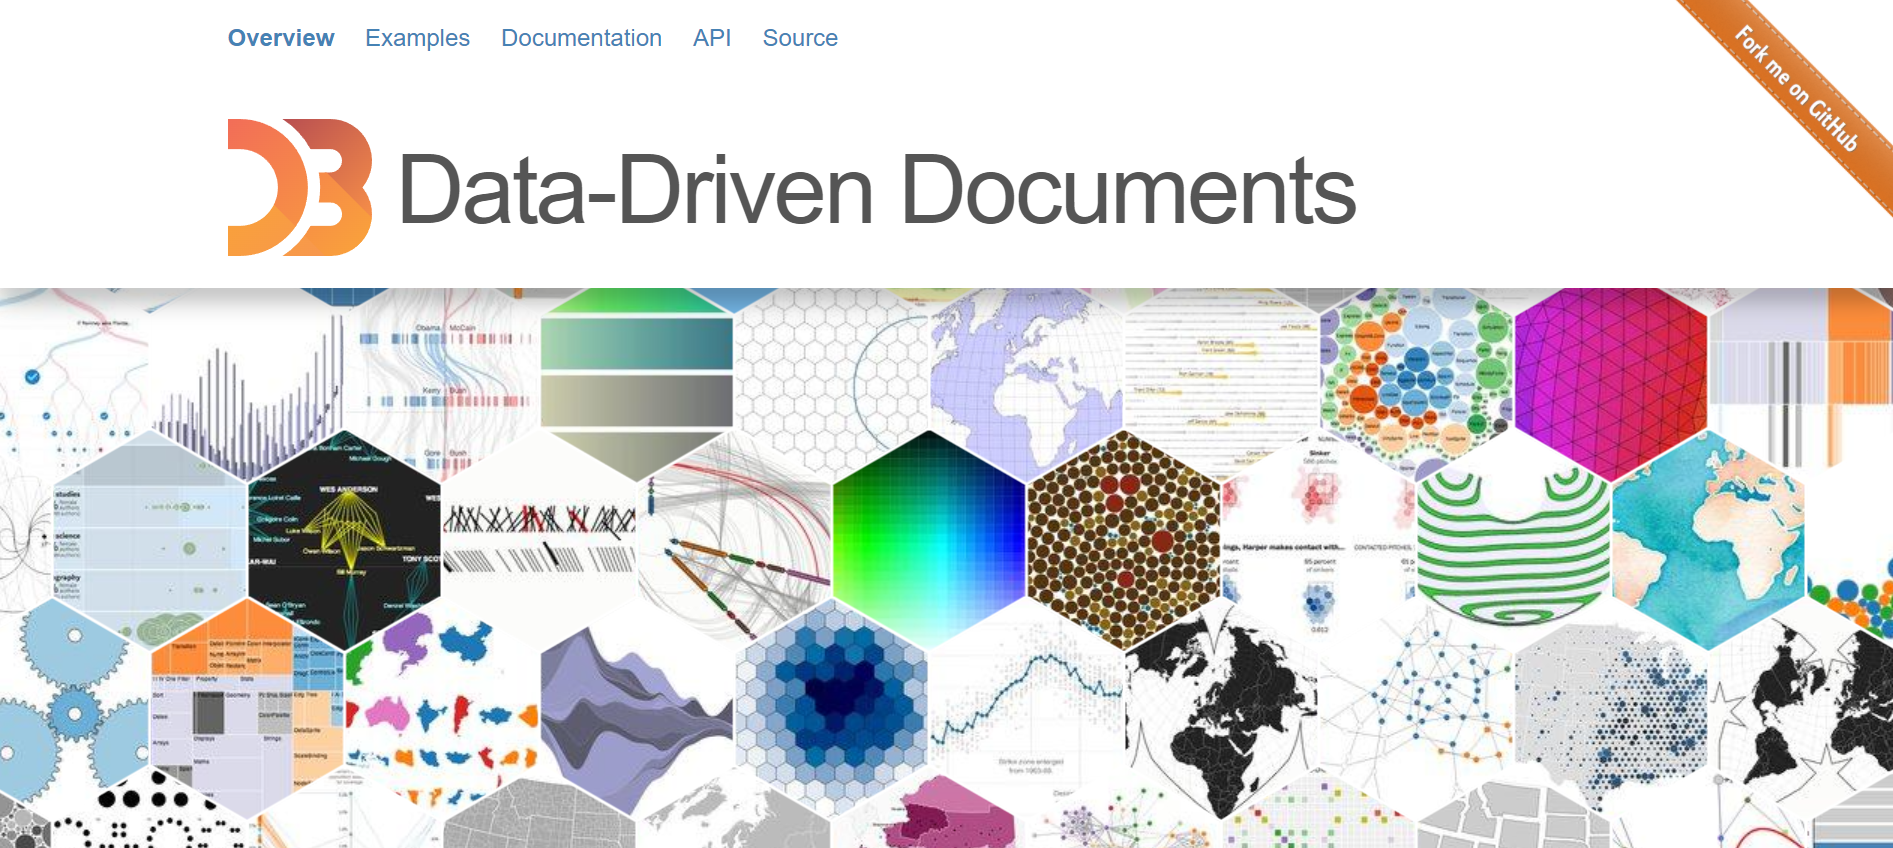
D3.js is a robust open-source JavaScript data visualization framework. D3 is more similar to a framework than a library. It may not be easy to work with, which can appear to be a major issue at first. However, there are a plethora of useful information sites available. Finally, you can create amazing visualizations and visuals of any kind from scratch, making D3 well worth your time.
Features:
- Supports a far larger number of chart options than the vast majority of existing JavaScript charting frameworks
- The learning curve is steep
- A data-driven approach to DOM manipulation is combined with sophisticated visualization components
- Using the in-browser element inspector to debug is simple
- Hundreds of samples are available
- Functions that generate curves
- Drag and drop feature
Chart Availability:
- Bar
- Circle
- Pie
- Donut
- Line
- Bubble
Pricing:
Free
#7 Recharts
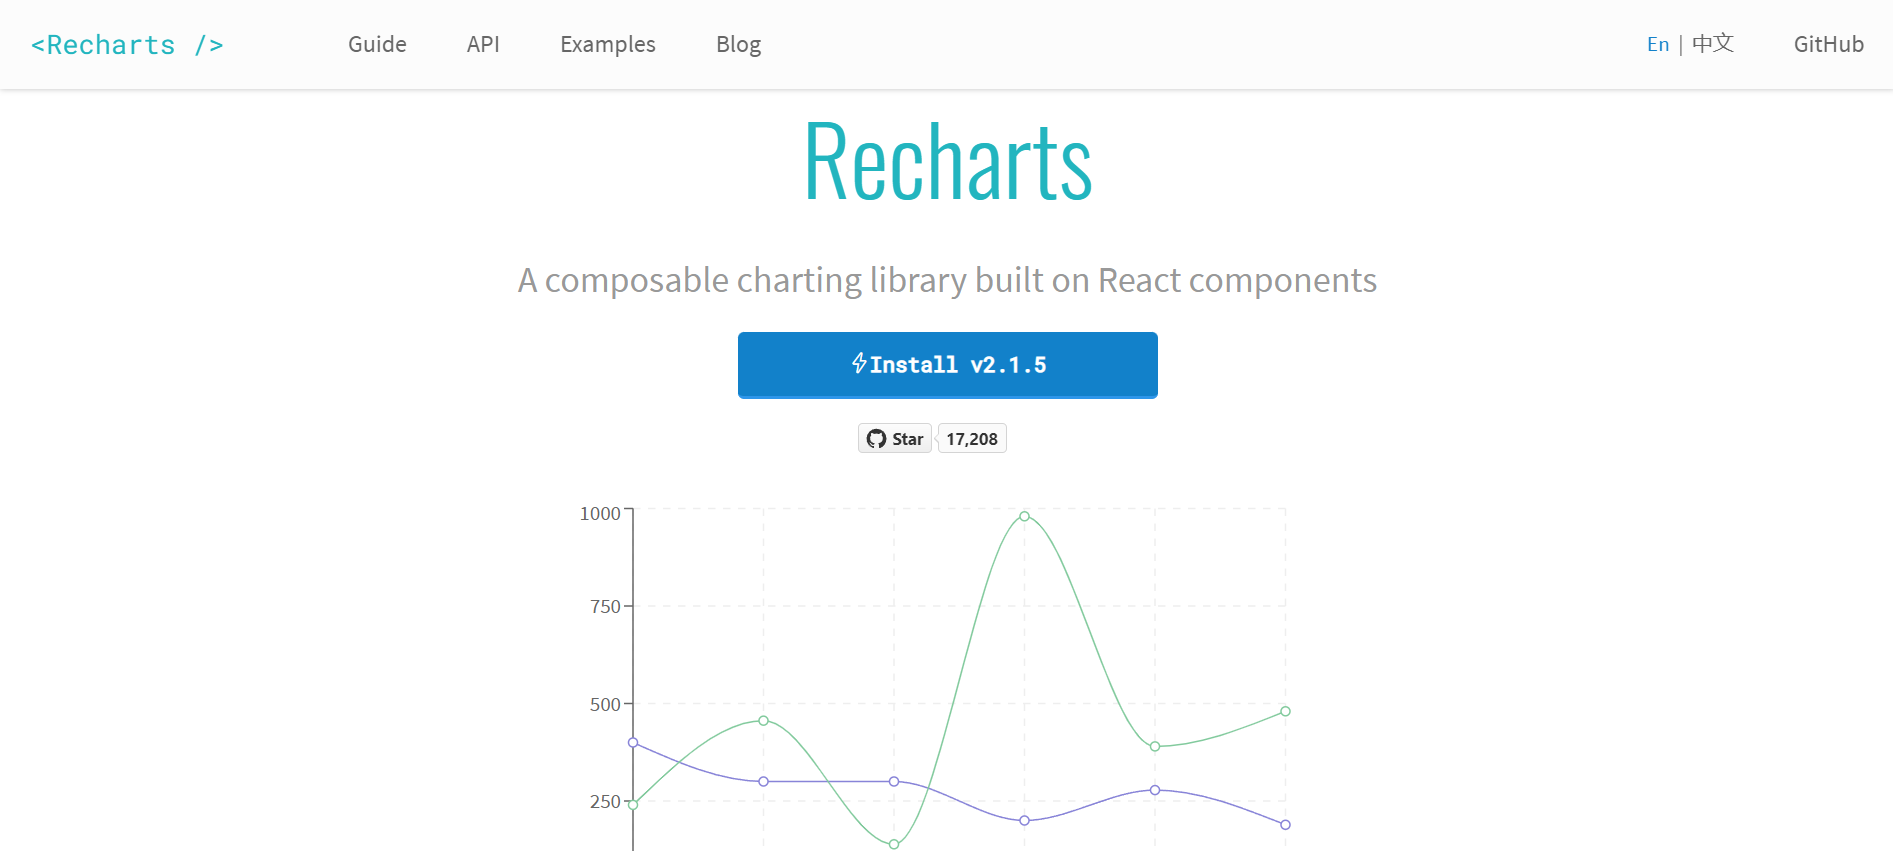
Recharts expose declarative components and use D3 beneath the hood. It's open-source, lightweight, and renders SVG components to produce stunning, interactive charts. It's simple to use, and the documentation is entertaining.
It has built-in general chart options such as legend tooltips and labels, and it performs well with static charts. When dealing with numerous animated charts on the same page and large datasets, it can be sluggish, but it will suffice in most circumstances.
Features:
- Easily create charts with React components that are reusable
- It's constructed on top of SVG elements and is light-dependent on D3 submodules
- Customize your chart by adjusting component properties and adding custom components
- Includes several useful examples
Chart Availability:
- Line
- Bar
- Pie
- Area chart
Pricing:
Free
#8 AmCharts
AmCharts is a large library with a variety of chart options that allow users to customize their data display. It's a premium library with a freemium model. The maps and charts can be used by anybody to visualize and analyze data. However, there are a few prominent characteristics that can be charged.
Features:
- Fantastic animations
- Capability to create a pictorial chart
- Customizable to the max
- Both TypeScript/ES6 and Vanilla JS examples are provided
- Great documentation
- Nesting charts within a pie chart or a bar chart are possible
Chart Availability:
- Bar
- Pie
- Annotation
- Donut
- Line
- Bubble
- Area
- Funnel
- Pyramid
- Marimekko
- Candlestick
- Scatter
- Gauge
- Gant
- TreeMap
- Spark
- Bullet
- Heat
- Radar
Pricing:
The plan starts from $90.
#9 Google Charts
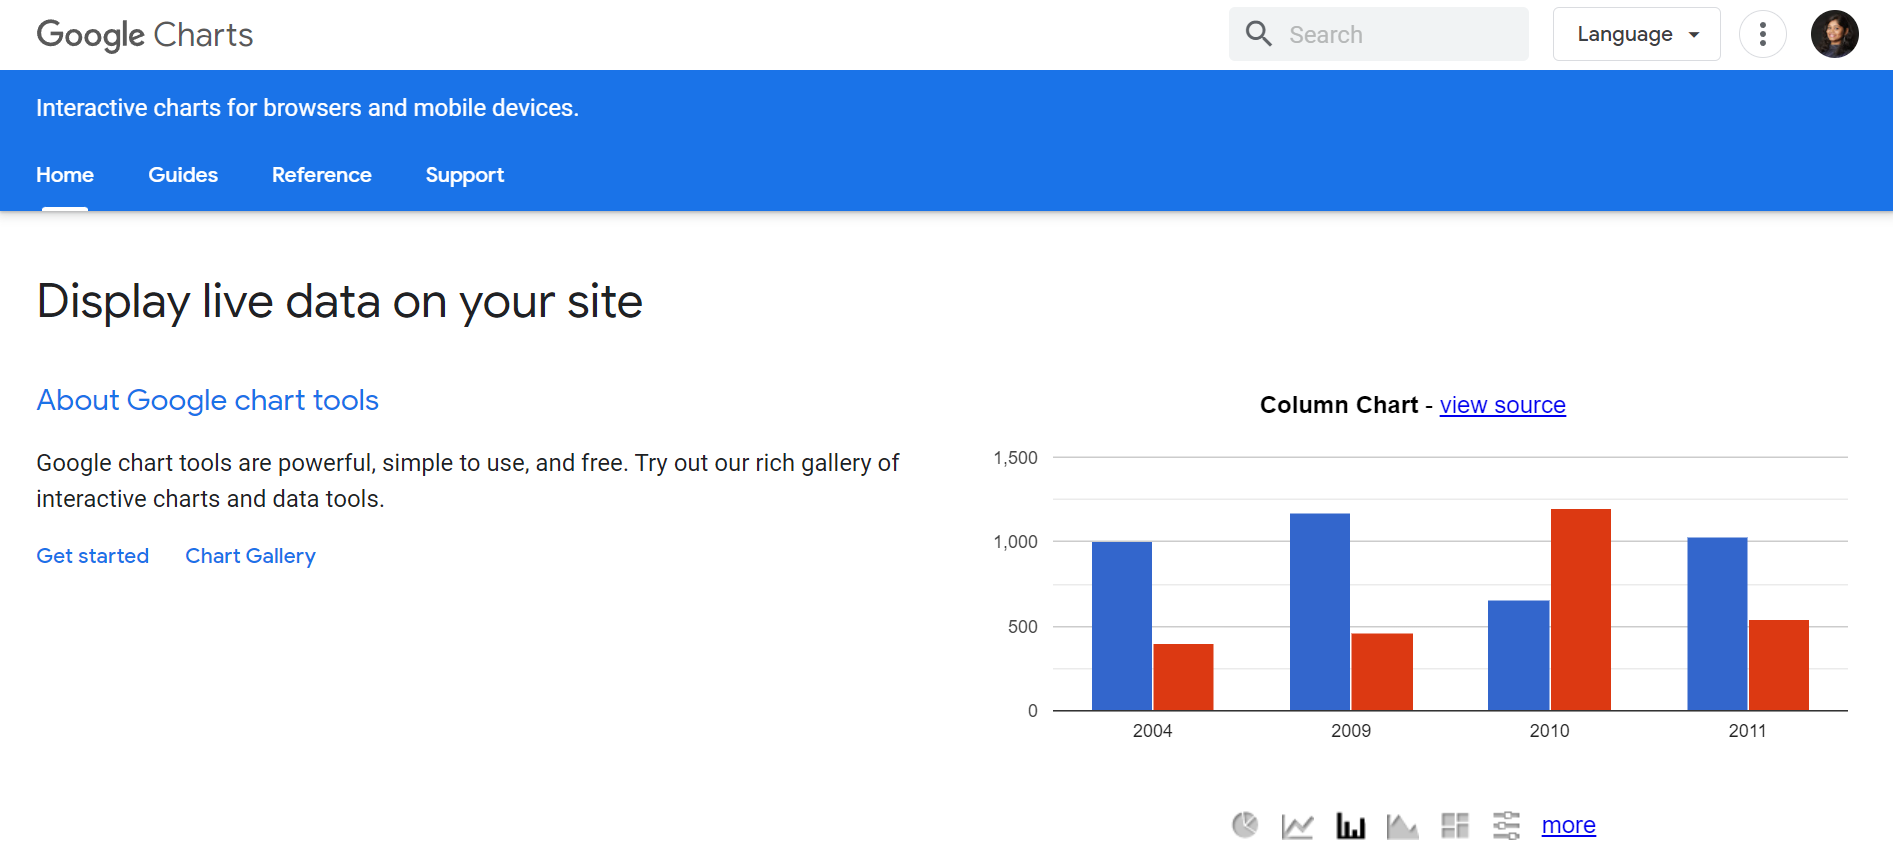
Google Charts is a charting package that has been around for a long time and is widely used. It comes with a wealth of documentation and is pre-sampled to help you get started. Furthermore, Google Charts have a semi-modern design that allows for immediate visual realization and has a preset color scheme.
Features:
- Most of the features are free to use
- Tooltips
- Extensive user documentation with samples
- Annotations
- Visual chart gauges that work best
- The charts can be enlarged
Chart Availability:
- Bar
- Line
- Pie
- Donut
- Annotation
- Area
- Bubble
- Scatter
- Gant
- Candlestick
- Map
- Gauge
- Bullet
- TreeMap
Pricing:
Free
#10 AnyChart
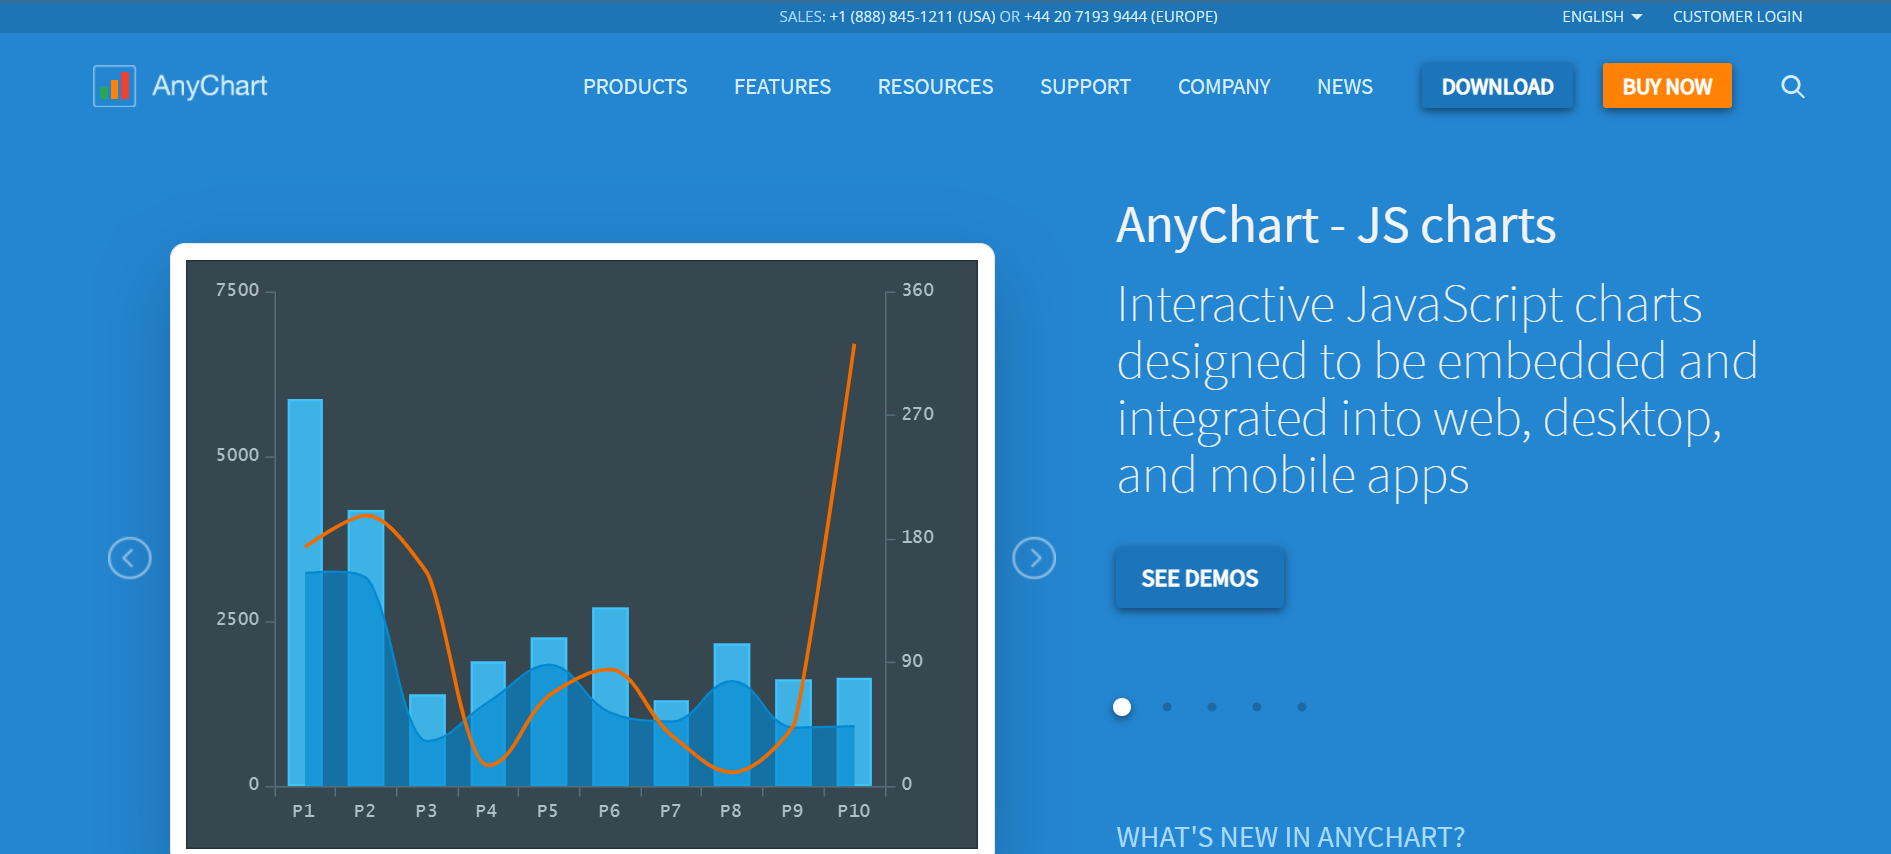
AnyChart is a feature-rich, lightweight, and robust JS chart library that renders in SVG/VML. It provides web developers with a fantastic opportunity to design various charts that will aid in data analysis and data-driven decision-making. Android, Angular, Elasticsearch, iOS, Qlik, Oracle APEX, React, Vue.js, and others can all be integrated. There are numerous samples and dashboards available, as well as a dedicated playground with code autocompletion.
Features:
- Drill down into the data in the chart
- Out-of-the-box stock technical analysis indicators and annotations
- Rich documentation, API, and helpful customer service
- Support for older browsers is available
- Charts can be exported to PDF, JPG, PNG, or SVG graphics, as well as chart data in XSLX or CSV files
Chart Availability:
- Bar
- Pie
- Graph
- Line
- Stock Charts
- Maps
- Gantt
- PERT charts
Pricing:
The plan starts from $49/product.
#11 Highcharts
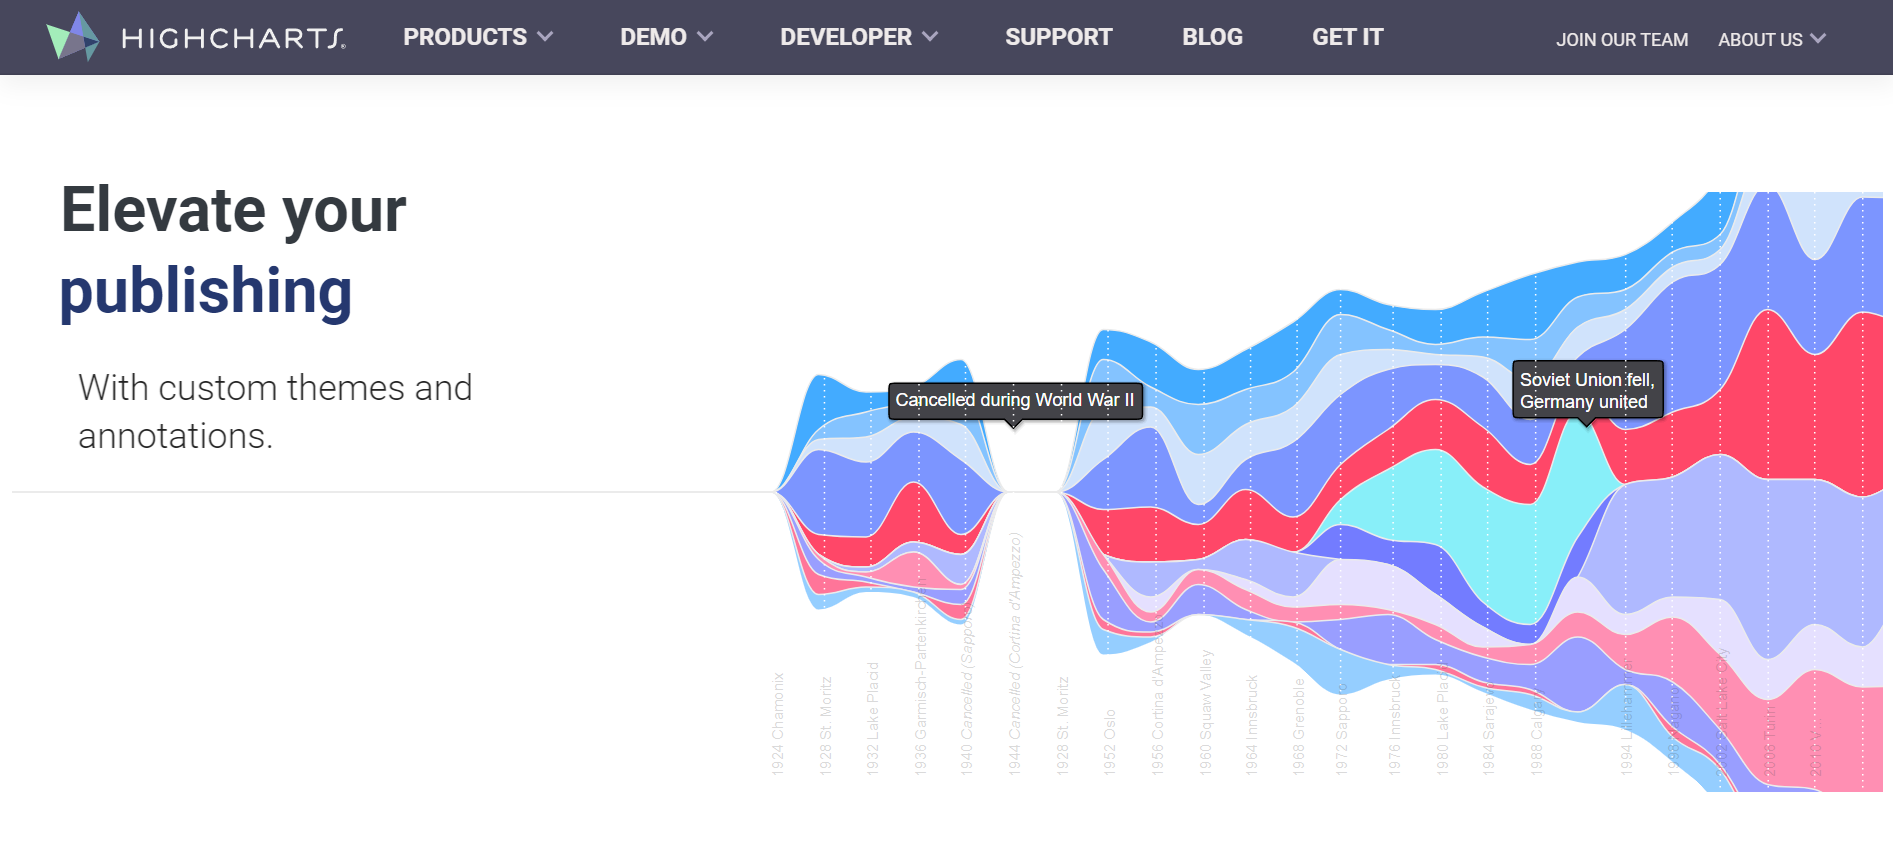
Highcharts is a popular JavaScript charting library that is used by many large companies. Charts are created using SVG and then converted to VML for backward compatibility from IE6 to IE8. The demo charts have several great capabilities, but they aren't visually appealing. The API documentation tutorials may be found here, as well as many other important topics in the general documentation.
Features:
- It's written entirely in JavaScript, and data may be loaded from anywhere
- Thorough documentation, an API reference, and a community showcase
- Drill down into the chart data and other options for interaction
- It works with React, Angular, Meteor, .NET, iOS, and more frameworks
- PNG, JPG, PDF, and SVG files can all be exported
- with premium email and Skype support provided only to commercial users with the required license
Chart Availability:
- Line
- Area
- Bar
- Pie
- Donut
- Scatter and bubble
- Combinations
- 3D charts
- Gauges
- Heat and treemaps
Pricing:
The plan starts from $535/year.
#12 Billboard.js
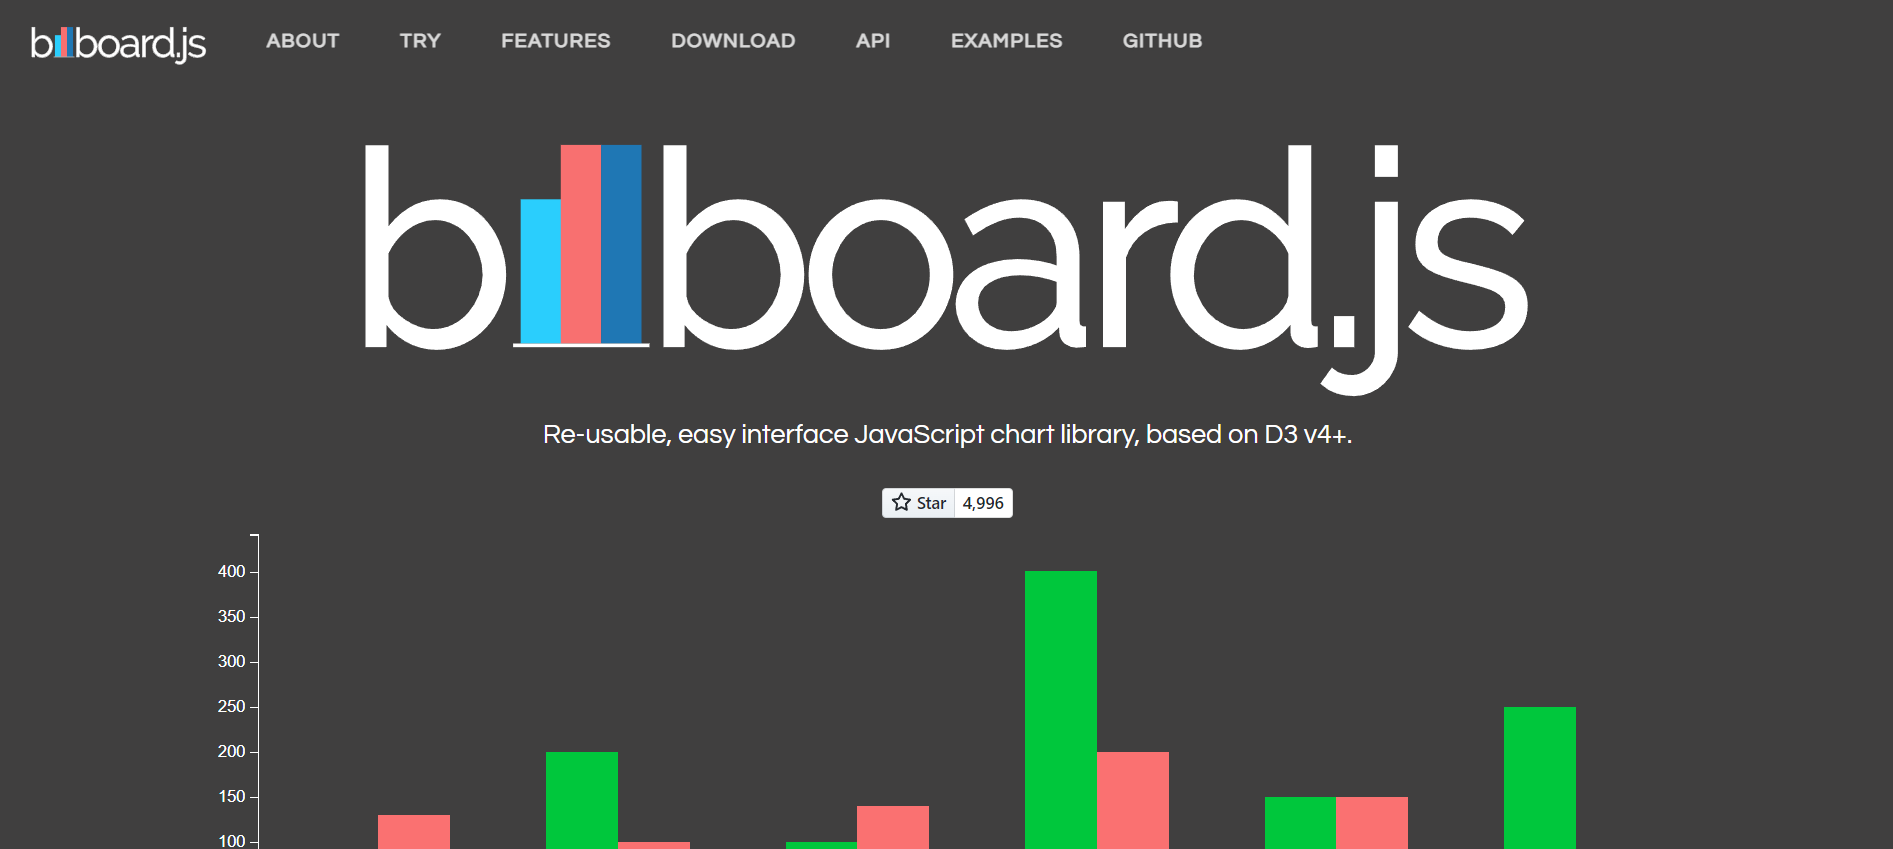
Billboard.js is an open-source that is the fairly basic package that comes with a solid variety of charts that help businesses see data. This package is comparable to c3.js charts and is based on D3 version 4. Aside from that, Billboard is a library with a stacked list of charts that any organization may use, as well as a variety of configurable components like axes, legends, and tooltips.
Features:
- Customization options abound
- Y-lines with labels were easily inserted
- Completely adaptable
- Viewfinder zoom includes zoom, sub-charts, and drag zoom
- Tooltips, as well as a dual chart linked to tooltips
Chart Availability:
- Bar
- Line
- Donut
- Pie
- Bubble
- Area
- Gauge
- Scatter
- Radar
- TreeMap
Pricing:
Free
#13 ApexCharts.js
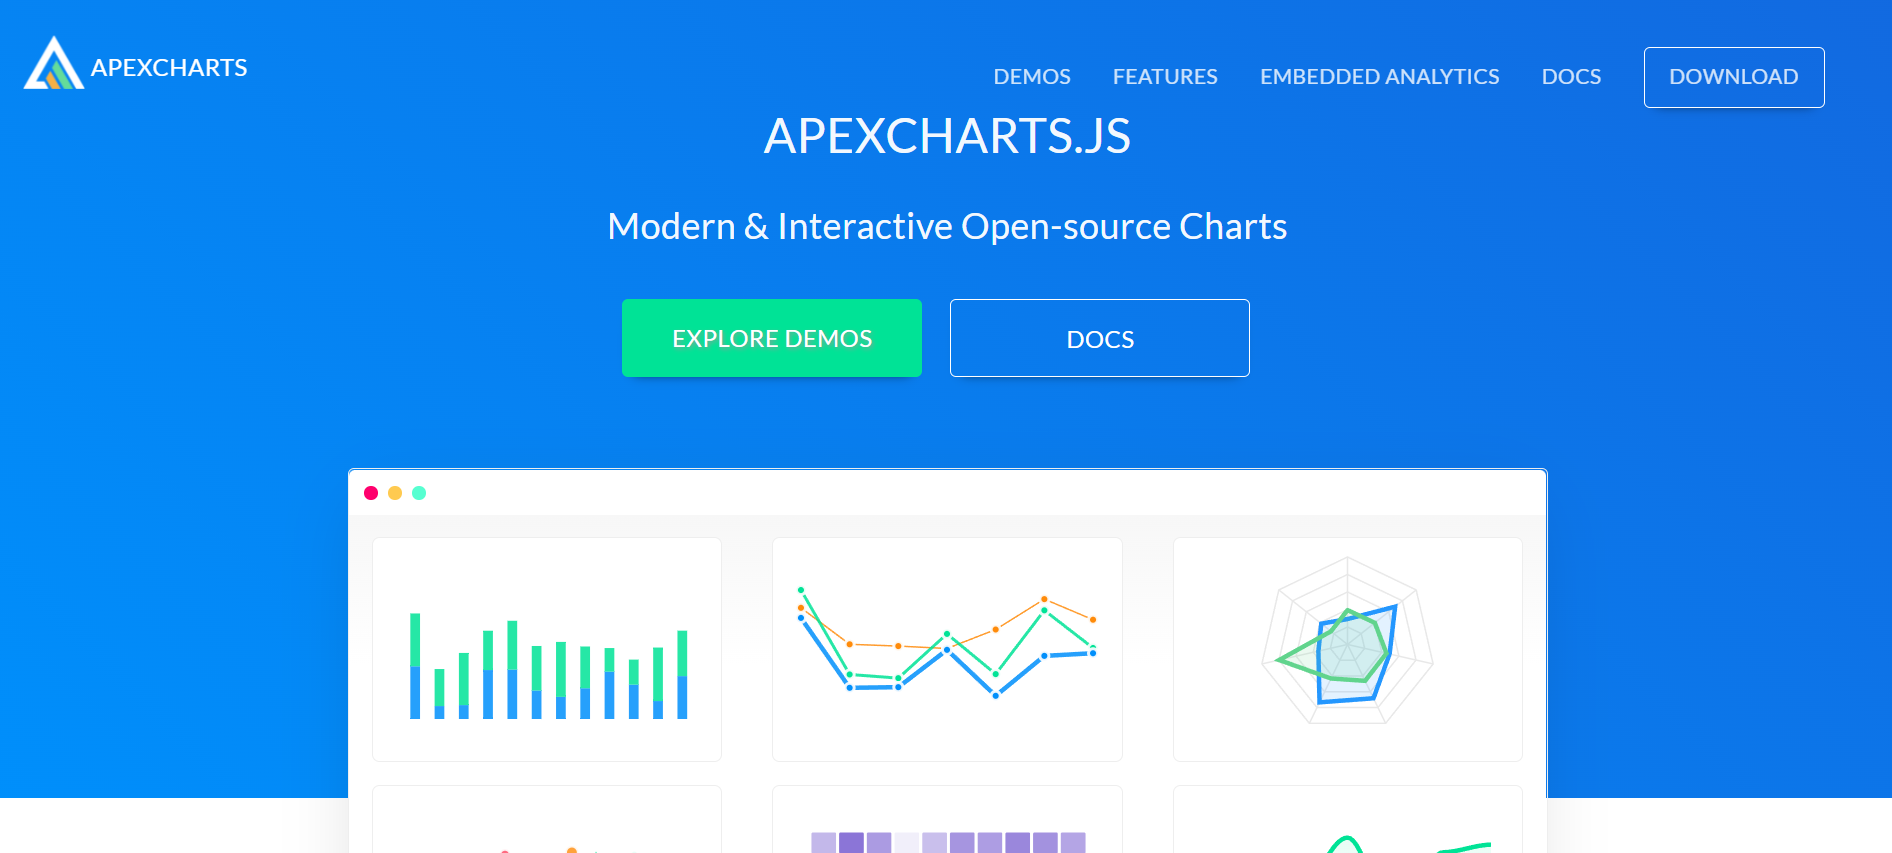
ApexChart.js is an open-source chart library with many features that aid in the presentation of excellent data analysis on your website. This library, according to its user manual description, is capable of providing all charting functionalities. ApexCharts.js is very uncommon because of its annotation functionality. Aside from that, the main aspects of this library are the animations and responsiveness.
Features:
- Annotations with beautiful visuals
- VueJS, vanilla JS, React, and Angular are all supported
- Demos and source code abound
- Responsive tooltips
- User documentation is extensive
- Pre-installed color schemes
Chart Availability:
- Bar
- Donut
- Pie
- Line
- Area
- Annotation
- Bubble
- Gant
- Candlestick
- Scatter
- Spark
- TreeMap
- Heat and Radar
Pricing:
Free
#14 NVD3
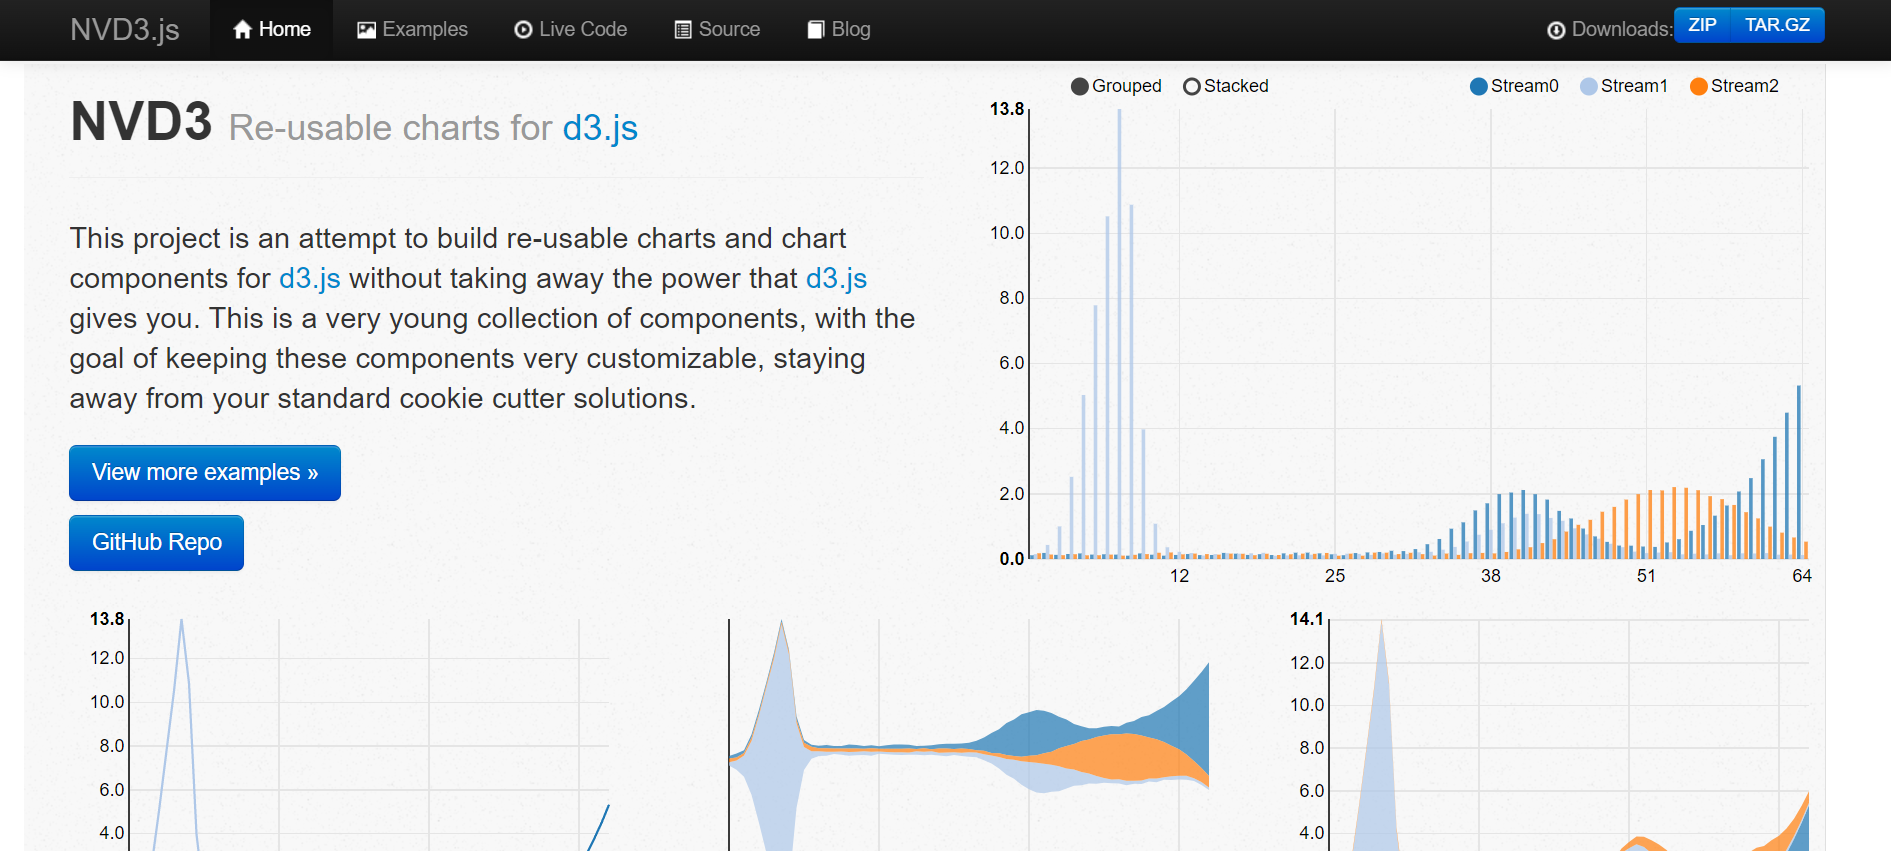
NVD3 is another among the most widely used open-source libraries. It, like the others above, is built on D3.js and has a solid technological foundation. The performance is decent, and there are some rudimentary animation options to add some visual interest to an otherwise uninteresting UI. NVD3 is very easy to connect with existing data API solutions because data can be pumped directly from .json files.
Features:
- Responsive
- JSON is simple to use
- Tooltips that are both user-friendly and customizable
- Turning on and off a series
- Downloading and using the software is simple and quick
- Capability on two axes
Chart Availability:
- Bar
- Pie
- Line
- Donut
- Multiline
- Area
- Scatter
- Bullet
- Candlestick
- Spark
Pricing:
Free
#15 Vis.js
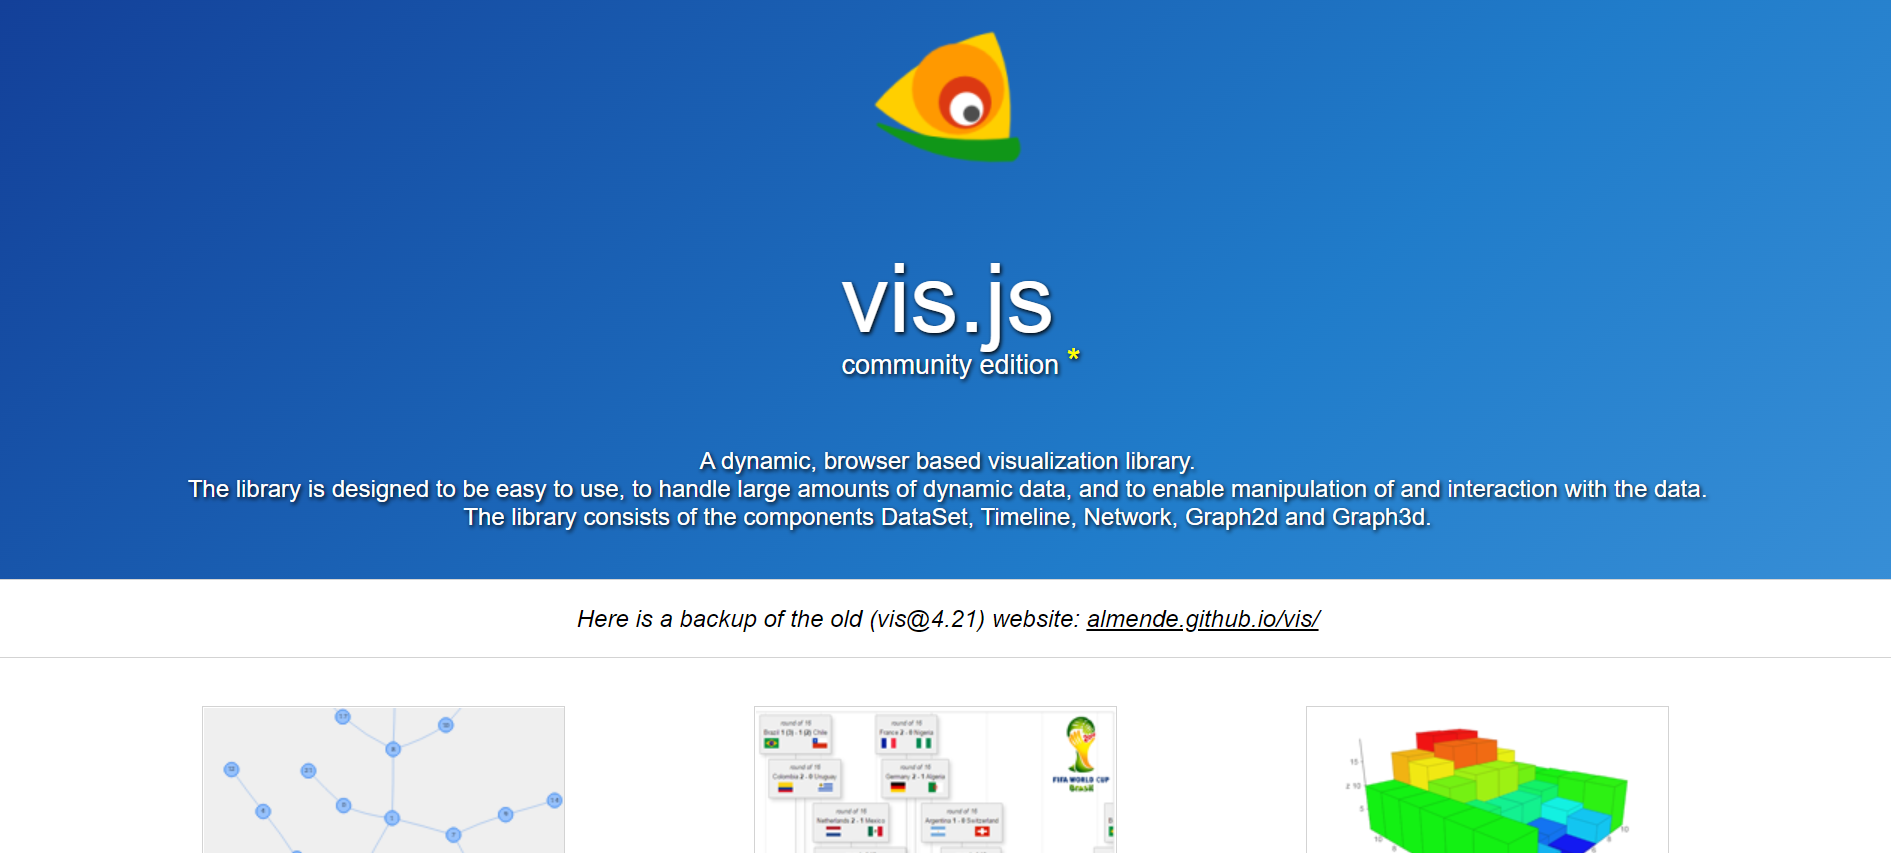
Vis.js is an open-source JavaScript chart library that includes networking, 2D, timeline, and 3D visualization, among other capabilities and sub-libraries. This library's 3D charts are rather uncommon among charting libraries. Apart from that, Vis.js is a library that includes outstanding visualizations in both 2d and 3d formats that can be used for a variety of purposes.
Features:
- Flawless animations
- Tooltips are one of the available options
- Capability to create many charts
- Chart playgrounds come with a variety of characteristics
- On relevant charts, there is 3D interaction
Chart Availability:
- Bar
- Line
- Multiline
- Bubble
- Area
- Gant
- Scatter
Pricing:
Free
Finally!!!
The visualization and analysis of data have become an important aspect of business processes. Large and small businesses require clear and interactive methods for effectively interpreting data. This emphasizes the importance of selecting the correct JavaScript Charting library for your requirements.
Most chart libraries have no trouble dealing with simple curated data sets and static visuals. When real-world, dynamic data is represented, however, charts may not always manage things properly. More time and effort may be required to adjust and organize elements so that charts appear appropriate, and this manual tweaking may become obsolete as more dynamic data is presented.
Our recommendation is to look through these top libraries whenever you require JS charts for whatever project you're working on because the chances are that one or more of them will be the greatest fit.
Get Instant Full-stack Observability with Atatus
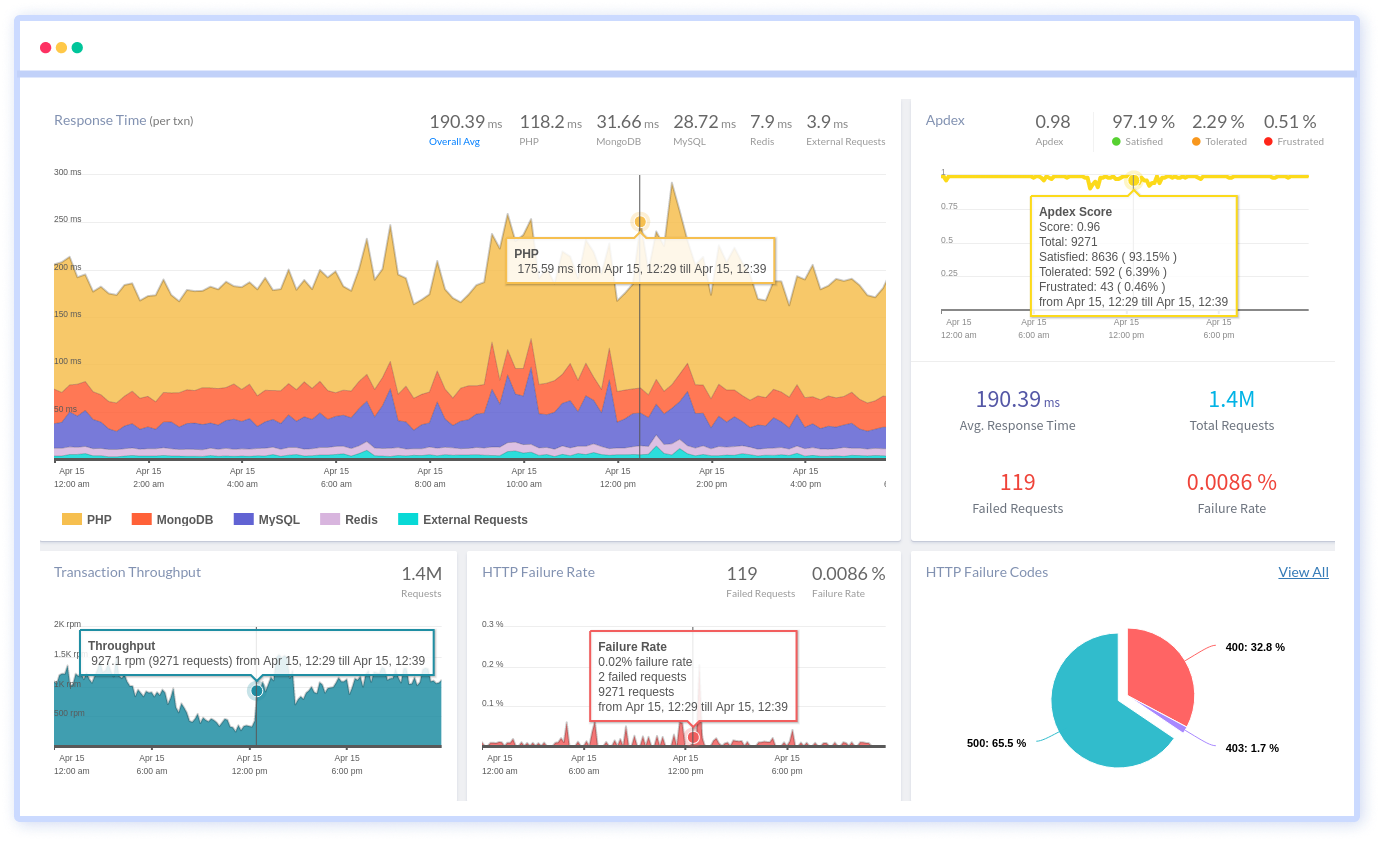
Atatus Application Performance Management(APM) gives you real-time visibility into your application's performance, including transaction details, slow database queries, slow network calls, and more. It assists you in identifying fundamental causes and resolving difficulties more quickly. It supports languages like PHP, Node.js, Java, Ruby, Python, .NET etc.
Atatus Infrastructure Monitoring provides total insight into your infrastructure, allowing you to analyze and fix performance issues that affect your business. Correlating application metrics, logs, and traces to troubleshoot problems faster can help you make better business decisions.
Atatus Real User Monitoring (RUM) is a scalable end-user experience monitoring tool that allows you to see which areas of your website are underperforming and affecting your users. You can understand the causes of your front-end performance issues and how to improve the user experience.
Atatus Log Management is a cloud service that is fully managed. It requires minimal set-up, no maintenance, and can be used for any scale of business. You can aggregate logs from all of your systems and applications into a consolidated, easy-to-navigate user interface to troubleshoot faster.
#1 Solution for Logs, Traces & Metrics
![]() APM
APM
![]() Kubernetes
Kubernetes
![]() Logs
Logs
![]() Synthetics
Synthetics
![]() RUM
RUM
![]() Serverless
Serverless
![]() Security
Security
![]() More
More