Top Observability Tools for 2026: The Definitive Guide
The global observability market has grown into a multi-billion-dollar category because distributed systems fail in ways that are invisible until something breaks and when they do break, the cost of slow diagnosis compounds fast.
As we move toward 2026, observability is evolving from an engineering luxury to an operational necessity. Modern applications span microservices, containers, APIs, and data pipelines and when something breaks, users expect instant recovery.
That urgency is fueling rapid market growth. According to Market.us, the Global Data Observability Market is projected to reach several billion dollars by 2033, growing at a CAGR exceeding 20% between 2024 and 2033. Enterprises are investing heavily in tools that help teams detect, analyze, and resolve issues faster while optimizing performance and controlling costs.
The trend is clear: observability is becoming a key pillar of software reliability, similar to how CI/CD became the backbone of deployment pipelines. As automation and OpenTelemetry adoption rise, observability tools will define how efficiently organizations scale in 2026 and beyond.
What's in this guide?
- What Are Observability Tools?
- How Observability Helps Development Teams?
- Top 15 Observability Tools to Use in 2026
- How to Choose the Right Observability Tool?
- Which Observability Tool Should You Choose in 2026?
- Final Thoughts: Observability in 2026 and Beyond
- Observability in 2026: Common Questions and Expert Answers
What are Observability Tools?
Observability tools collect, correlate, and visualize the three critical types of telemetry data including metrics, logs, and traces to help teams understand how complex systems behave in real time. Instead of relying on isolated monitoring dashboards, observability connects the dots across infrastructure, code, and user experience.
A modern observability platform typically offers:
- Metrics: Quantitative time-series data such as CPU usage, request rate, or latency.
- Logs: Textual event data that captures detailed execution and error information.
- Traces: End-to-end request journeys across distributed systems, showing where latency or failure originates.
Together, these enable developers, DevOps engineers, and SREs to pinpoint issues, measure performance, and maintain uptime at scale.
Observability vs. Monitoring: Key Difference
Both matter. But they answer different questions during an incident.
Monitoring
Tells you when something is wrong. A threshold alert fires. You know the symptom. Works well for known, predefined failure modes.
Observability
Tells you why it's wrong. Correlates traces, logs, and metrics to pinpoint root cause. Essential when failures are novel or span multiple services.
Modern engineering teams need both but observability gives you the depth to go beyond dashboards and actually fix problems faster. When a request fails across 15 microservices, you can't predefine every failure mode. You need to ask new questions of your data in real time.
How Observability Helps Development Teams?
Engineering and DevOps teams use observability platforms to move from reactive troubleshooting to proactive performance optimization. Here’s how it helps:
- Accelerated Root-Cause Analysis: Instead of guessing, engineers can follow a trace from frontend click to backend query, identify slow endpoints, and correlate with logs in seconds.
- Reduced MTTR (Mean Time to Resolution): Correlating incidents across services and environments shortens downtime and prevents repeat outages.
- Improved Developer Productivity: With unified dashboards and contextual alerts, developers spend less time firefighting and more time building.
- Data-Driven Performance Optimization: Observability platforms highlight slow database calls, memory leaks, or inefficient dependencies that affect user experience.
- Reliable Releases and Faster Feedback: Teams can observe the impact of new deployments immediately and roll back before users notice regressions.
Top 15 Observability Tools to Use in 2026
Below is a detailed comparison of the top 15 observability tools leading the market in 2026. The focus is on key capabilities, pricing direction, and where each platform fits best.
Top Observability Tools to Use in 2026 - In-Depth Review
#1 Atatus- Next-Gen Observability. Unified, Scalable, Insight-Driven
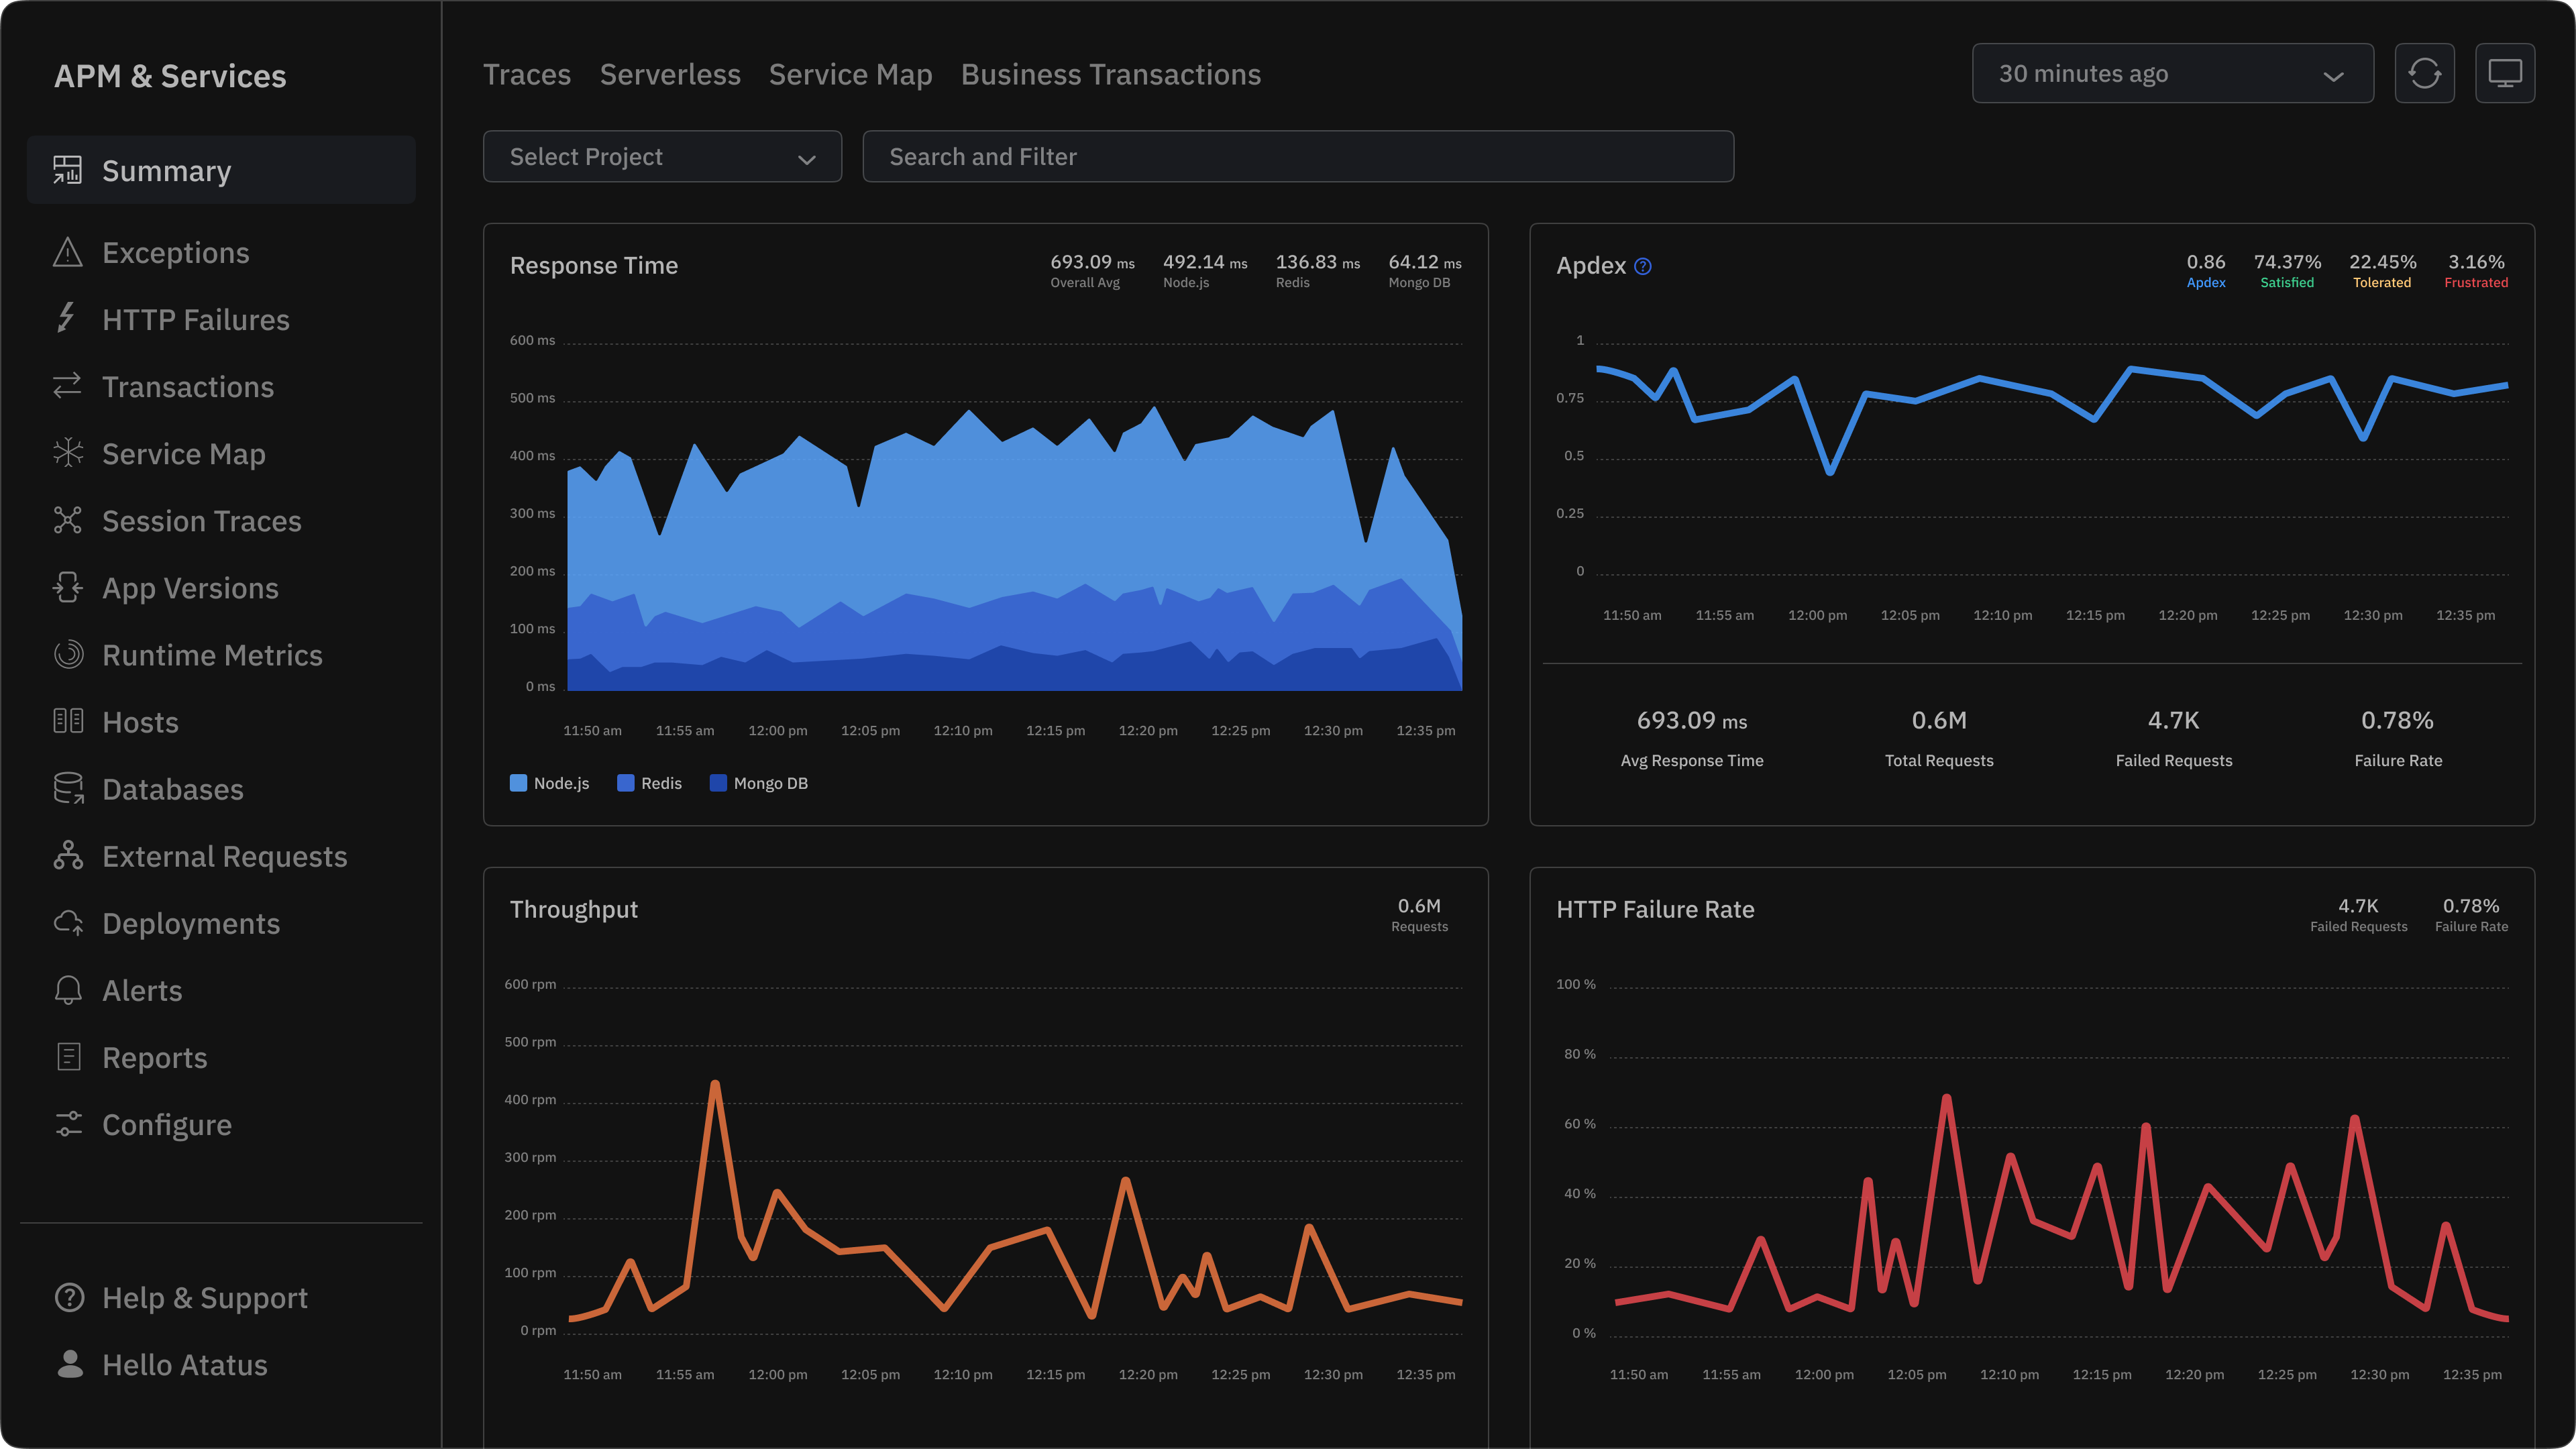
Atatus provides developer-friendly monitoring that links application performance to code and user impact. Built to be simple to adopt and fast to extract value from, Atatus helps teams find the root cause quickly and instrument their stack without lengthy onboarding.
Core capabilities
- Unified monitoring across apps, servers, and front-end: Single-pane view across APM, RUM, and server metrics so teams can pivot from a slow endpoint to the exact trace and logs that explain it.
- APM dashboard designed for developers: Transaction traces, span details, slow SQL and external call breakdowns that surface the offending code path and the related deployment or release.
- End-to-end visibility into logs: Correlate traces to logs without manual linking so you can move from “where” to “why” in fewer clicks.
- Custom dashboards & alerting: Build focused dashboards for services, teams, or SLOs and create alerts that reflect business impact rather than raw thresholds.
- Flexible pricing: Transparent tiers and usage-based options suitable for startups and scaling teams; pricing designed to reduce surprise costs as volume grows.
Who it’s best for?
Engineering teams that want quick time to value, strong developer UX, and a clear path from code → trace → fix. Atatus suits product teams that prefer practical observability workflows over enterprise configuration heavy approaches.
Why teams choose Atatus?
- Fast onboarding and focused developer workflows.
- Clear trace-to-log correlation to speed incident resolution.
- Pricing designed with growing engineering teams in mind.
- Atatus is ideal for small to mid-sized businesses and fast-growing tech teams who want enterprise-level observability without enterprise-level costs.
See Atatus in action - full-stack visibility in 5 minutes
APM, logs, RUM, and infrastructure monitoring. 14-day free trial. No credit card required.
#2 Datadog - Enterprise Observability Powerhouse
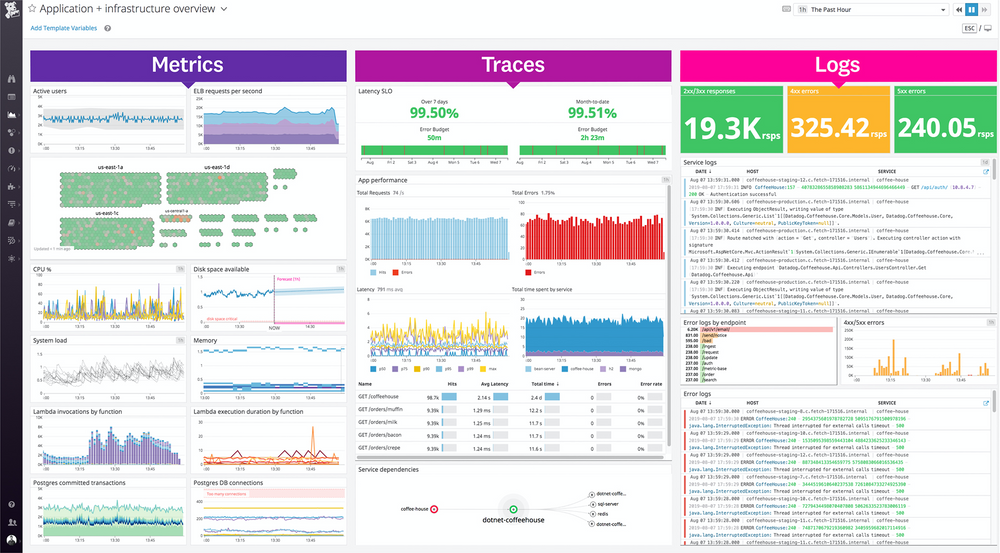
For organizations with hybrid and multi-cloud environments, Datadog is one of the most comprehensive observability solutions. It’s designed to handle complex data pipelines, large distributed systems, and deep AI-driven insights.
Key Features
Datadog unifies metrics, traces, logs, and security analytics under a single platform. It provides built-in APM, RUM, infrastructure, and network performance modules, alongside advanced anomaly detection and forecasting. Teams can visualize dependencies with real-time service maps and leverage automation for incident response.
Pricing
Datadog uses a modular pricing structure, charging separately for APM, logs, and infrastructure. Costs typically scale with data ingestion and host count, making it one of the more premium options.
Pros
- Exceptional coverage and integration ecosystem (600+ tools).
- Best suited for large enterprises managing multi-cloud workloads.
- AI-driven detection and automated remediation options.
Cons
- Pricing can escalate rapidly with host count and add-ons
- Steeper learning curve for new users
- Onboarding takes significantly longer than Atatus
Datadog remains a top choice for enterprises that prioritize breadth, depth, and automation in observability.
3. Dynatrace - Intelligent Automation for Observability
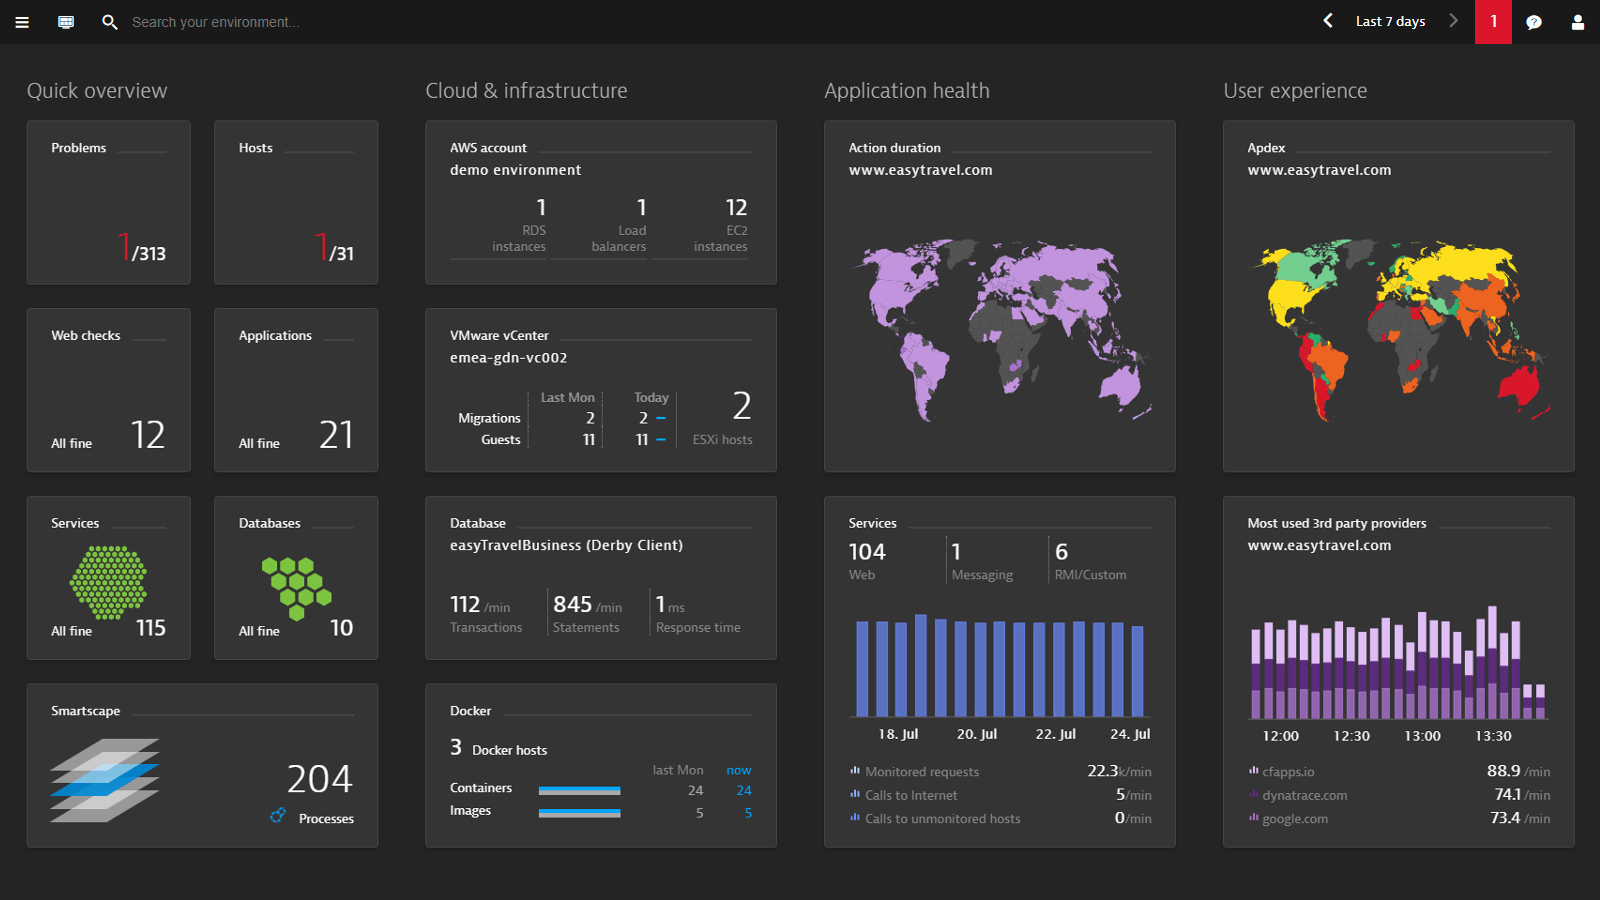
Dynatrace Software Intelligence Platform is a network, application, and infrastructure monitoring platform with AIOps, digital experience management, and digital business analytics. Its signature differentiator is Davis AI - an automatic root-cause analysis engine that fires before an alert even reaches an on-call engineer.
For teams that want AI-driven insights and autonomous performance management, Dynatrace is a leader. Its core value lies in combining full-stack observability with deep automation.
Key Features
Dynatrace offers full-stack observability across infrastructure, applications, and user experience. Its Davis AI engine automatically identifies anomalies and provides root-cause analysis without manual setup. The platform covers logs, metrics, traces, and real-user monitoring under one interface.
Pricing
Dynatrace pricing is usage-based, typically higher than average, targeting enterprise budgets. Licensing is based on host units and monitored entities.
Pros
- Powerful automation with minimal manual tuning.
- Deep AI-driven diagnostics reduce MTTR significantly.
- Excellent enterprise-scale reliability.
Cons
- DPU-based consumption pricing is difficult to forecast
- Complexity can overwhelm smaller teams
- Heavier agent footprint than agentless alternatives
Dynatrace fits enterprises prioritizing automation and deep diagnostics over pricing flexibility.
Wondering if Dynatrace is really worth the price? Check out how Atatus delivers powerful monitoring with transparent pricing and no surprise bills.
4. New Relic - Developer-First Observability with Generous Free Tier
New Relic offers one of the most compelling free tiers in the market with 100GB of data ingest per month at no cost. Its unified platform covers APM, infrastructure, browser monitoring, synthetic testing, and logs with a usage-based pricing model that scales transparently.
For development-heavy organizations, New Relic provides a broad observability platform focused on developer empowerment.
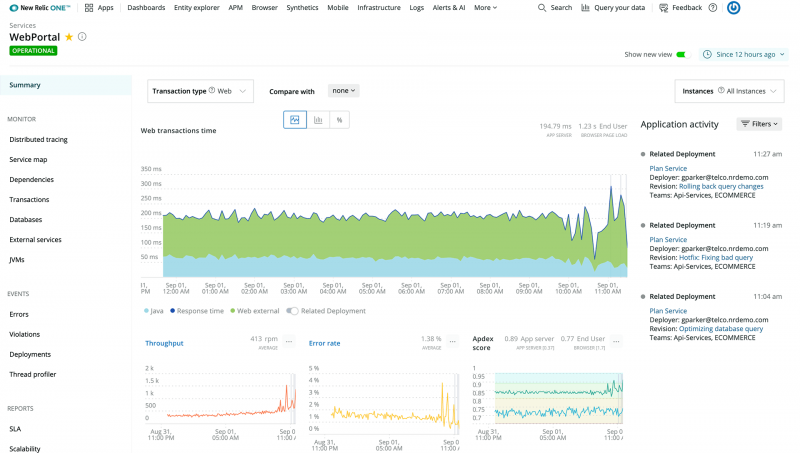
Key Features
New Relic brings together APM, logs, infrastructure, browser, and mobile monitoring into one UI. The NRQL (New Relic Query Language) allows custom data exploration, enabling engineers to query metrics easily. Distributed tracing and real-time analytics make it easy to connect performance data with code changes.
Pricing
New Relic follows a pay-as-you-go model - $0.30/GB for data ingestion, with free tiers for light users. It’s more transparent than most legacy tools.
Pros
- Great for developers; simple yet powerful UI.
- Transparent usage-based billing.
- Rich community and integrations.
Cons
- Costs can grow unpredictably at high ingest volumes
- UI can feel overwhelming for simple use cases
New Relic strikes a good balance between flexibility, power, and ease of use which is ideal for developer-centric teams.
5. Splunk Observability Cloud - Analytics-Driven Performance at Scale
For enterprises operating across multi-cloud and hybrid environments, Splunk Observability Cloud delivers unmatched scalability and analytics. It’s built for organizations ingesting massive telemetry volumes who need to connect operational data with business impact.
Key Features
Splunk unifies metrics, traces, and logs into a single pipeline for real-time analytics. It features APM, infrastructure monitoring, RUM, and synthetic testing integrated with Splunk’s analytics engine. Machine-learning capabilities detect anomalies, identify trends, and automate root-cause analysis. Its visualization tools make sense of petabytes of observability data without manual correlation.
Pricing
Splunk uses a usage-based pricing model that scales by data ingestion and retention time. While powerful, it tends to be one of the more expensive options once data volumes grow.
Pros
- Excellent scalability and enterprise reliability.
- Deep analytics with machine-learning support.
- Integrates tightly with the Splunk ecosystem for unified data management.
Cons
- Expensive for high-volume log ingestion.
- Steeper learning curve for setup and optimization.
- May feel excessive for smaller DevOps teams.
Splunk is best for large enterprises needing a single source of truth for analytics, observability, and incident management.
6. Grafana Cloud - Open-Source Power with Managed Simplicity
For teams that love the flexibility of open-source but want managed reliability, Grafana Cloud provides the best of both worlds. It combines the popular Grafana visualization suite with managed Prometheus, Loki, and Tempo backends.
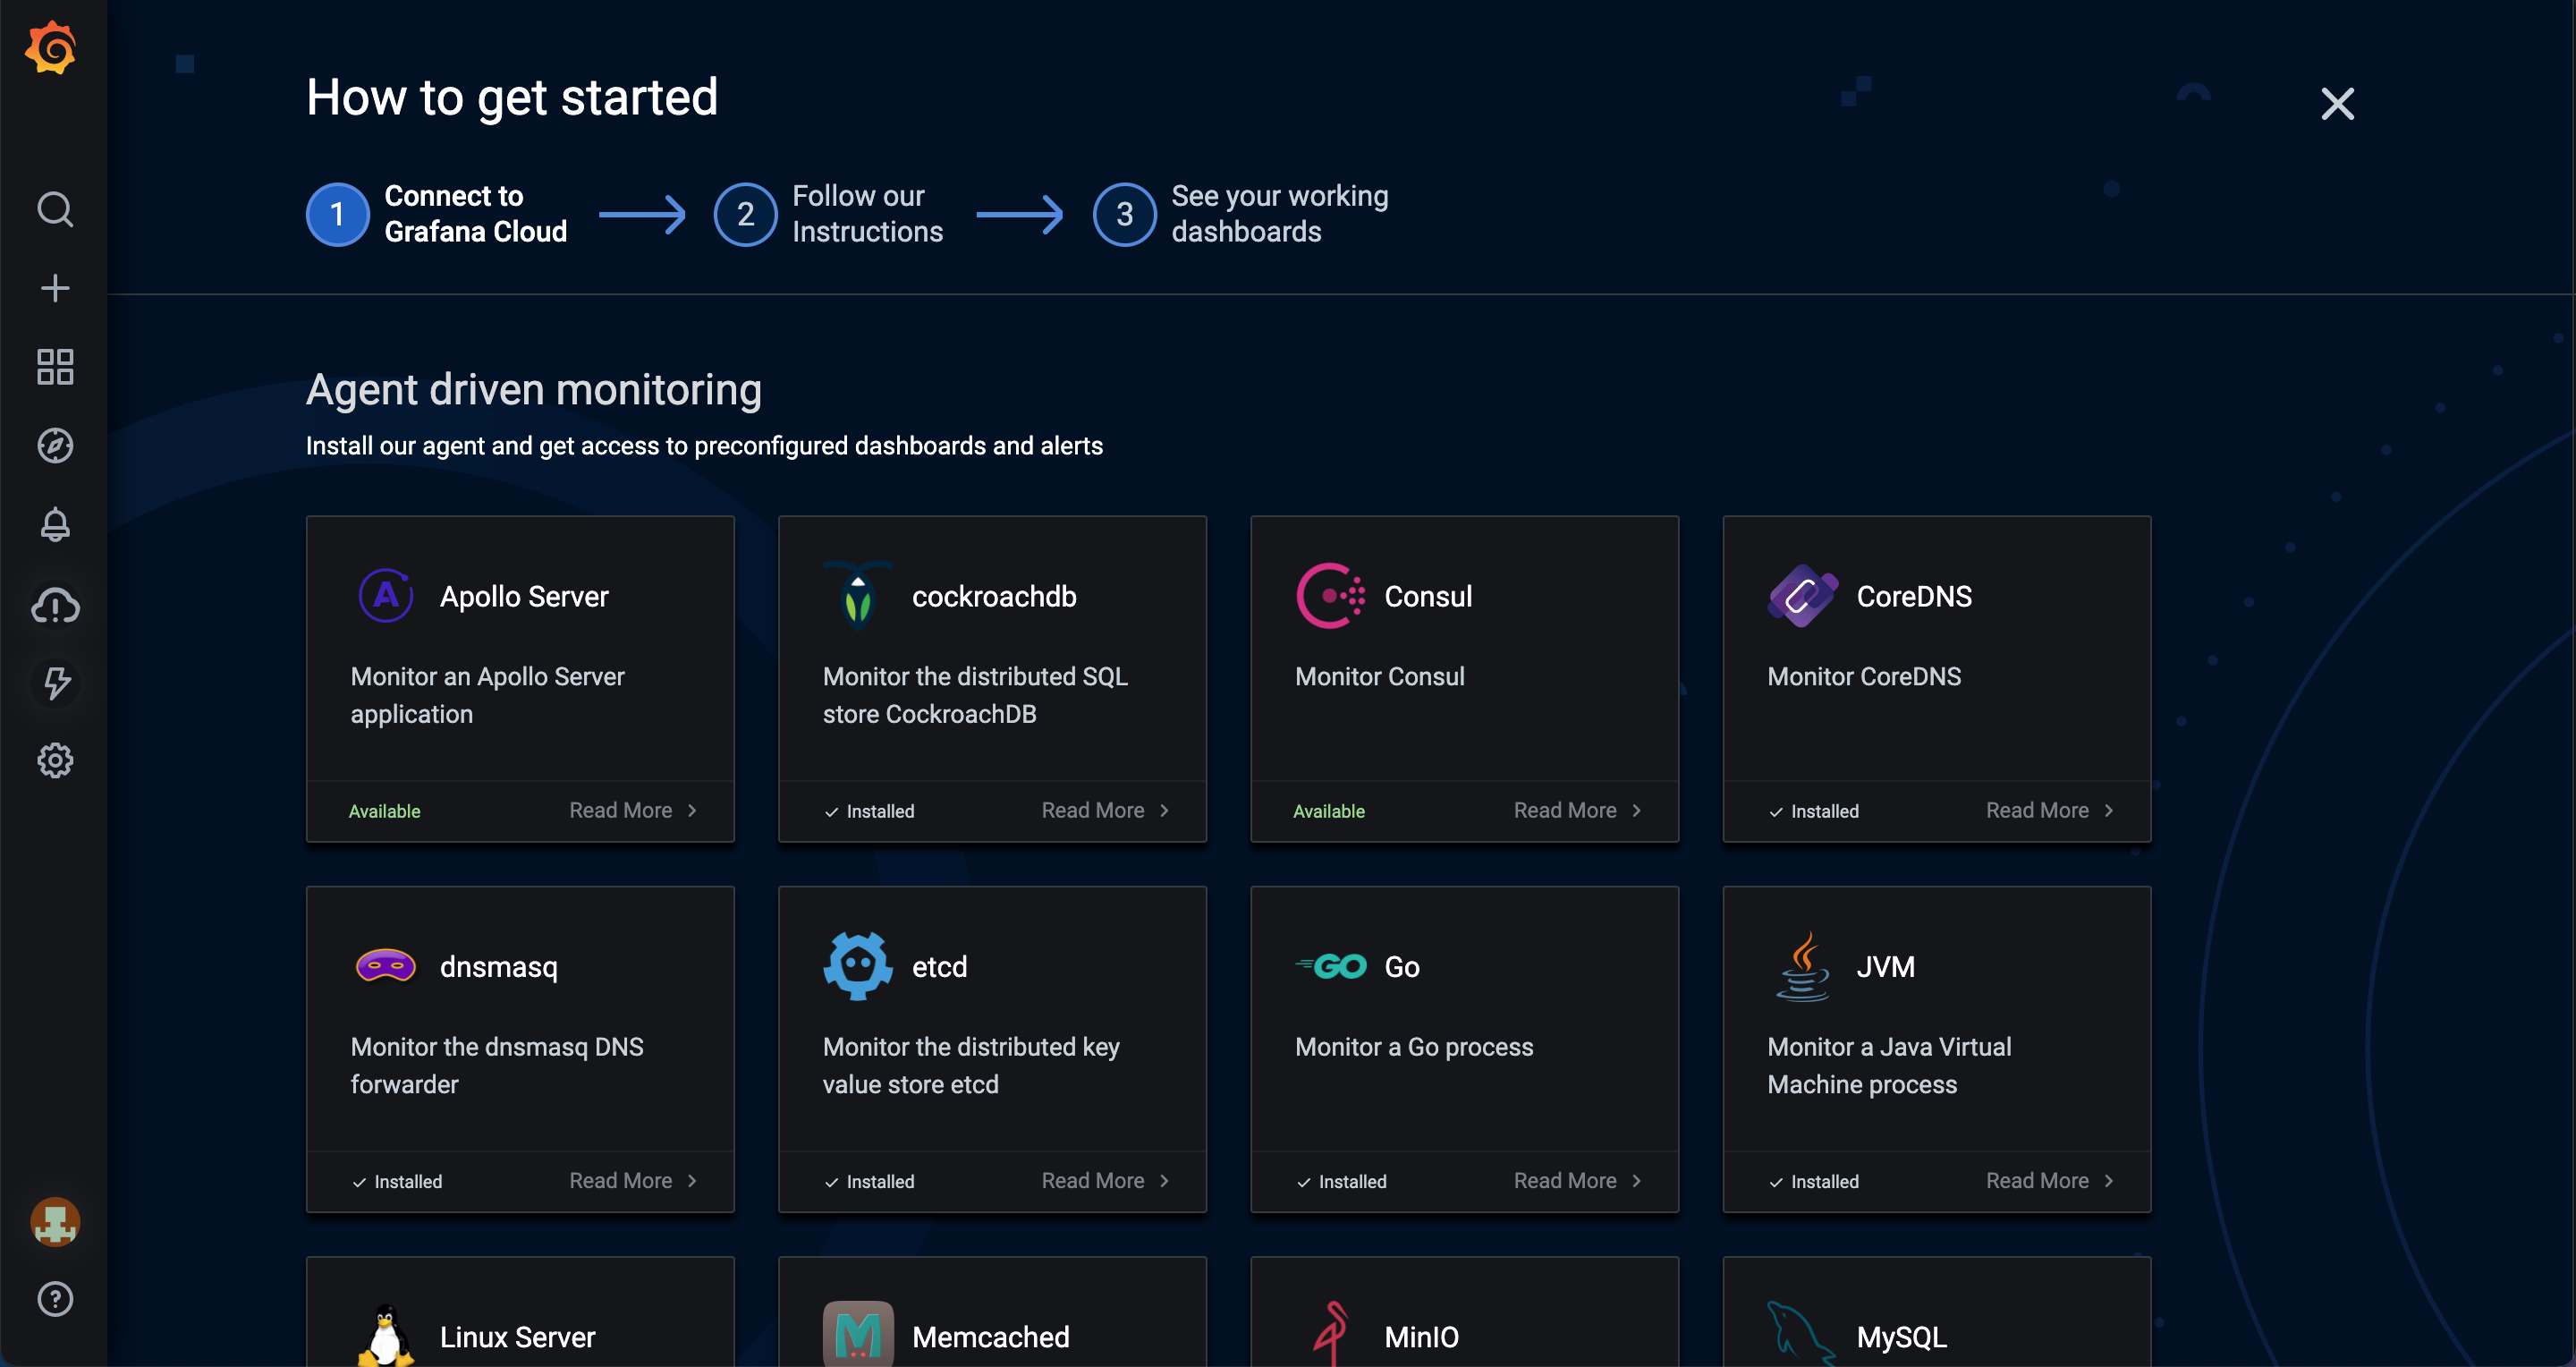
Key Features
Grafana Cloud centralizes dashboards, logs, and traces through native integrations. Developers can build custom observability dashboards powered by open standards (PromQL, Loki queries). It supports alerting, correlation, and team collaboration. Its plugin ecosystem enables integrations with virtually any metric source.
Pricing
Grafana Cloud offers a free tier and affordable pro plans starting around $8–9 per user/month, with scalable pricing for data retention and metrics.
Pros
- Strong open-source foundation and flexibility.
- Cost-effective compared to enterprise tools.
- Excellent dashboarding and visualization capabilities.
Cons
- Requires some expertise in query languages (PromQL, LogQL).
- Limited enterprise-grade automation and AI insights.
- Data ingestion limits at lower tiers.
Grafana Cloud is ideal for teams that want full control and customization without managing infrastructure themselves.
7. Elastic Observability - Unifying Logs, Metrics, and APM
Elastic Observability, part of the Elastic Stack (Elasticsearch, Logstash, Kibana), offers a robust, extensible observability solution for organizations already invested in Elastic’s data platform.
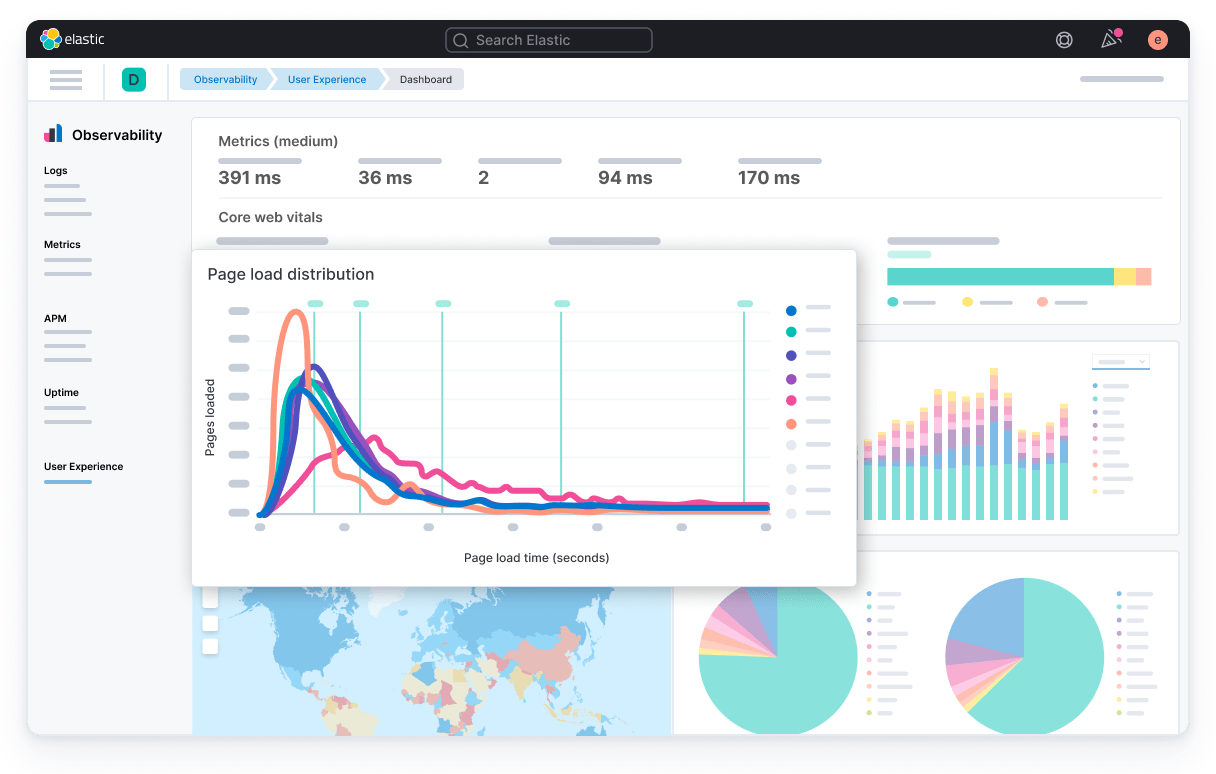
Key Features
Elastic Observability consolidates logs, metrics, and traces into Elasticsearch, offering advanced search and analytics through Kibana dashboards. Its APM and RUM modules help pinpoint performance issues at the code level. Elastic’s machine-learning features detect anomalies and automate alerting across environments.
Pricing
Elastic follows a usage-based pricing for its managed cloud (Elastic Cloud) and is free for self-hosted setups, though infrastructure costs apply.
Pros
- Highly flexible and extensible via open APIs.
- Deep analytics and search capabilities.
- Strong ecosystem for self-hosting and customization.
Cons
- Requires setup and tuning for optimal performance.
- Scaling can be complex without managed services.
- UI not as beginner-friendly as newer SaaS solutions.
Elastic Observability suits teams that already rely on the Elastic Stack and want to extend it into full-stack observability.
8. Sumo Logic Observability - Cloud-Native Simplicity for DevSecOps
Sumo Logic Observability helps DevOps and security teams maintain unified visibility in modern cloud environments. It’s purpose-built for microservices, containers, and event-driven architectures.
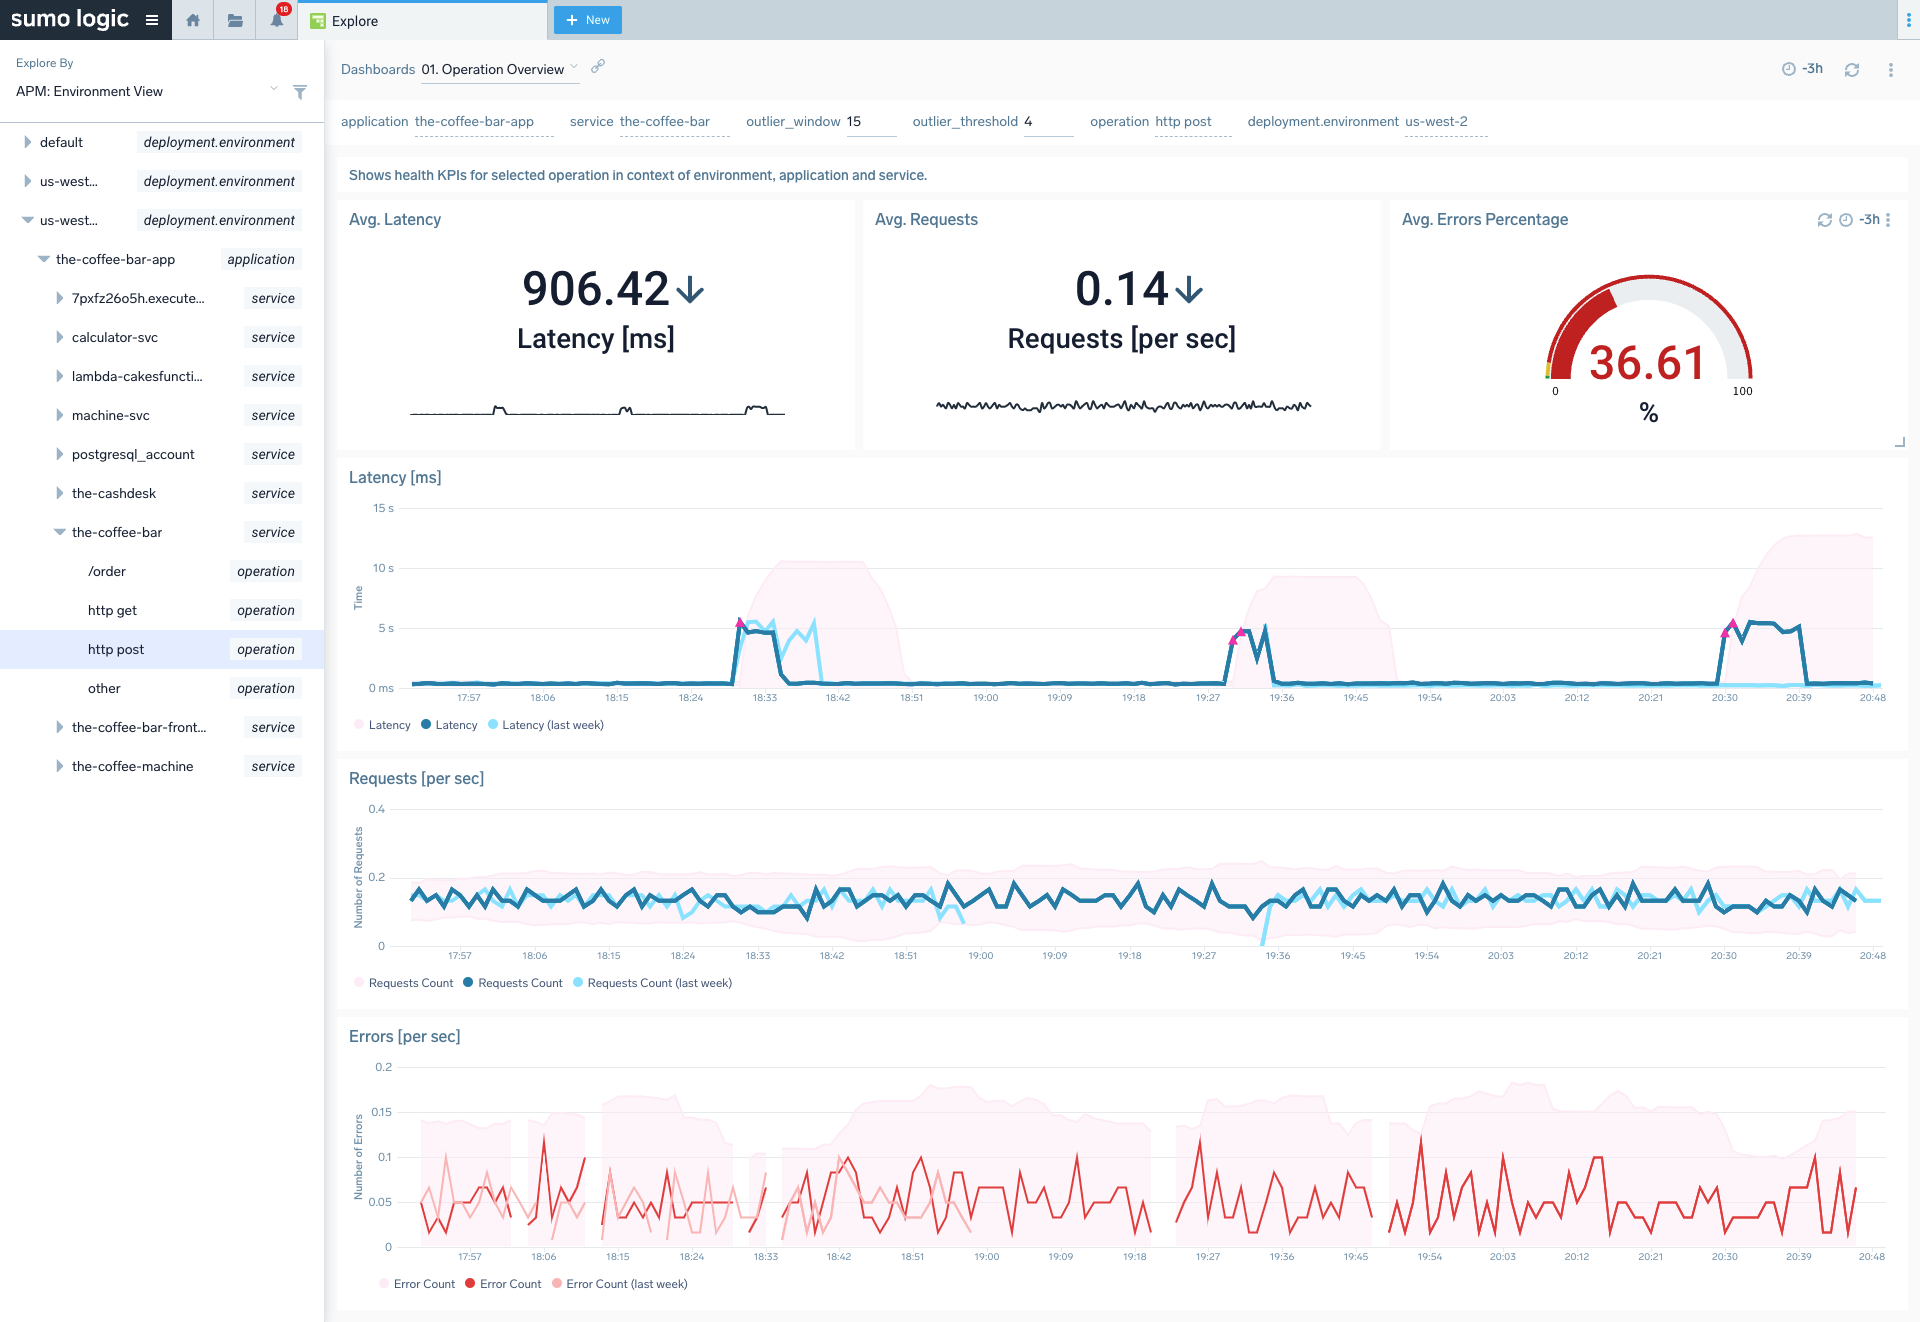
Key Features
Sumo Logic’s platform correlates logs, metrics, and traces across distributed services. It includes real-time alerting, dashboards, anomaly detection, and log analytics powered by machine learning. Its unified model helps DevSecOps teams monitor both performance and security events simultaneously.
Pricing
Sumo Logic uses tiered pricing based on ingestion and data retention, typically starting around $3–4 per GB. There’s also a free trial for small teams.
Pros
- Fast setup with fully managed SaaS architecture.
- Great fit for cloud-native and containerized applications.
- Integrates easily with AWS, GCP, and Kubernetes.
Cons
- Pricing can grow steeply with large data volumes.
- Some dashboards have limited customization.
- Not as deep in APM as dedicated solutions like Atatus or New Relic.
Sumo Logic stands out for its simplicity and quick deployment which is a practical choice for modern cloud monitoring.
9. AppDynamics - Enterprise APM in the Cisco Ecosystem
AppDynamics targets enterprises that need to connect technical performance with business impact. Acquired by Cisco, it’s widely used in regulated industries and large organizations.
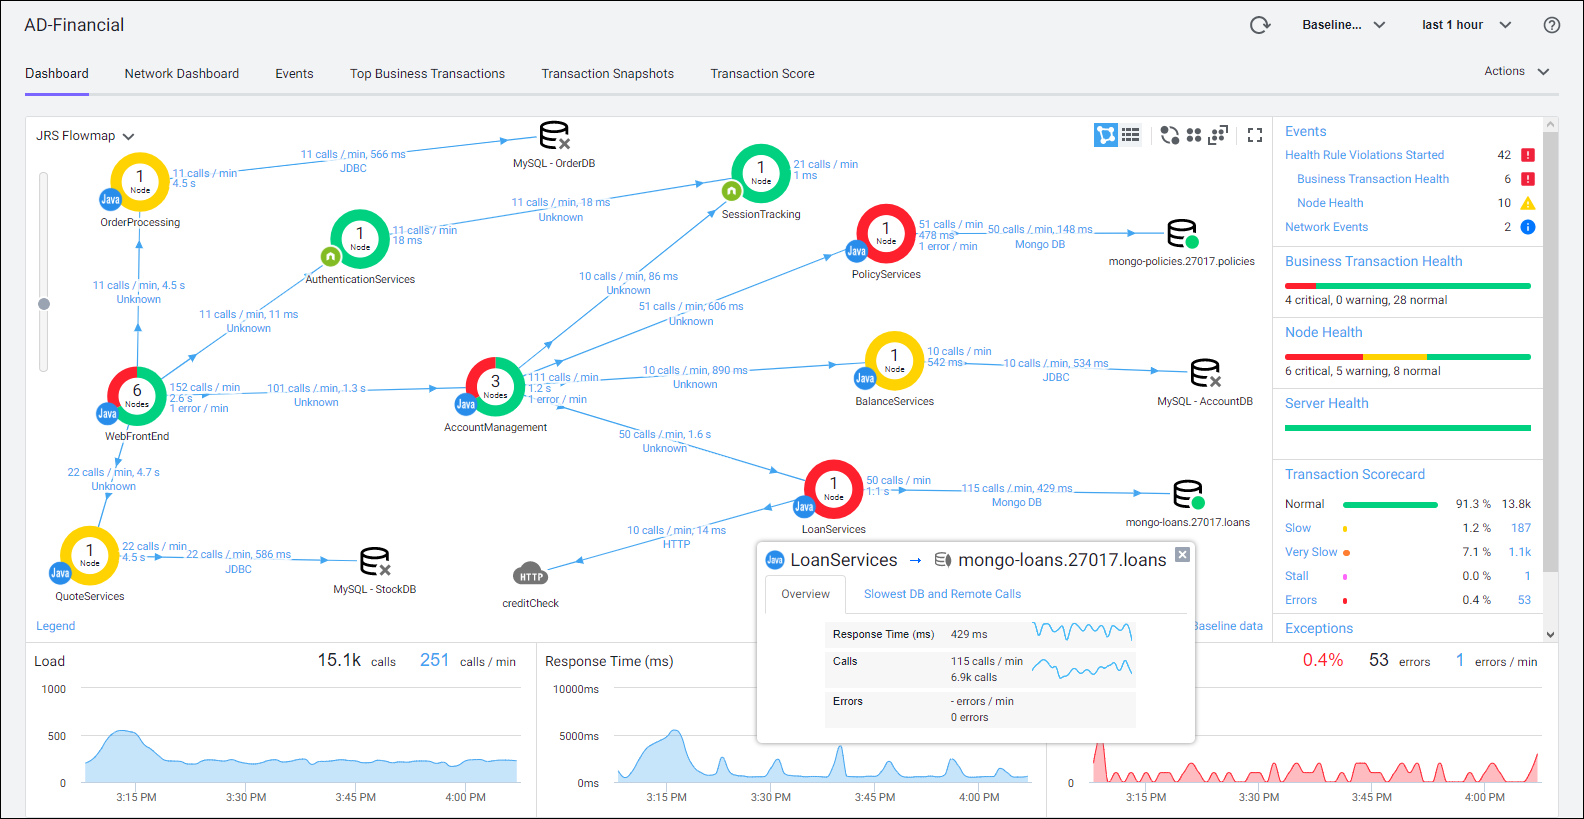
Key Features
AppDynamics tracks business transactions end-to-end, linking code-level performance metrics to business KPIs. It offers deep diagnostics, user experience monitoring, infrastructure mapping, and strong visualizations of performance bottlenecks.
Pricing
AppDynamics pricing is license-based, typically around $60 per agent/month, with enterprise plans varying by scale and deployment.
Pros
- Ideal for large, complex enterprise environments.
- Clear mapping between application health and business outcomes.
- Strong support for hybrid and on-prem infrastructures.
Cons
- Expensive for smaller teams.
- Interface and setup can feel dated compared to modern SaaS options.
- Slower innovation cycle post-acquisition.
AppDynamics remains a solid enterprise APM, particularly when business context visibility is critical.
10. LogicMonitor - Infrastructure-Focused Observability
LogicMonitor offers deep infrastructure monitoring, particularly valuable for hybrid environments combining legacy and cloud systems.
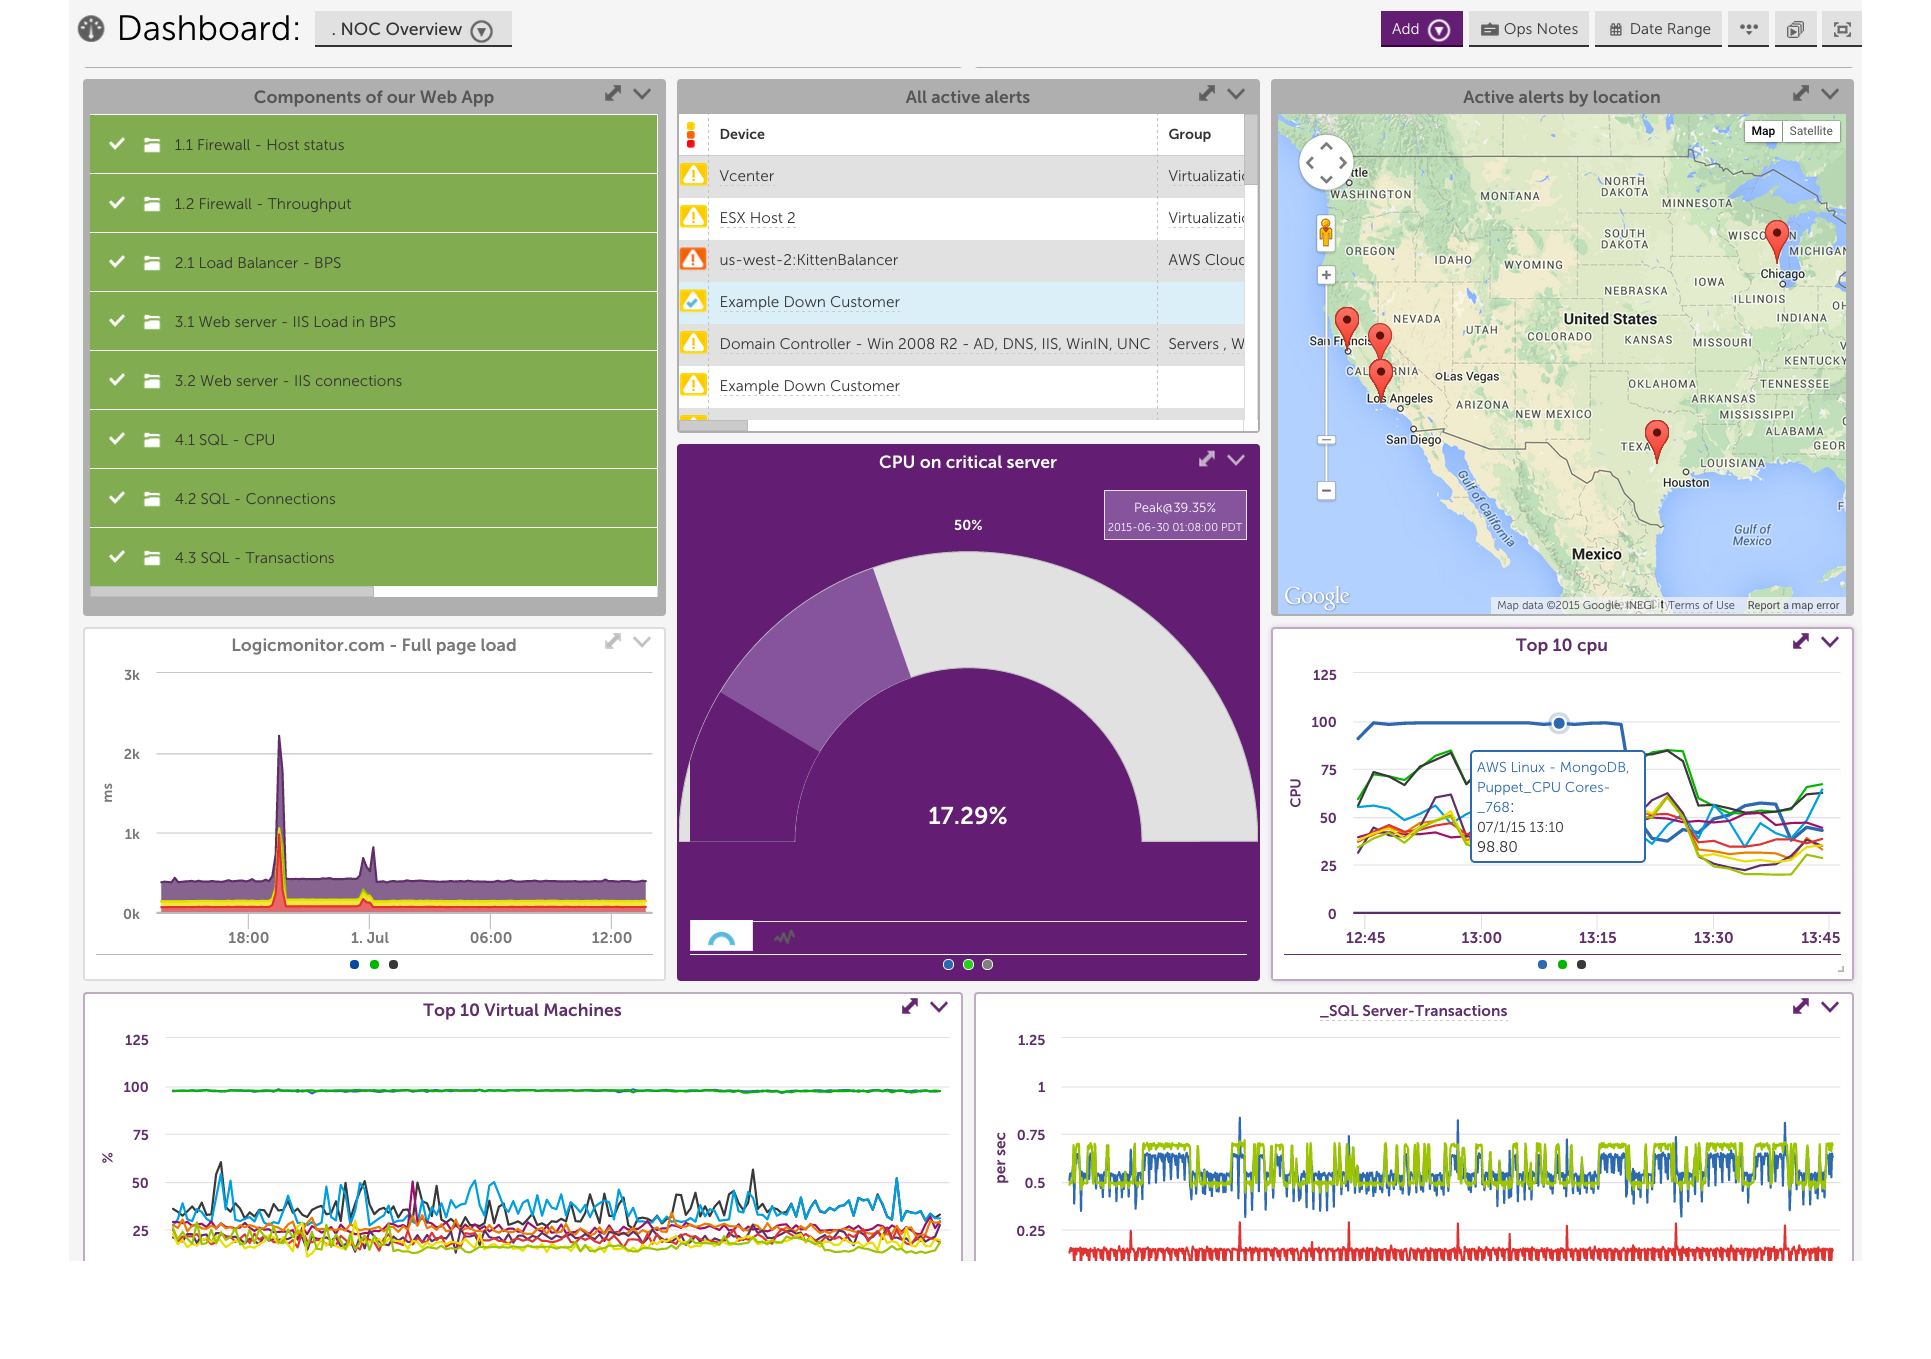
Key Features
It automatically discovers devices, servers, and applications, monitoring performance metrics in real time. The AI-driven alerting and anomaly detection systems help IT teams predict issues before outages. The platform also provides clear network topology mapping and hybrid visibility across environments.
Pricing
LogicMonitor charges per monitored device, averaging $20–25 per device/month, depending on scale and integrations.
Pros
- Excellent for hybrid and on-prem infrastructure.
- Easy to deploy with minimal configuration.
- Strong visualization and dependency mapping tools.
Cons
- Limited APM and tracing depth compared to developer-centric tools.
- Focused more on IT operations than developer observability.
LogicMonitor is best suited for IT and infrastructure teams needing hybrid visibility rather than code-level performance data.
11. Prometheus - Open-Source Metrics Pioneer
Prometheus remains one of the most widely adopted open-source monitoring systems, essential in Kubernetes environments.
Key Features
It’s a time-series database designed to collect and query metrics with high precision. Using PromQL, teams can perform advanced queries and build dashboards (often in Grafana). It’s a core component of the CNCF observability stack and integrates seamlessly with exporters and Kubernetes.
Pricing
Free and open-source. Hosting, scaling, and alerting infrastructure incur additional costs when self-managed.
Pros
- Ideal for Kubernetes and microservices.
- High flexibility for metric collection and analysis.
- Strong community and ecosystem support.
Cons
- Lacks native log and trace correlation.
- Requires manual scaling and data retention configuration.
- Not a full observability platform without additional tools (Grafana, Loki, Tempo).
Prometheus is excellent for engineers who want granular metric visibility and control.
12. Sentry - Error Tracking for Developers
Sentry focuses on application error monitoring and performance tracking which is purpose-built for developers shipping high-velocity applications.
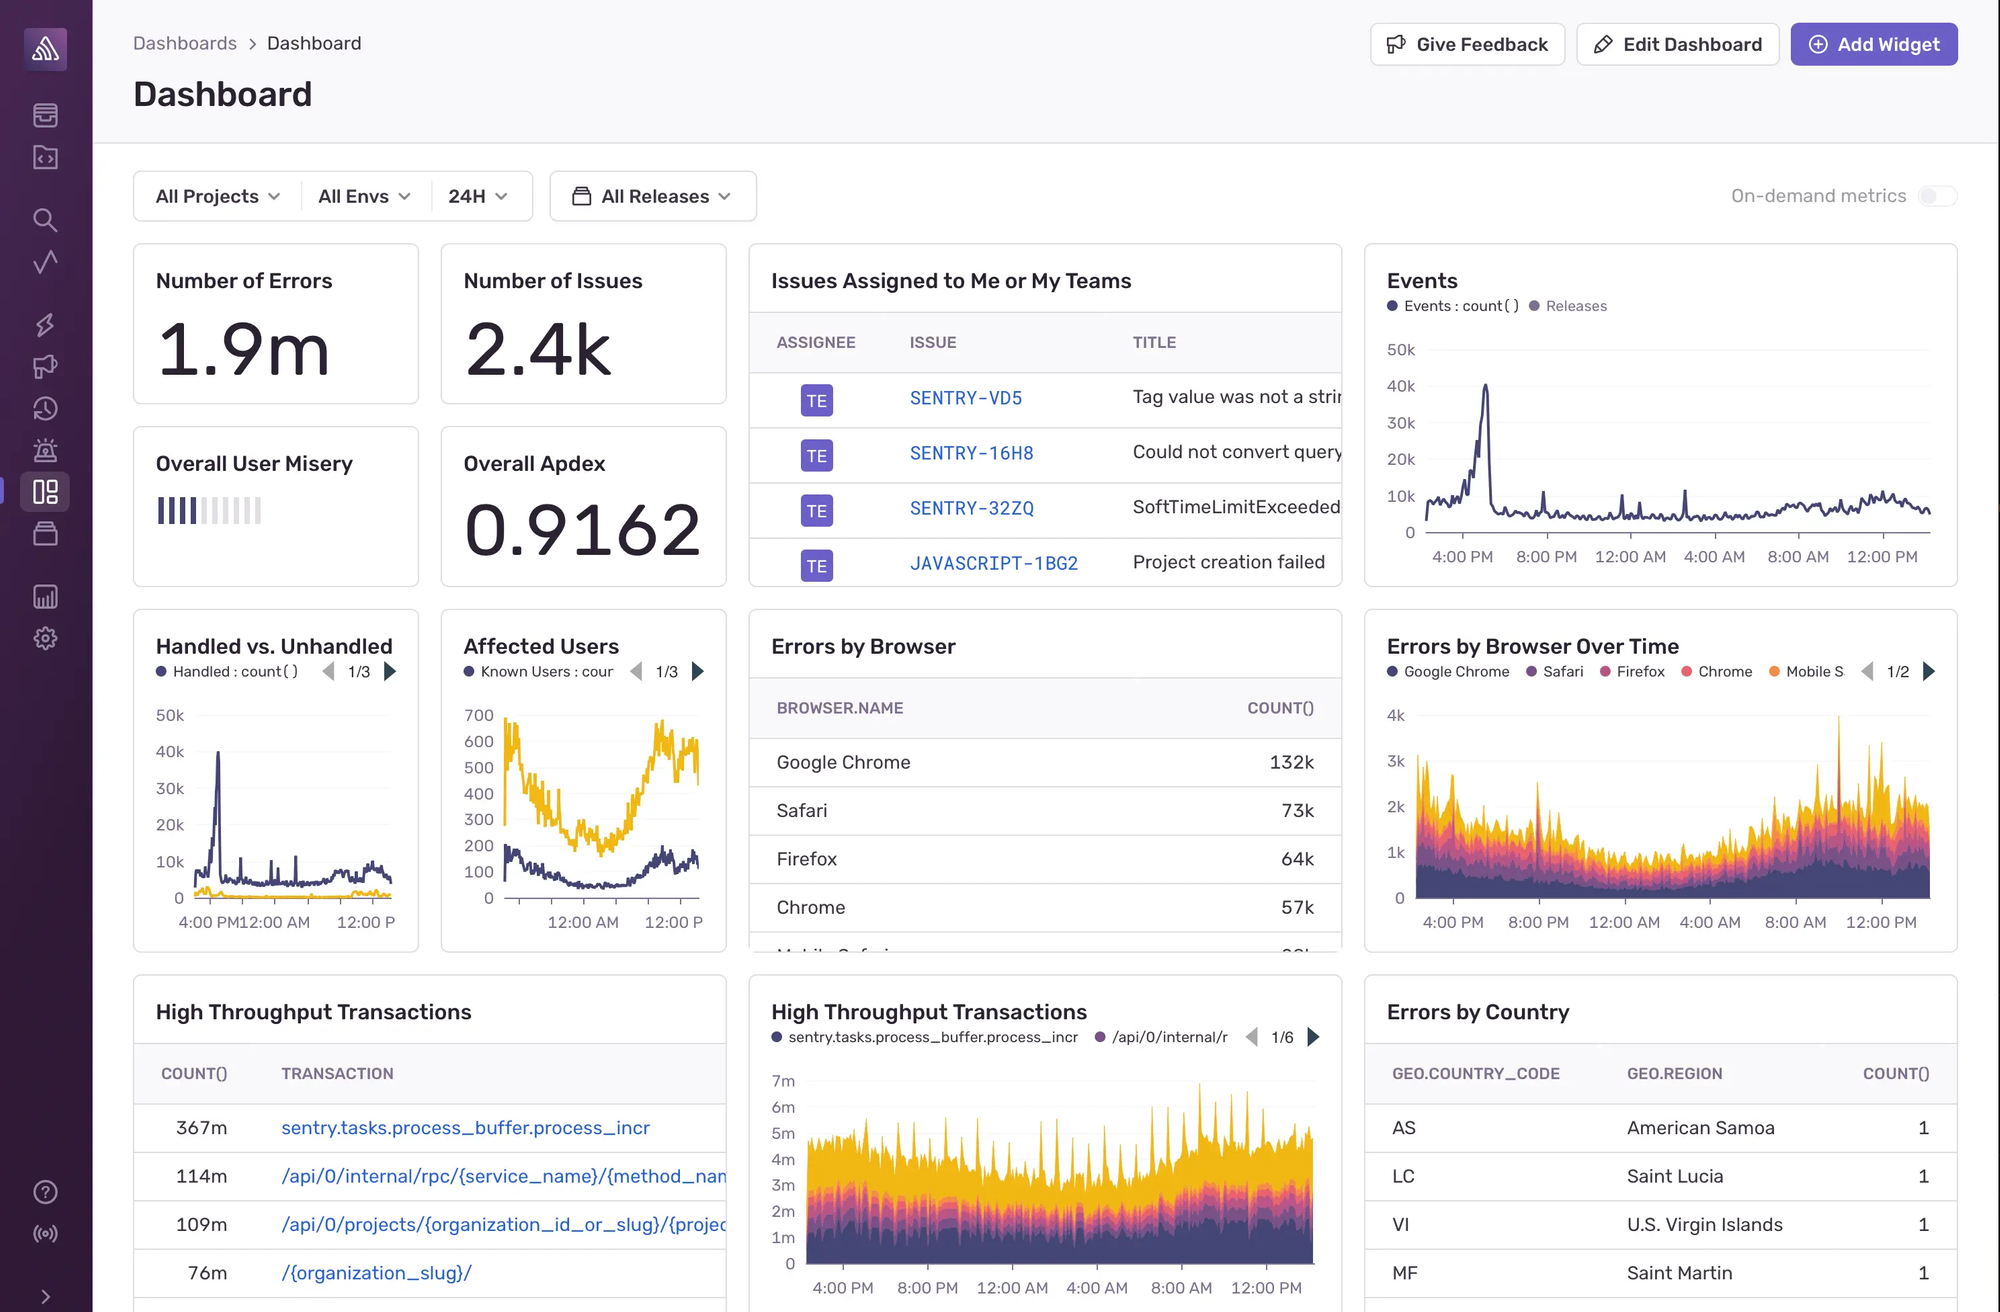
Key Features
Sentry provides real-time error tracking, stack trace analysis, and release monitoring. It supports popular frameworks (React, Node.js, Django, Go, etc.) and correlates errors with deployments to identify regressions. Performance monitoring modules reveal slow queries, transactions, and API bottlenecks.
Pricing
Sentry offers a free plan and paid tiers starting at $26/month, depending on event volume.
Pros
- Excellent developer experience and clean UI.
- Instant context for debugging.
- Strong integration with CI/CD workflows.
Cons
- Focused mainly on error tracking, not full observability.
- Lacks infrastructure and log-level visibility.
Sentry is perfect for dev teams prioritizing real-time debugging and release stability.
13. Instana (IBM) - Smart Automation for Cloud-Native Observability
Instana, now part of IBM, delivers automated instrumentation and granular tracing for microservices and Kubernetes environments.
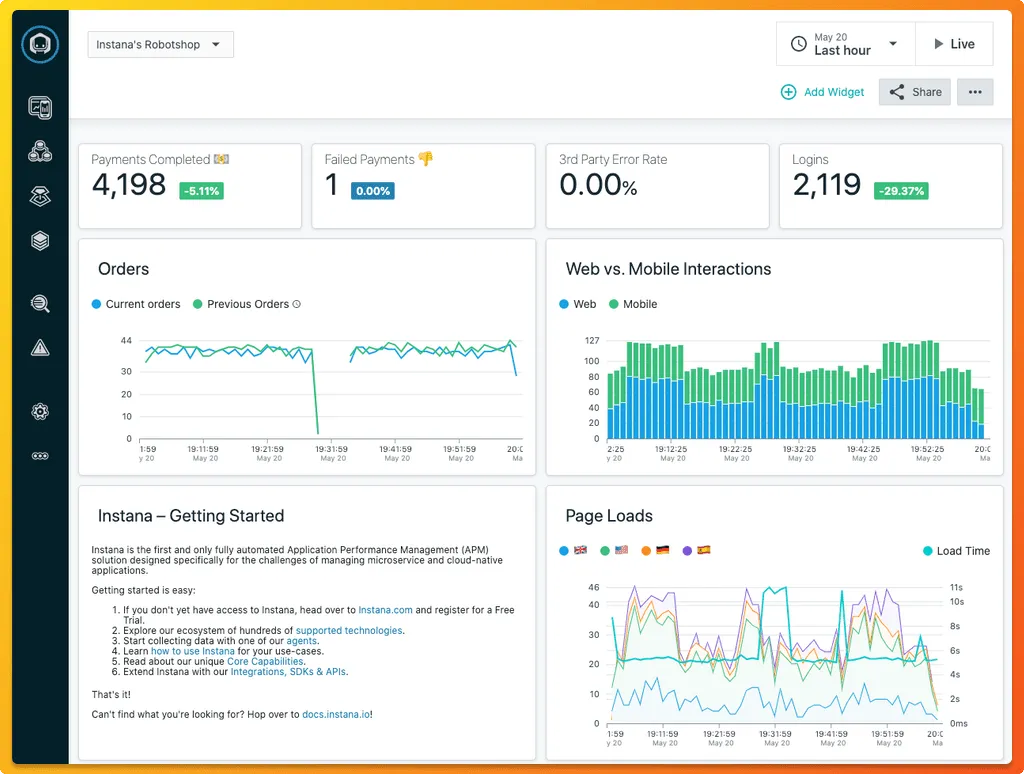
Key Features
Instana auto-discovers services, dependencies, and infrastructure components. Its high-frequency data collection (every second) ensures extremely detailed visibility. The AI-driven root-cause analysis engine highlights performance anomalies automatically.
Pricing
Starts around $75 per host/month, with enterprise pricing for large environments.
Pros
- Excellent automation and high-resolution data.
- Great for containerized and microservice architectures.
- Minimal manual setup required.
Cons
- Expensive for smaller teams.
- UI can feel dense due to data volume.
- Some integration depth depends on IBM stack.
Instana suits modern enterprises running dynamic microservices at scale.
14. Zabbix - Proven Open-Source Infrastructure Monitoring
Zabbix remains one of the most trusted open-source monitoring platforms for infrastructure-heavy organizations.
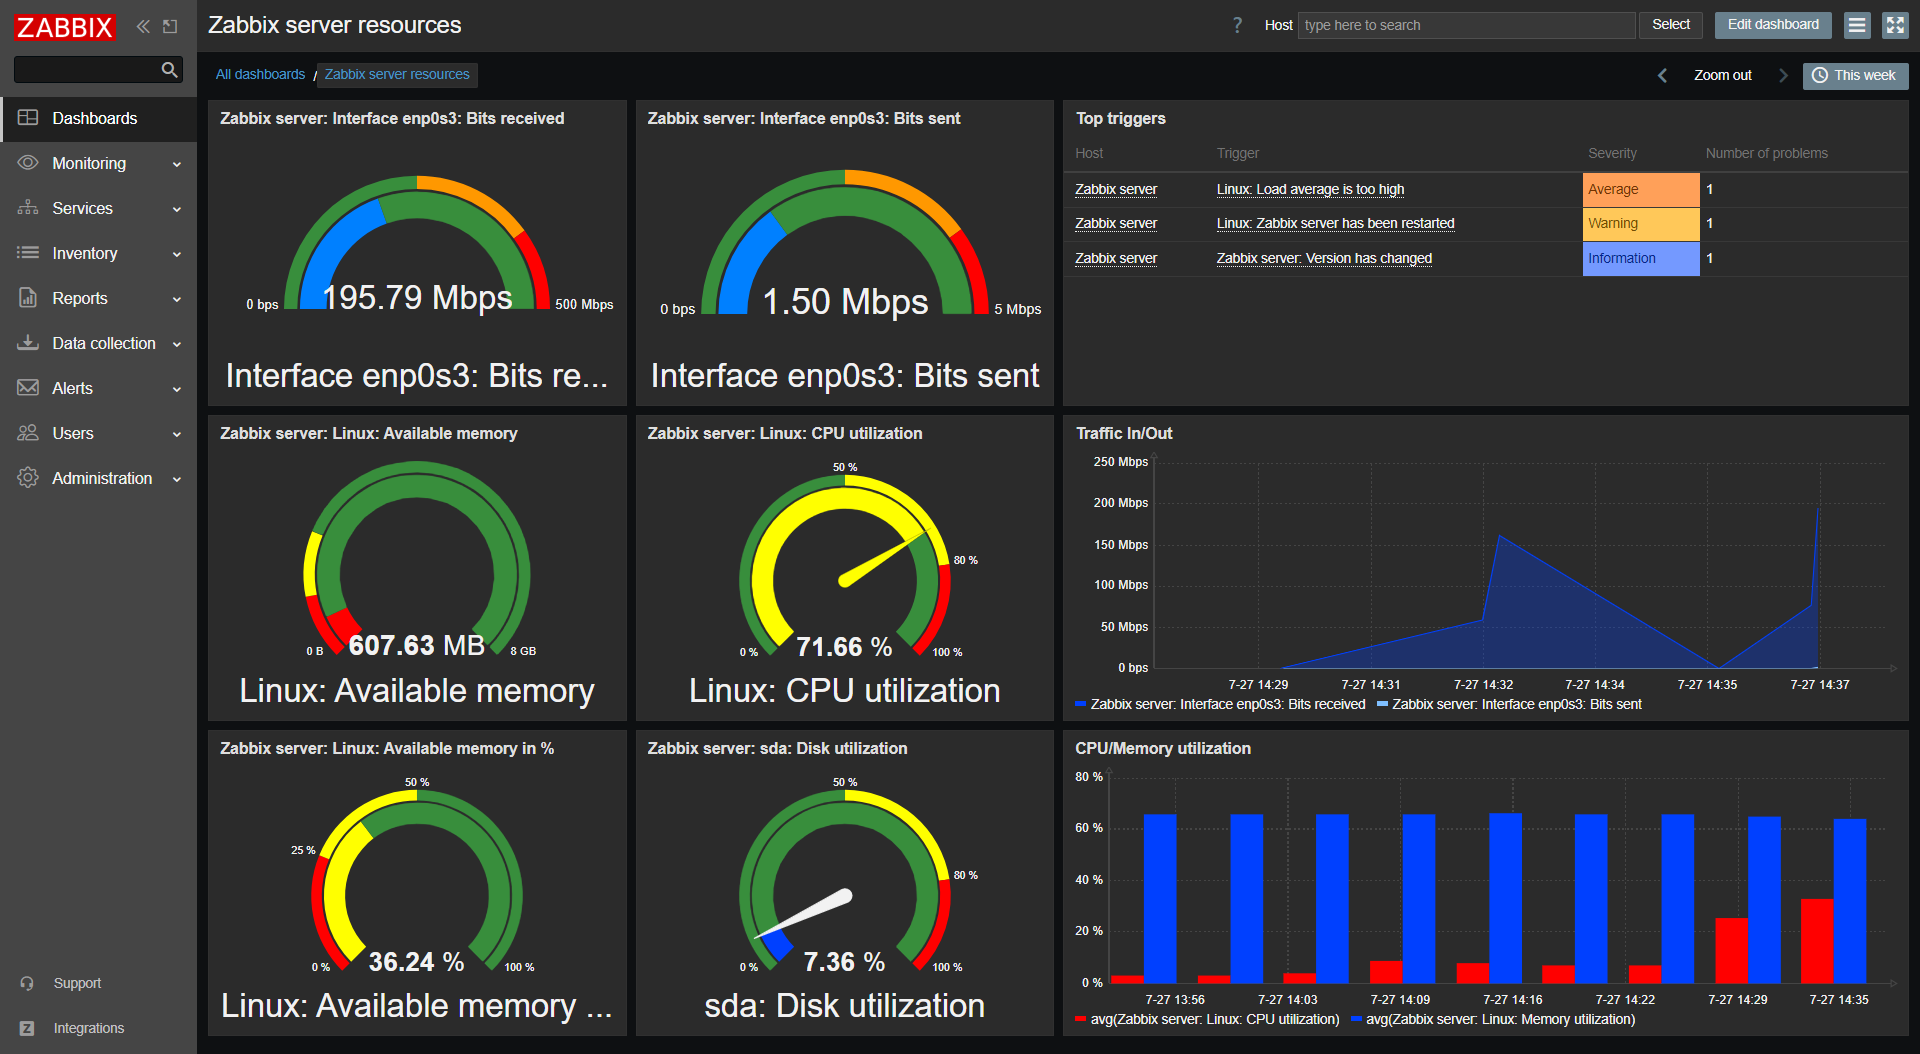
Key Features
It offers agent and SNMP-based monitoring for servers, devices, and networks. Users can create custom dashboards, triggers, and alerts. Zabbix can monitor thousands of nodes simultaneously with the right tuning.
Pricing
Completely free to use. Costs come from hosting, setup, and personnel. Paid enterprise support is available via partners.
Pros
- No licensing cost; complete control.
- Mature, stable, and widely adopted.
- Flexible for organizations that prefer on-premises management.
Cons
- No built-in tracing or log correlation.
- Requires significant configuration effort.
- Steeper learning curve for smaller dev teams.
Zabbix is a reliable choice for organizations prioritizing self-hosted, cost-efficient infrastructure monitoring.
15. Chronosphere - Scale-Ready Metrics Platform
Chronosphere is purpose-built for companies managing thousands of microservices, focusing on controlling observability costs and managing metric cardinality.
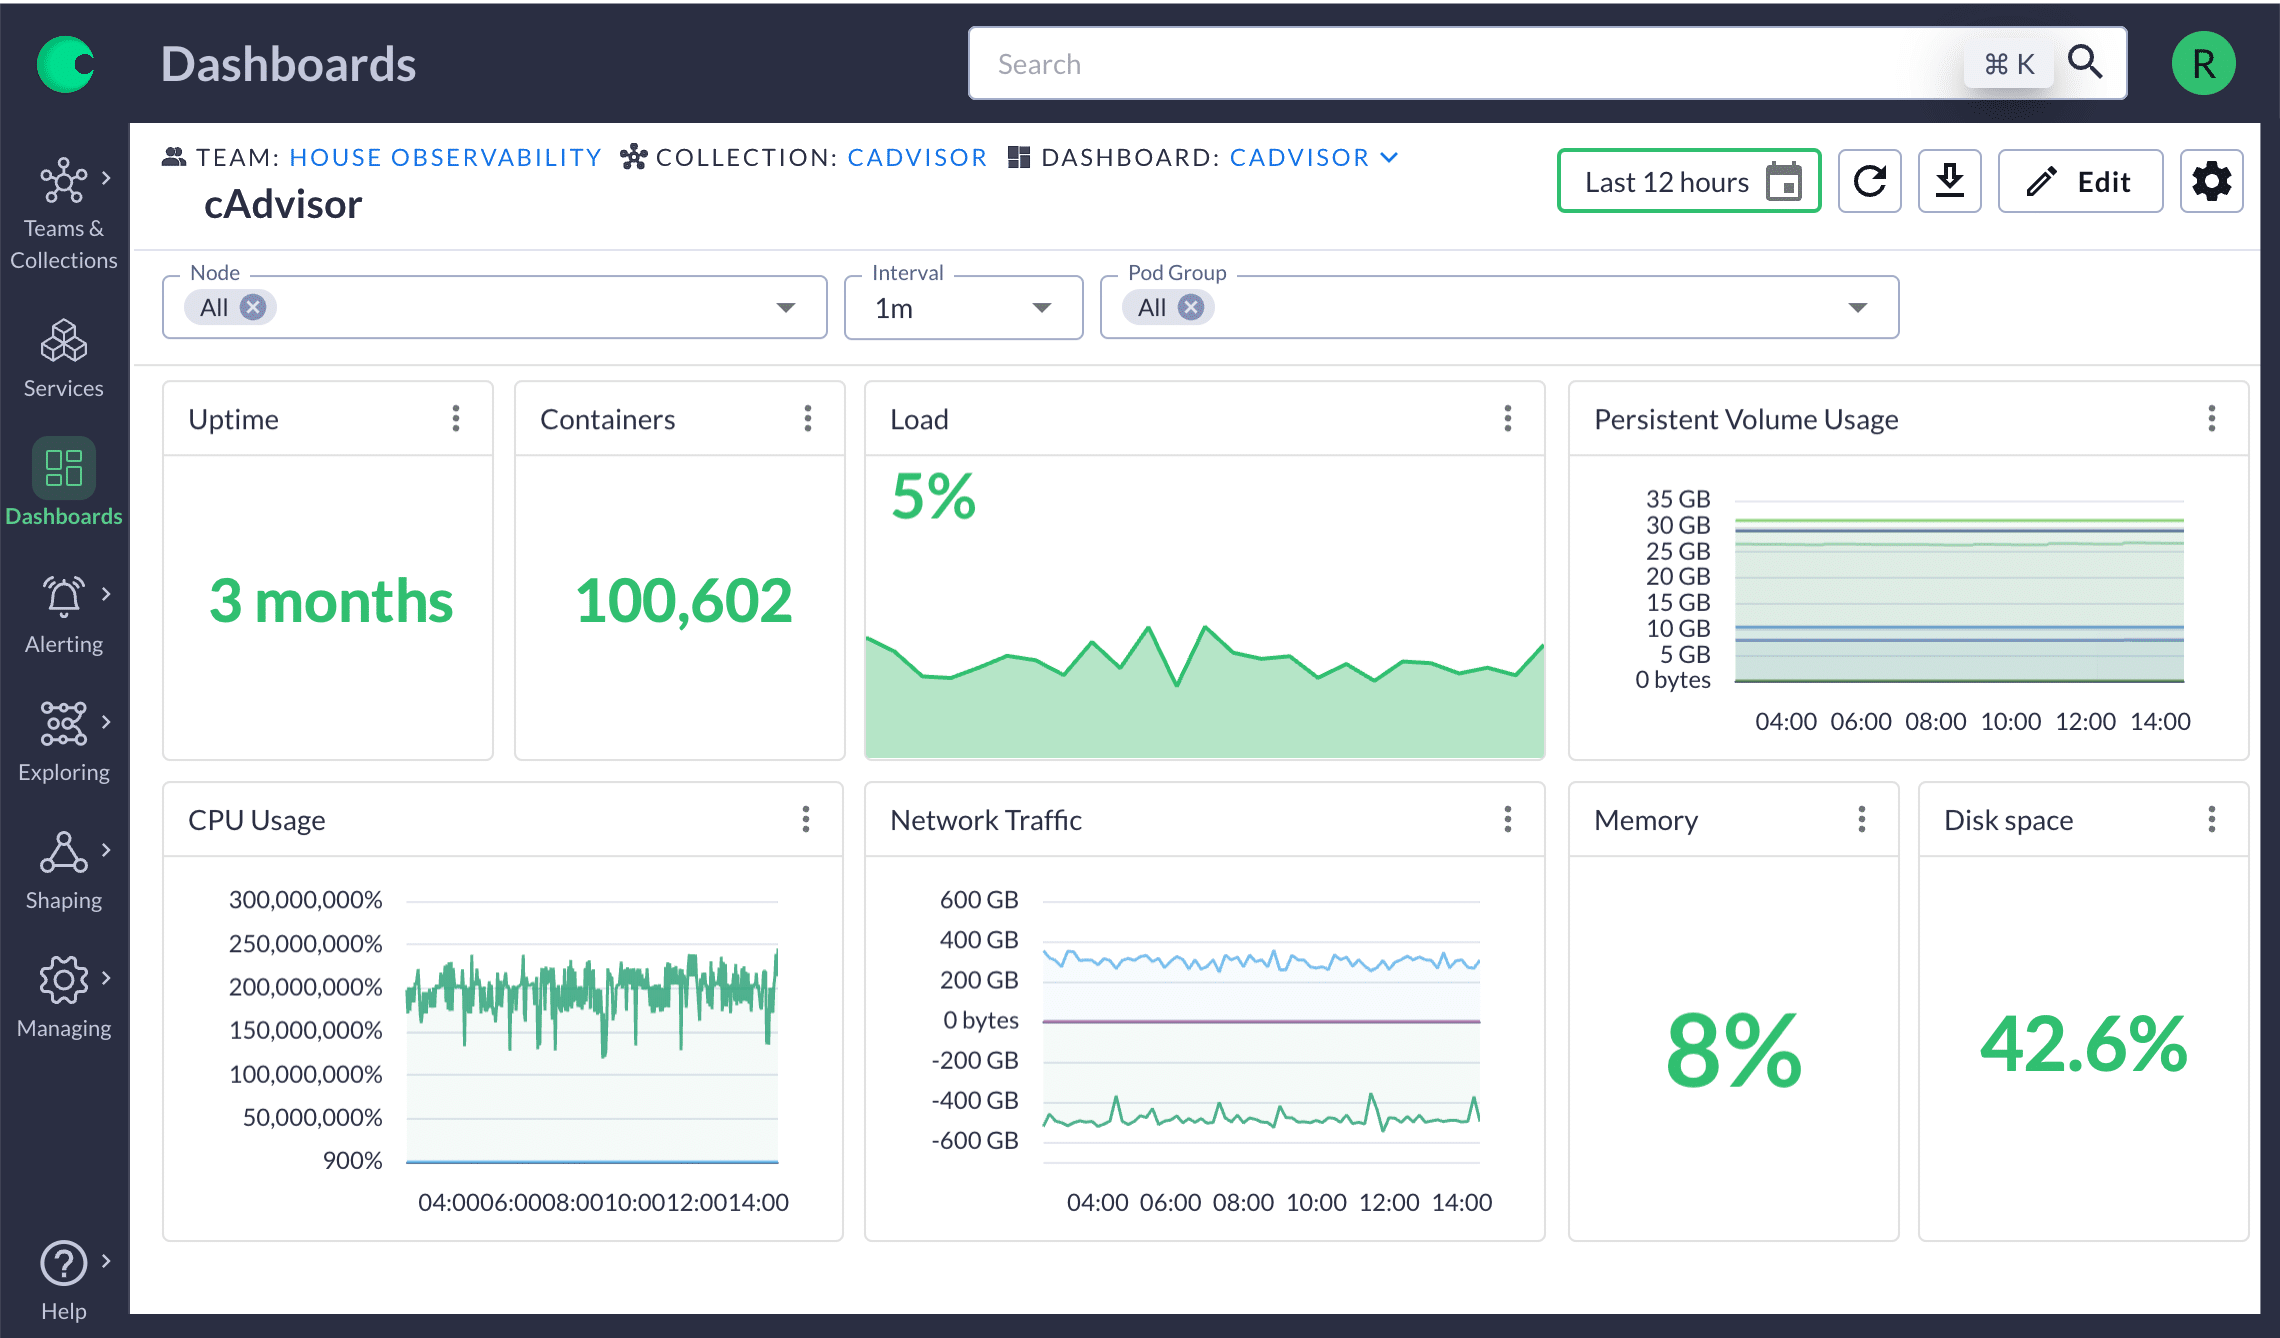
Key Features
It offers high-volume metric ingestion, retention control, and cost optimization. Its dynamic dashboards and metric aggregation let teams keep visibility while minimizing data waste. Chronosphere is architected for massive scale and reliability.
Pricing
Enterprise-only pricing, tailored to ingestion volume and data retention.
Pros
- Excellent performance for large-scale observability.
- Cost control features for managing metric explosion.
- Highly resilient and scalable infrastructure.
Cons
- Complex to deploy for smaller orgs.
- Limited log and trace features.
- High entry price.
Chronosphere is ideal for hyper-scale engineering teams where controlling metric costs is as critical as observability itself.
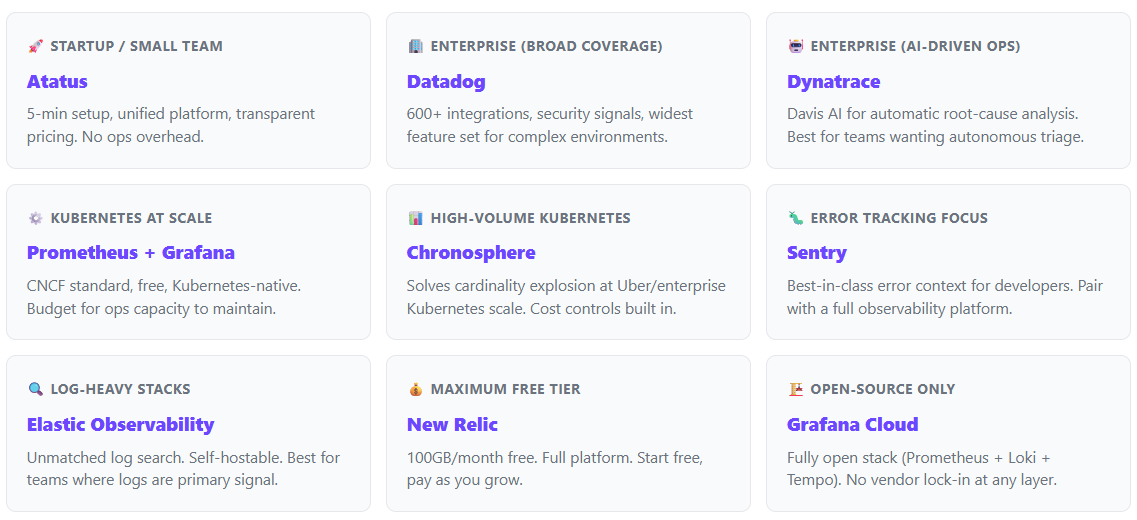
Quick Pick Guide - Which Tool Fits Your Team?
Different teams have different needs. Use this guide to shortlist based on your specific context before evaluating in depth.
How to Choose the Right Observability Tool?
Selecting the right observability platform isn’t about chasing the most popular brand; it’s about aligning capabilities with your technical environment, budget, and long-term operational goals.
Here’s a deeper look at what to consider before making a decision.
Specific Requirements
- Start by defining your team’s core priorities.
- If your goal is deep visibility into application behavior, APM-focused solutions like Atatus, New Relic, or Dynatrace deliver rich transaction traces, database insights, and error analytics.
- For infrastructure and network observability, LogicMonitor, Grafana, or Zabbix are better choices since they specialize in metrics and system-level health monitoring.
- Hybrid teams often benefit from platforms that bridge both.
- For example, Atatus, which integrates APM, logs, and infrastructure monitoring under one interface.
Scalability and Cost
- Every observability tool scales differently and the pricing models vary just as widely.
- For enterprises ingesting massive telemetry data, Splunk or Datadog handle large-scale workloads efficiently, albeit at a premium.
- For cost-conscious startups and mid-sized teams, Atatus, Grafana Cloud, or Elastic provide robust capabilities at predictable, lower price points.
- Always evaluate both the data retention policies and billing transparency, as costs can escalate quickly once your environment expands.
Integration and Ecosystem
- A great observability platform fits seamlessly into your existing workflow.
- Ensure the tool integrates well with your CI/CD pipelines, cloud providers (AWS, Azure, GCP), Kubernetes clusters, and alerting systems like Slack, PagerDuty, or Opsgenie.
- Atatus, for example, supports plug-and-play integrations that simplify observability setup without disrupting ongoing DevOps or deployment processes.
Team Skills and Management Model
- The tool you pick should match your team’s technical maturity.
- Developer-friendly SaaS platforms such as Atatus, Sentry, and New Relic allow teams to get started quickly without managing servers or custom dashboards.
- Conversely, self-managed solutions like Prometheus, Zabbix, or Elastic Stack provide full control but they demand ongoing maintenance, tuning, and scaling expertise.
Still unsure which platform fits your stack?
Our team will walk you through which plan works for your infrastructure with no sales pressure, just an honest 15-minute technical walkthrough.
Which Observability Tool Should You Choose in 2026?
As observability continues to evolve into a core engineering discipline, the focus should be on fit, not flash. The right tool is one that scales with your system’s complexity while keeping costs and workflows manageable.
- For cost-efficient, unified observability: Choose Atatus. It delivers end-to-end visibility from APM to logs, infrastructure, and end-user monitoring in a single, affordable platform.
- For enterprise automation and AI-assisted insights: Dynatrace or Splunk remain strong contenders.
- For open-source flexibility and community-driven innovation: Go with Grafana Cloud or Prometheus.
- For deep debugging and developer-centric workflows: Sentry and New Relic shine.
But heading into 2026, Atatus stands out as the most balanced choice which combining performance monitoring depth, affordability, and ease of use in a way that aligns with modern engineering priorities.
Final Thoughts: Observability in 2026 and Beyond
The observability market is entering a mature phase. What used to be fragmented and separate tools for APM, logs, and infrastructure is now converging into cohesive platforms.
Organizations are moving beyond basic monitoring to reliability-driven engineering, where visibility and cost control are equally important.
Platforms like Atatus represent this new wave: offering complete observability without complexity, giving teams the clarity, control, and scalability needed to keep digital systems resilient and budgets predictable.
You've compared the tools. You know what you need.
Atatus gives you full-stack visibility including APM, logs, RUM, infrastructure in a single platform. No stitching five tools together. No surprise invoices at the end of the month. No week-long onboarding.
Observability in 2026: Common Questions and Expert Answers
1) What features should you look for in an observability tool?
The best observability tools offer unified dashboards, APM, log management, real-user monitoring, alerting, and integrations. Scalability, pricing transparency, and ease of use are equally critical when evaluating a solution.
2) Why is observability important for DevOps teams?
Observability helps DevOps teams detect performance bottlenecks early, understand system dependencies, and automate issue resolution. It supports faster release cycles and ensures consistent reliability across microservices and CI/CD pipelines.
3) Can small teams or startups use observability tools?
Yes. Modern observability platforms like Atatus and Grafana Cloud offer flexible pricing and lightweight setups suitable for small teams. They allow startups to gain full visibility and scale monitoring as their infrastructure grows.
4) What is the difference between APM and observability?
Application Performance Monitoring (APM) focuses on tracking application performance metrics like latency and throughput. Observability extends beyond APM that combining logs, metrics, and traces to understand why performance issues occur across the entire system.
5) What industries benefit most from observability tools?
Observability tools are essential for SaaS, eCommerce, fintech, gaming, and healthcare industries. Any sector that relies on uptime, scalability, and real-time user experience to maintain competitive performance.
6) Which observability tool is best for Kubernetes?
Prometheus + Grafana is the most popular open-source stack for Kubernetes metrics. For managed solutions, Atatus, Datadog, and Chronosphere all offer deep Kubernetes integration. Chronosphere is purpose-built for high-cardinality Kubernetes telemetry at scale.
7) Can I use Atatus as a Datadog alternative?
Yes. Atatus offers unified APM, RUM, logs, and infrastructure monitoring comparable to Datadog's core feature set, typically at a lower price point with faster onboarding (under 5 minutes). It's particularly well-suited for teams who find Datadog's pricing model opaque or the setup process time-consuming.
Continue Exploring – More Tools That Matter
#1 Solution for Logs, Traces & Metrics
![]() APM
APM
![]() Kubernetes
Kubernetes
![]() Logs
Logs
![]() Synthetics
Synthetics
![]() RUM
RUM
![]() Serverless
Serverless
![]() Security
Security
![]() More
More

![New Relic vs Splunk - In-depth Comparison [2026]](/blog/content/images/size/w960/2024/10/Datadog-vs-sentry--19-.png)
![New Relic vs Sentry - Which Monitoring Tool to Choose? [2026]](/blog/content/images/size/w960/2024/10/VS--1-.png)
![Datadog vs Splunk: A Side-by-Side Comparison [2026]](/blog/content/images/size/w960/2024/12/Untitled-design--41-.png)