Top 11 React Chart Libraries to Know

The majority of React applications incorporate some form of data visualization. This is true for all languages, not only React. Some of the most frequent components of mobile and web applications today are charts, graphs, and other sorts of visual representations of data.
JavaScript frameworks like React offer scalability and adaptability, to name a few advantages. With several libraries and components to supplement the built-in functionality? The vast majority of developers rely on third-party libraries or services.
You should think about a few things before incorporating any library or component into your React project. You should consider the quality of documentation, the influence on performance, library dependencies, and license and maintenance charges in addition to the capabilities a chart library offers.
We've compiled a list of the top 11 React charts and data visualization frameworks to help you compare your alternatives.
Here’s how it is done:
- Recharts
- react-chartjs-2
- Victory
- react-vis
- Nivo
- BizCharts
- Visx
- React Timeseries Charts
- Rumble Charts
- vx
- React Stockcharts
#1 Recharts
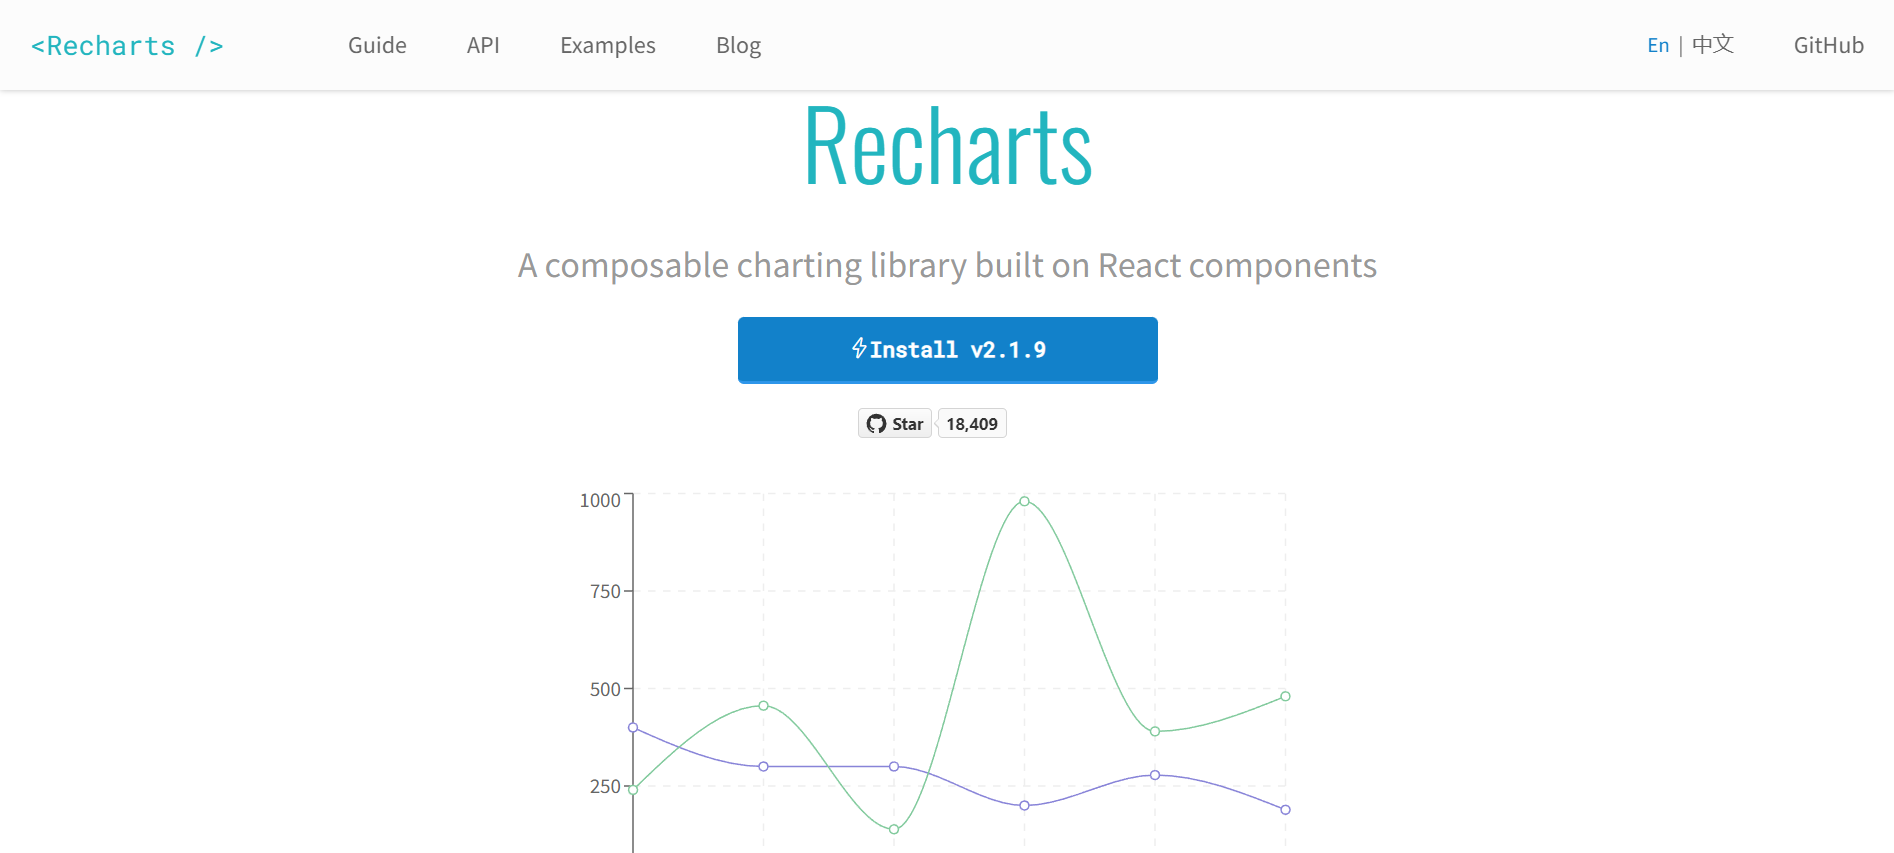
Recharts is a redefined chart library built with D3 and React that has 18.4k stars on GitHub. Recharts is one of the most popular charting libraries for React, and it comes with excellent documentation and project maintainers.
Recharts follow the component principle of React by allowing users to create charts using reusable React components. It only supports SVGs for drawing and does not support mobile devices.
Recharts come with a set of stunning charts that can be customized by changing the existing component's props or adding new ones. The charts are not responsive by default, however, a wrapper component can be used to make them responsive.
Recharts has a significant user base and community because it has been around for a long time. Recharts can be easily installed using npm or yarn, or by using its CDN.
Features:
- Composable
- Extensive documentation
- Powerful
- SVG charts
- Very Lightweight
#2 react-chartjs-2
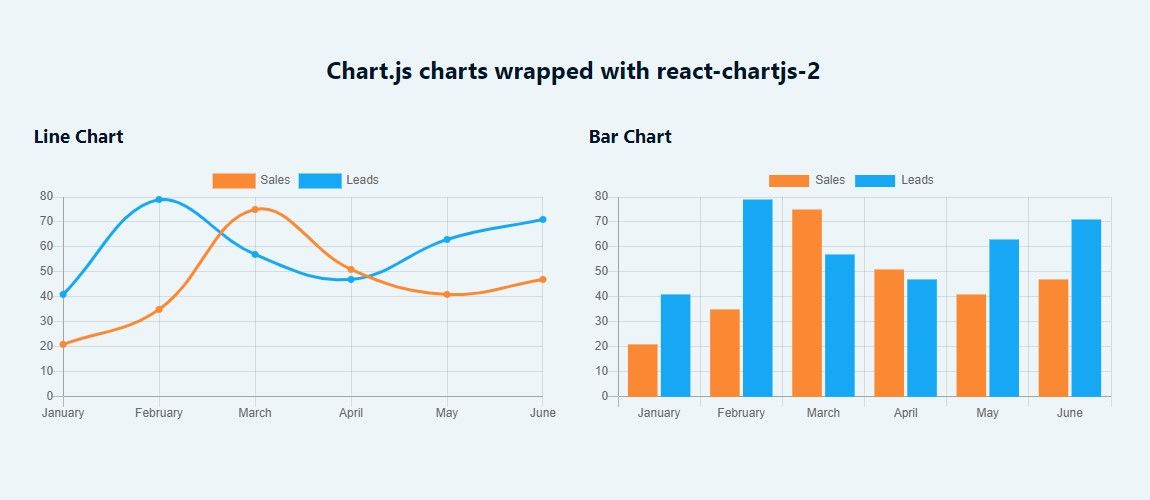
This library is more of a React wrapper for the popular JavaScript charting library chartjs than it is a React chart library. Charts.js is a small chart toolkit that uses HTML5 Canvas elements to create responsive chart components. It comes pre-loaded with six different chart layouts and is noted for being user-friendly.
Both React and Vue.js use Chart.js extensively, with each having its wrapper library. This library is a React wrapper, however, keep in mind that you'll be referring to Chart.js' documentation the majority of the time. It's thankfully quite thorough, and the community support is also noteworthy.
react-chartjs-2, the wrapper library, has 5.1K ratings on GitHub and 598K weekly npm downloads. Line, Bar and HorizontalBar, Doughnut and Pie, Bubble, Polar, Radar, and Scatter are among the 9 components included in React-chartjs-2.
Feature:
- Easy to use
- Flexibility
- Integration with React
- Simplicity
#3 Victory

Victory is a collection of React and React Native charting components. For easy cross-platform charting, it uses the same API for web and Reacts Native applications. Victory is a flexible charting tool that allows you to quickly integrate line, bar, pie, and candlestick charts into your applications.
Victory is described as "an opinionated, yet fully overridable, an ecosystem of composable React components for constructing interactive data visualizations" in the official documentation.
Victory, like many of the other React chart libraries on this list, was created using React and D3. It comes with a large number of fully configurable charts right out of the box.
The fact that it was built by Formidable, a well-known company with highly skilled developers and designers all across the world, is one of the reasons for its success. Victory has 9.7K GitHub stars and a 166K weekly npm download rate.
Feature:
- Animations, zooming, and transitions are all supported
- Flexible documentation
- Has all of the basic charts and is a fantastic starting point for creating custom charts
- Supports action-based events
#4 react-vis
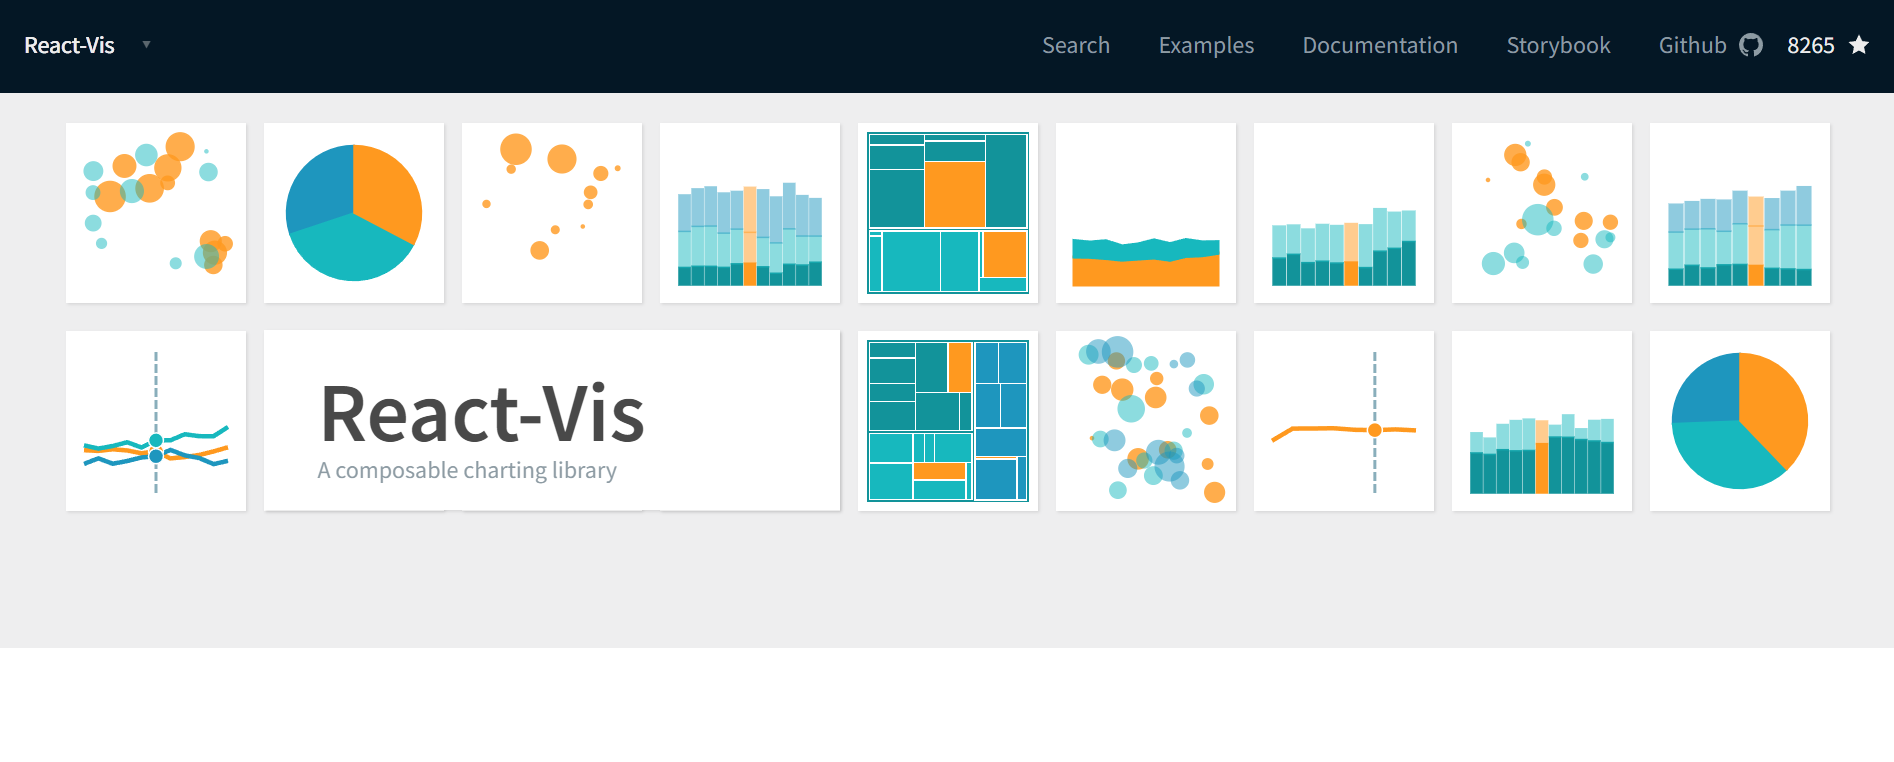
React-vis is a set of React components that can be used to create common data visualization graphs. Heat maps, scatterplots, contour plots, hexagon heatmaps, pie and donut charts, sunbursts, radar charts, parallel coordinates, and tree maps are examples of these.
If you've ever worked with React components, you'll find it easy to work with react-vis components because they work in the same way, with props, children, and callbacks.
React-vis may not be your first pick, with only 8.3K stars on GitHub. Users, on the other hand, have praised the documentation. Uber offers one for you if you're seeking ease of use and a library where you can learn faster than you can order.
Feature:
- Easy to use
- Flexibility
- Integration with React
- Simplicity
#5 Nivo
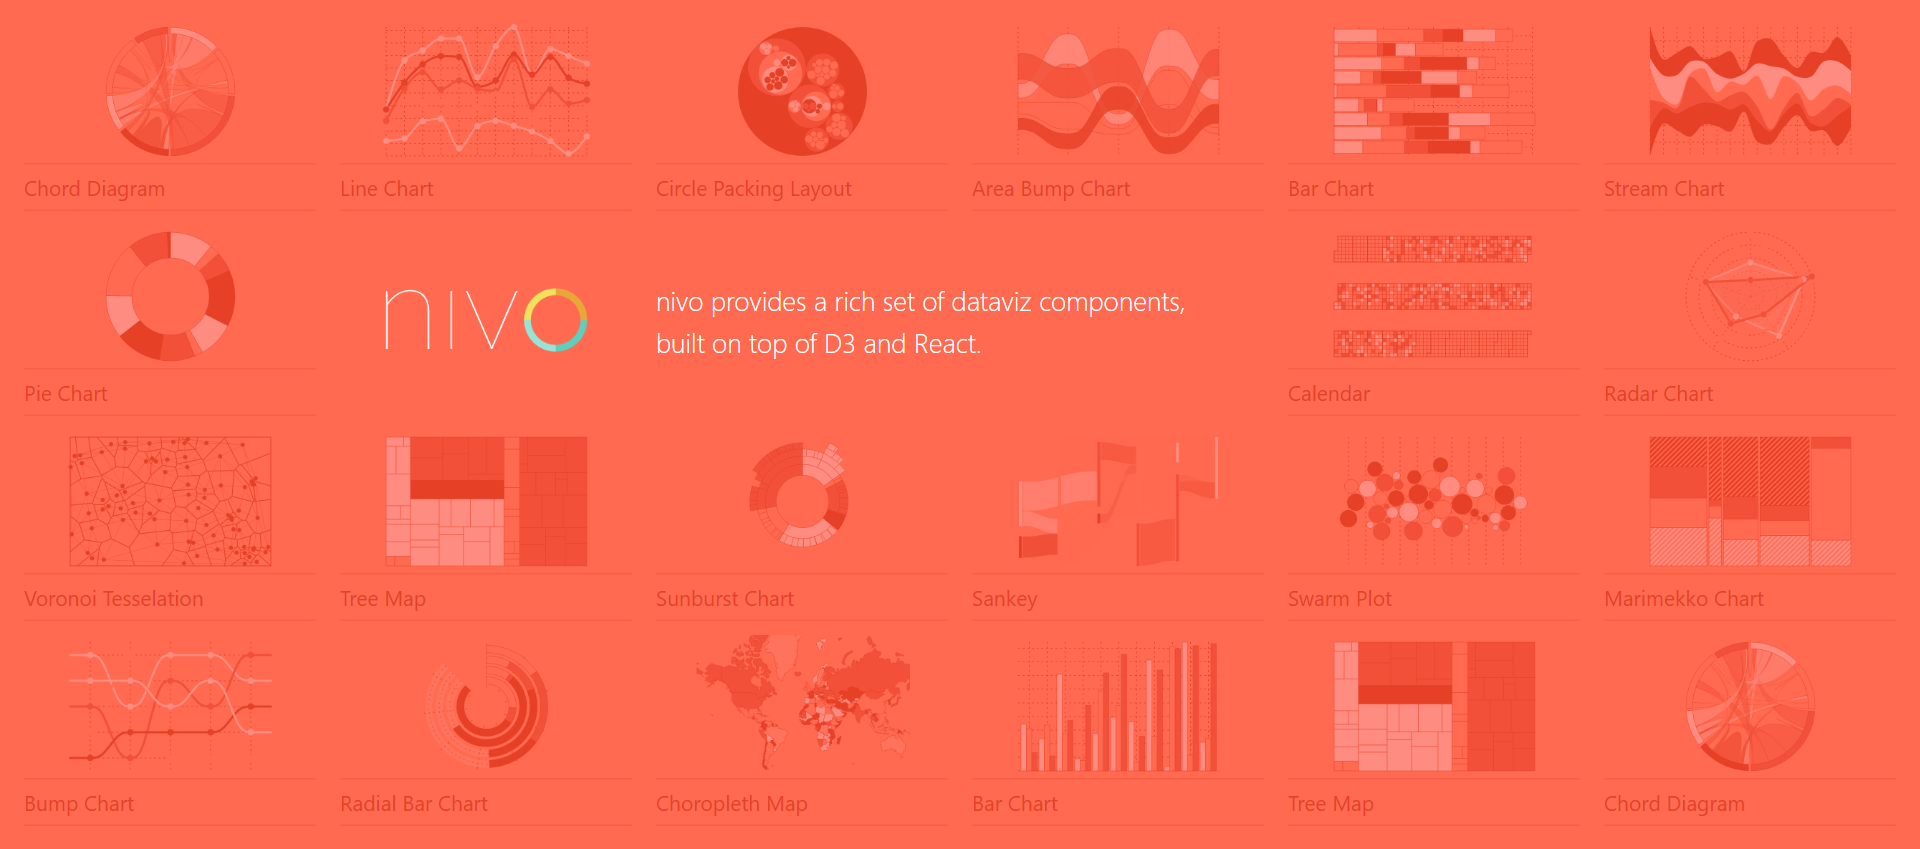
Nivo, like many other React chart libraries, was created with React and D3 and offers a wide range of chart styles and designs. The library includes HTML, Canvas, and SVG charts, as well as client and server-side rendering and animation capabilities.
It includes a large number of attractive charts that can be easily customized if necessary. Many of the charts it offers are responsive by default, meaning they respond to change screen widths. Nivo also supports React Motion-powered motion and transitions.
Nivo has over 10.2k GitHub stars at the time of writing. It has a lively community and active maintainers, as well as a gorgeous website with complete documentation that makes getting started simple. Nivo may be set up with either npm or yarn.
Feature:
- Customizable styling and functionality without needing to modify the code
- Scalable SVG charts
- Server-side rendering API
- Transitions and animations are supported
- User-friendly documentation
#6 BizCharts
Alibaba is another well-known business having it is own React chart library on GitHub. Their library focuses on G2 and React charting for business applications.
BizCharts features a fantastic template library and is compatible with the ES6 React syntax. The paperwork and the gallery itself, however, are in Chinese. This React chart library has a limited, largely Asian audience, with 5.9K stars on GitHub and a weekly download volume of 24K npm downloads.
Feature:
- Easy-to-use
- Strong expandability
- Support most data visualization charts
- Uses React es6 grammar
#7 Visx
Visx, a new name in the field of React Chart Libraries developed by Airbnb, has received around 15.3k stars on GitHub, which is a significant success. The most significant advantage of utilizing Visx as an active repository is that it systematically blends the benefits of React DOM with D3.js.
The developers of Visx do not claim that it is a react chart library. This is exciting news. Rather, they regard it as a collection of low-level graphical components that can be easily reused.
To acquire a better and expanded grasp of how this simple-to-use platform works, one may also look at the Bar Chart Example Code.
Feature:
- Calculations are performed with the help of d3
- Simple to use
- You have the option of creating your reusable chart components
#8 React Timeseries Charts
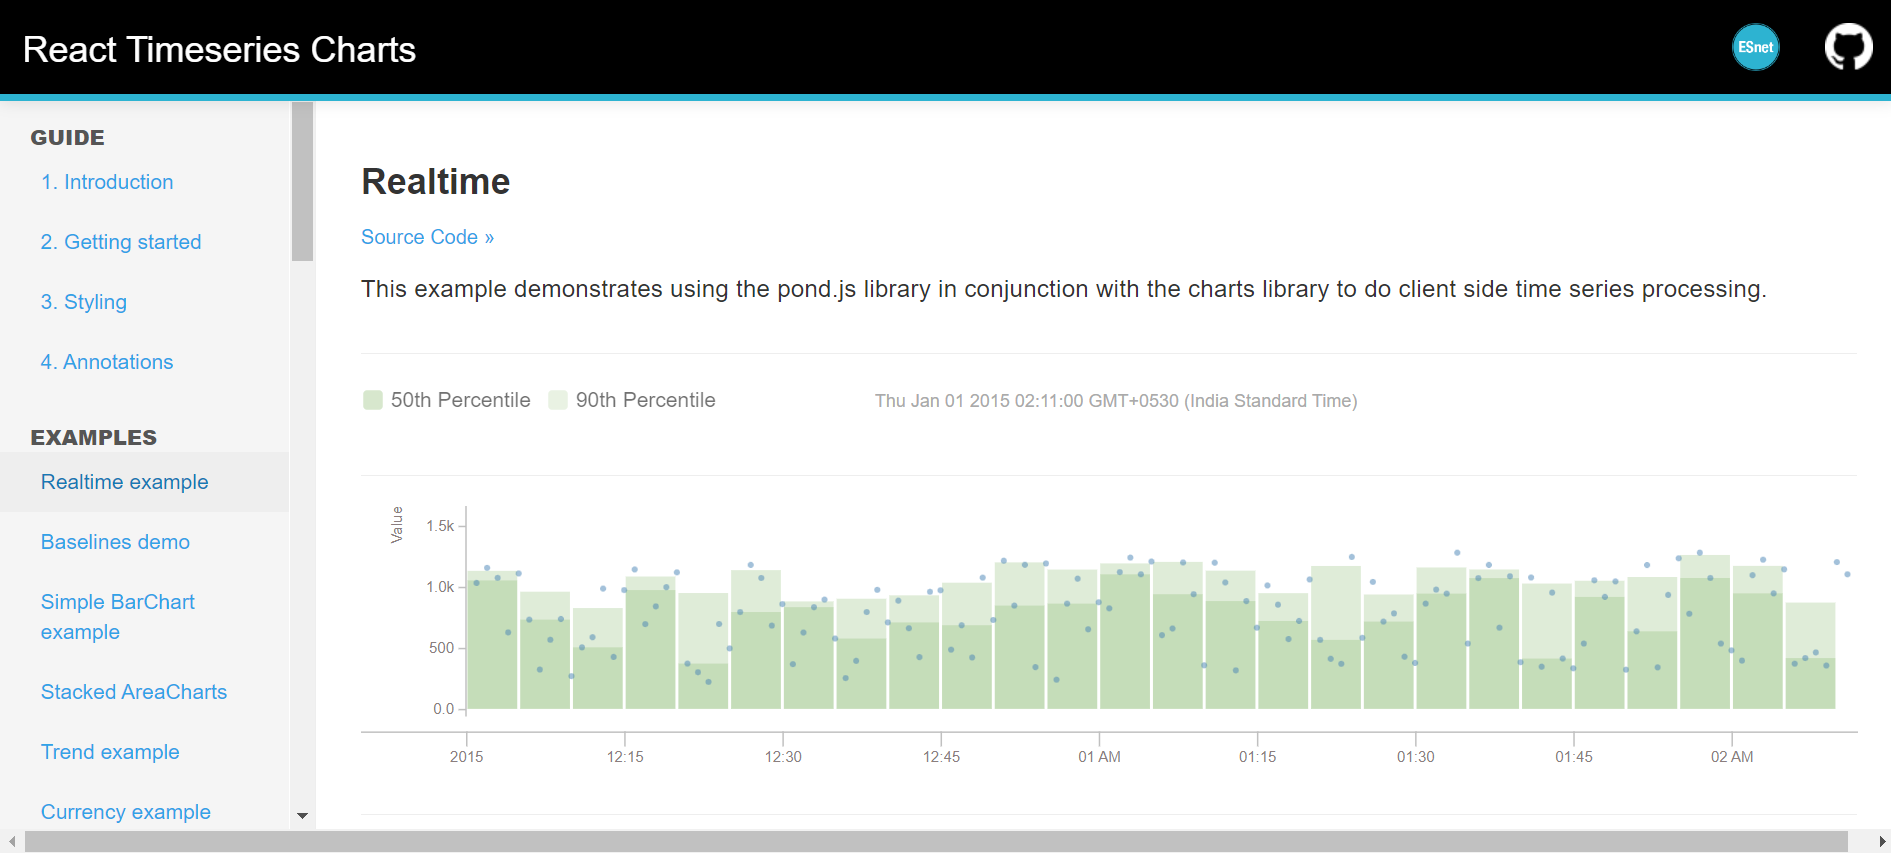
You've found it if you're looking for a React library that focuses on time series components. This library provides a set of modular charting components for React that can be used to view time-series data, such as network traffic statistics. Low-level elements are created with D3, whereas higher-level components are created with React.
Although this library isn't regularly developed, it makes up for it with extensive documentation and examples. This react-timeseries-charts has 783 stars on GitHub and a weekly download volume of 3K npm downloads.
Features:
- Add your chart types and overlays with ease
- Chart pan and zoom constraints
- Interactivity, highlighting, and selection
- Multiple compositions into axis, rows, and overlays
- The declarative layouts of charts with JSX
#9 Rumble Charts
Rumble-charts is a simple and subtle React charting and visualization library. Rumble Charts is a react component that allows you to create flexible and composable charts. It's powered by D3.js under the hood, although you won't notice it most of the time.
"React components for constructing composable and flexible charts to visualize your data," according to the library's developers. It's powered by D3.js and, unfortunately, isn't well-maintained or updated with new features regularly.
This rumble-charts has 327 stars on GitHub and a weekly download volume of 281 npm downloads.
Feature:
- Based on D3.js under the hood
- Built-in functionality to use labels
- Composable
- Flexible
#10 VX
vx is a set of low-level visualization components that combine the power of d3 for the visual generation with the advantages of React for DOM updating. vx is designed to be built on top of and is essentially opinion-free. It is possible to reduce the bundle size by only using the items that are required.
vx uses d3 for calculations and math under the hood. It's simple to design a component API that conceals d3 totally if you're building your own great chart library on top of vx. As a result, your team might easily construct charts utilizing reusable react components.
vx has a weekly download volume of 832 downloads.
Feature:
- Easily build your reusable visualization charts
- Includes predefined and customizable vision functions
- Utilizes D3
#11 React Stockcharts
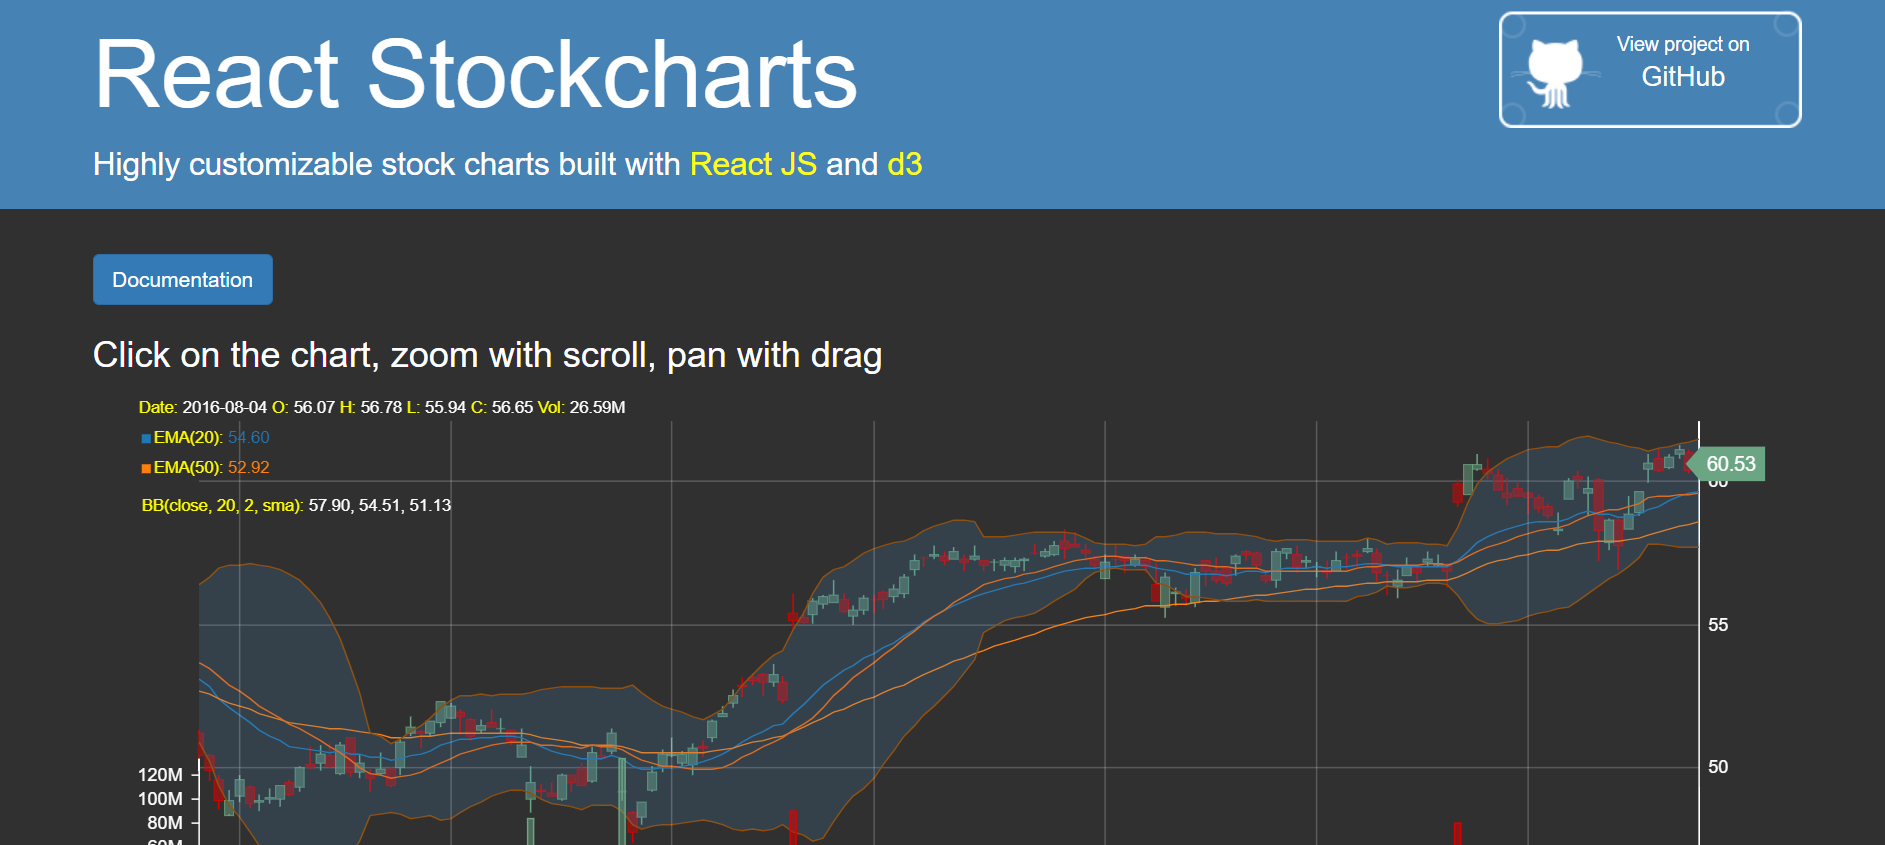
React Stockcharts is a react chart library that is a must-have for anyone who wants to view their stock chart data in a variety of styles that are both flexible and easy to grasp. React stock charts are a one-stop shop for web developers looking for a framework to handle their financial data visualization needs.
Using charting and range tools, you can track and display the stock price of any company over a given period. To make stock charts more interactive, the component includes zooming, panning, tooltips, crosshairs, trackballs, period selectors, range selectors, and events.
On GitHub, the platform has 3.5k stars and includes more than 60 technical indications. Many individuals, however, are unaware that this react chart library does not provide frequent updates or other maintenance.
Feature:
- Highly customizable stock charts
- Provides a flexible API to create charts
Wrap Up!!!
There are far too many charting libraries for React to cover in a single article, but the five libraries listed above are among the most popular and well-liked in the community.
When choosing a chart library for your React project, keep in mind that they were all developed to assist developers in achieving a certain goal. Examine their features and functions before picking which is appropriate for your project. Some chart libraries are better suited to smaller projects, whereas others are better suited to larger ones.
In the end, the React chart library you select will be determined by your project requirements and the types of features you prefer to use.
Monitor Your Entire Application with Atatus
Atatus is a Full Stack Observability Platform that lets you review problems as if they happened in your application. Instead of guessing why errors happen or asking users for screenshots and log dumps, Atatus lets you replay the session to quickly understand what went wrong.
We offer Application Performance Monitoring, Real User Monitoring, Serverless Monitoring, Logs Monitoring, Synthetic Monitoring, Uptime Monitoring, and API Analytics. It works perfectly with any application, regardless of framework, and has plugins.

Atatus can be beneficial to your business, which provides a comprehensive view of your application, including how it works, where performance bottlenecks exist, which users are most impacted, and which errors break your code for your frontend, backend, and infrastructure.
If you are not yet an Atatus customer, you can sign up for a 14-day free trial.
#1 Solution for Logs, Traces & Metrics
![]() APM
APM
![]() Kubernetes
Kubernetes
![]() Logs
Logs
![]() Synthetics
Synthetics
![]() RUM
RUM
![]() Serverless
Serverless
![]() Security
Security
![]() More
More