Top 7 Real User Monitoring (RUM) Tools and Software for Better User Experience in 2025
As a software-based company, the most critical thing you can do is maintain control over your users' digital experiences and satisfaction levels. However, without a monitoring plan and technologies that allow you to see how customers interact with your application or website from their perspective is impossible. They provide you with the information you need to determine how well your webapp or website is operating and to avoid slow pages or screens that drive customers to your competitors.
Real user monitoring (RUM) solutions are the term for these tools. This article will look at the best ones on the market right now and explain everything you should know before buying one.
We will cover the following:
What is Real User Monitoring?
Real user monitoring, often known as real user metrics, end-user experience monitoring, or simply RUM, is a technique for tracking how users interact with a website. This is used to learn how your customers interact with your website, applications, or any other cloud-based application.
It provides data on users and their actions on a virtual platform, such as cloud applications or a website, to the owners. This technique's data is used to better understand your customers and turned into useful insights.
It helps business owners deliver a better user experience. These strategies are commonly used by businesses to better understand their customers and their changing behaviors.
Real user monitoring is a type of passive web monitoring because it relies on background services analyzing the system.
Why is RUM Important?
The most common concerns among website owners are website availability, error rates, and response times. Real user monitoring provides continuous checks on these two parameters, both for the entire website and for each part.
Response time, often known as load time, is divided into several categories. These include the time it takes for the website's title to appear, the time it takes for text to appear, and the time it takes for interactive components like links to activate. The load times for images on a website and for services like a video player to be fully operational are also worth measuring.
The performance of drop-down menus, choose lists, and autocomplete functionalities, as well as the playback performance of a video on a page, can all be measured once the page has loaded.
With real-time user monitoring, error rates can be fine-tuned. It is possible to determine whether a load error occurs only once, several times, or all the time. An unusual load issue could be caused by services beyond the website's operator's control, such as the user's browser or a lost connection to the webserver.
7 Best Real User Monitoring in the Market
Here are our 7 best real user monitoring services:
#1 Atatus
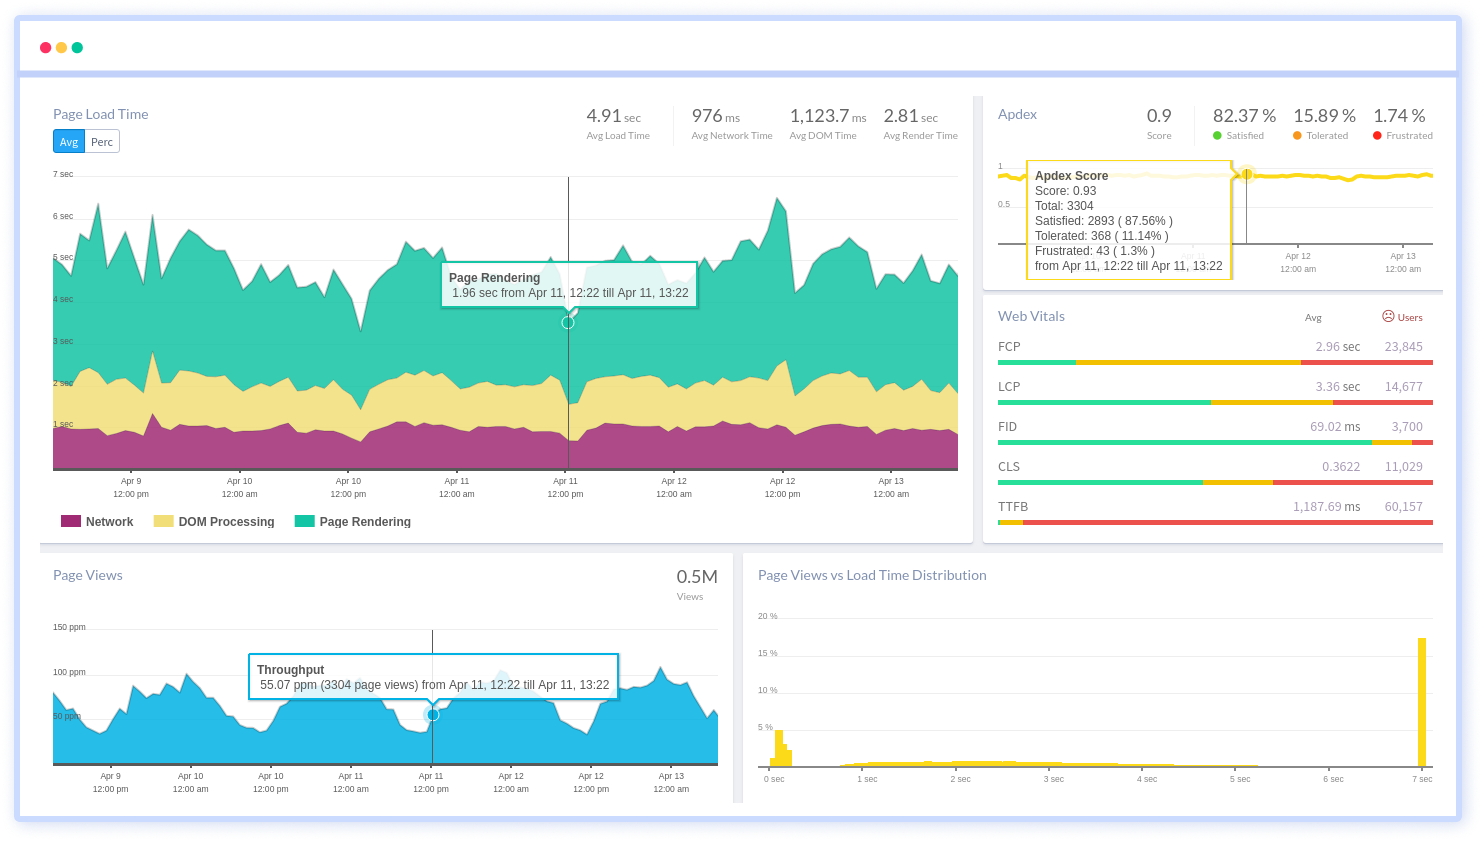
Atatus is a scalable, real-time monitoring system that helps you understand your front-end performance and issues, as well as gain visibility into your website's poor-performing parts that are harming your end-users.
We collect crucial performance data for Google's Core Web Vitals and other web vitals to assist you to figure out what's causing bad performance at the user level whether they're having problems engaging with the website, seeing unexpected changes, or it's taking too long to load.
You can get a thorough picture of each page-load event to quickly detect and fix front-end performance issues affecting real users. In a detailed full resource waterfall view, you can identify which assets are slowing down your pages by filtering data by URL, connection type, device, country, and more.
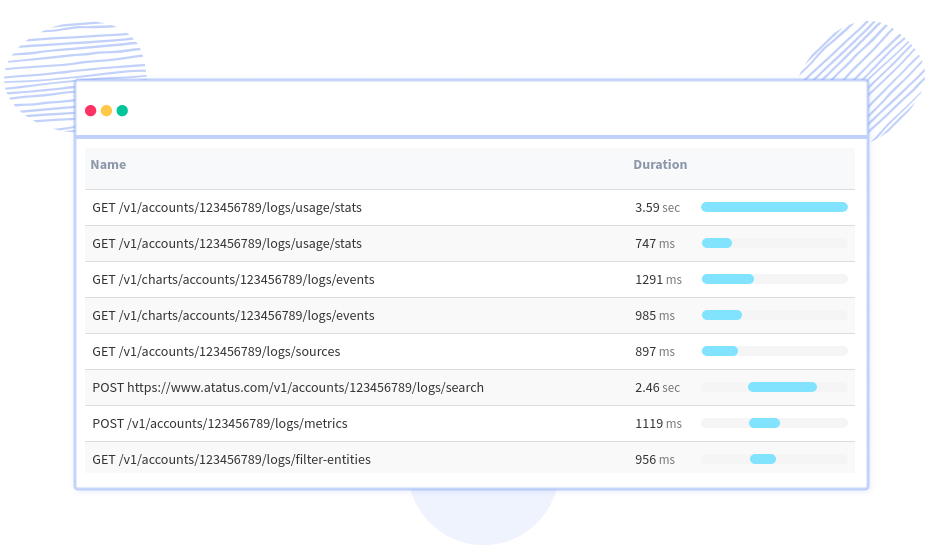
Without having to wait for a page to load, gain insight into performance and user behavior. The performance of Single Page Application route updates can be viewed without the JavaScript framework, revealing how user interactions affect the user's experience after the page has loaded.
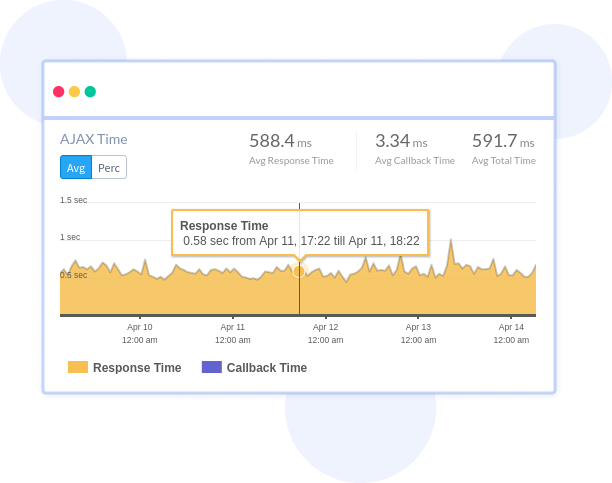
You can figure out which page visits are calling the server-side controller by looking at response time, call-back time, throughput, HTTP errors, data transfer size, and more. You can also learn how bad AJAX queries affect page load time and the digital experience of users.
Features:
- Detailed stack trace
- Real-time alerts
- AJAX request monitoring
- Customized reporting
- Daily email summaries
Pricing:
Atatus charges based on usage. It's based on hosts per hour/month, page visits, or log size, depending on the service. RUM costs $1.96 per month for 10,000 views.
#2 Pingdom
Pingdom has two different service options. Its Real User Monitoring service and its Synthetic Monitoring system are two of them. Both plans can be purchased to acquire a complete collection of website performance assessment tools.
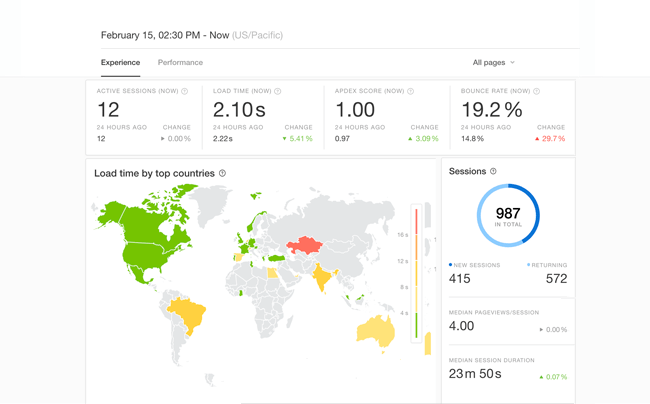
Pingdom's Real User Monitoring service provides information on the effectiveness of marketing efforts and the performance of website services. The Pingdom Real User Monitoring dashboard's main screen displays a world map with color-coded traffic levels per country.
This map displays the website's load times when accessed from various countries. The number of live connections to the website and the ongoing bounce rate observed over the previous 24 hours is two more significant indicators that are instantly available.
The dashboard is divided into screens for better user experience and system performance. The user experience data displays the most popular access devices and browser types among visitors. The system also keeps track of customer happiness.
The performance data is saved on the Pingdom server and can be analyzed over time. This helps detect performance issues caused by new pages or features. A report-generating module of the Pingdom service allows for ad-hoc performance analysis.
Features:
- Display visitor locations on a map
- Average response time
- The volume of live access counts
- Correlation with system performance
- Performance alerts
Pricing:
Standard features start at around $ 42 per month and scale up to $ 228 per month for a professional set of features. This cost covers server monitoring, alerting, and transaction monitoring, among other things.
#3 Datadog
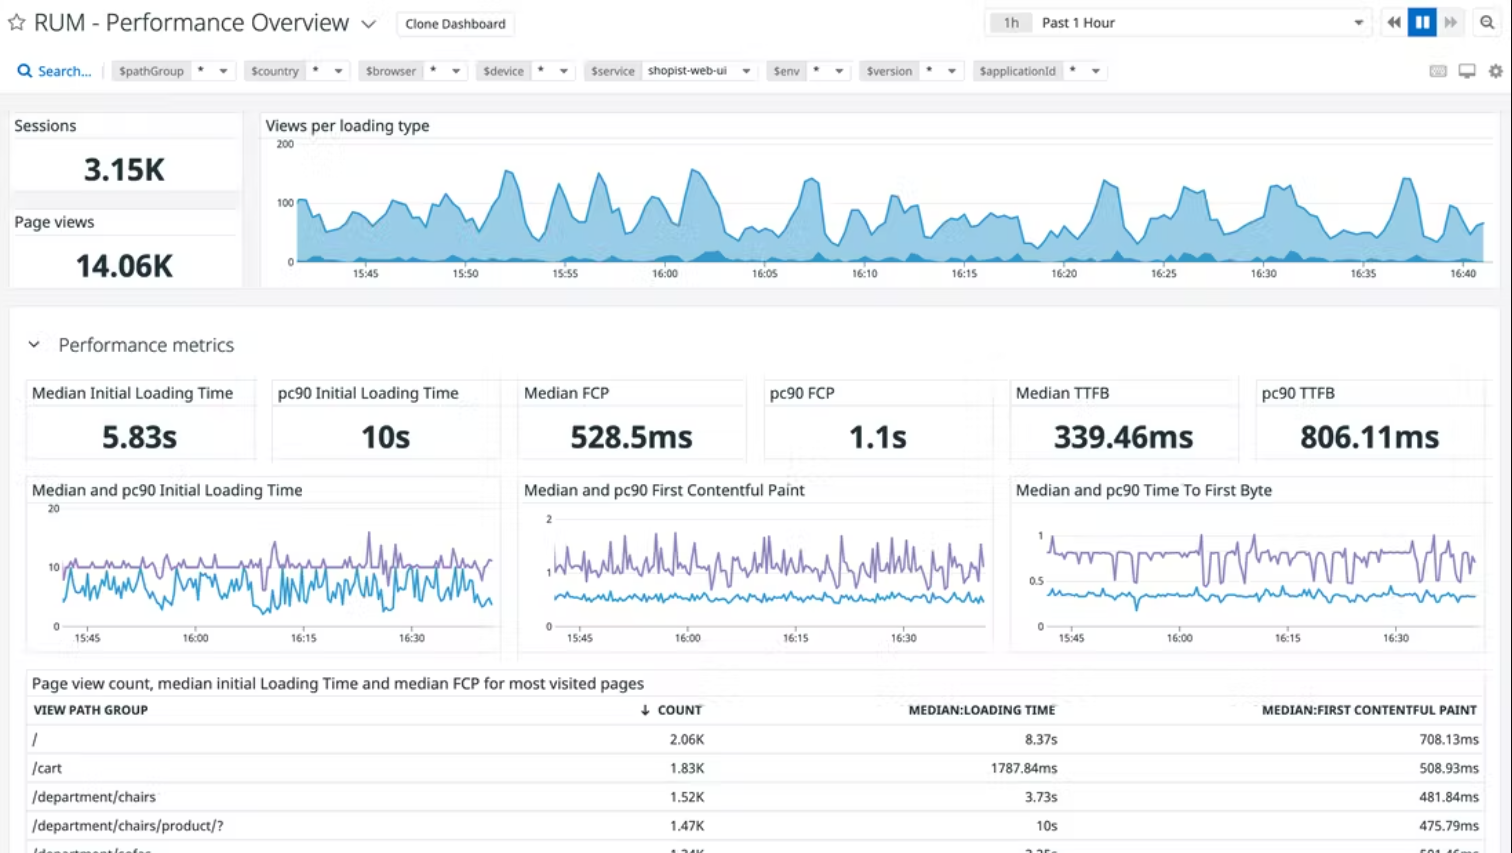
Datadog's Real User Monitoring solution effectively monitors load times, error rates, and service dependencies, and shows performance data in a cluttered graphics-packed dashboard.
Performance expectation thresholds and alerts for when certain levels drop are included in the real user monitoring service. As a result, website administrators will only need to enter the dashboard when notified of potential problems.
Even while the dashboard's crowded data screens can be a lot to take in, they eliminate the need to switch between screens to receive a complete picture of a website's performance. Deep dive screens are less crowded, and they include tools for debugging common errors and determining the source of delivery issues.
Users can access aggregated data by country, device, browser, OS, and session type on analysis panels. Data representation and time horizon options are available in this interactive data explorer. Investigations of actions and events are also possible.
Features:
- Dashboard screens packed with graphs
- Dependency mapping
- Analysis tool
- Performance alerts
Pricing:
Datadog Real User Monitoring is charged a subscription rate per 10,000 page views.
#4 Sematext
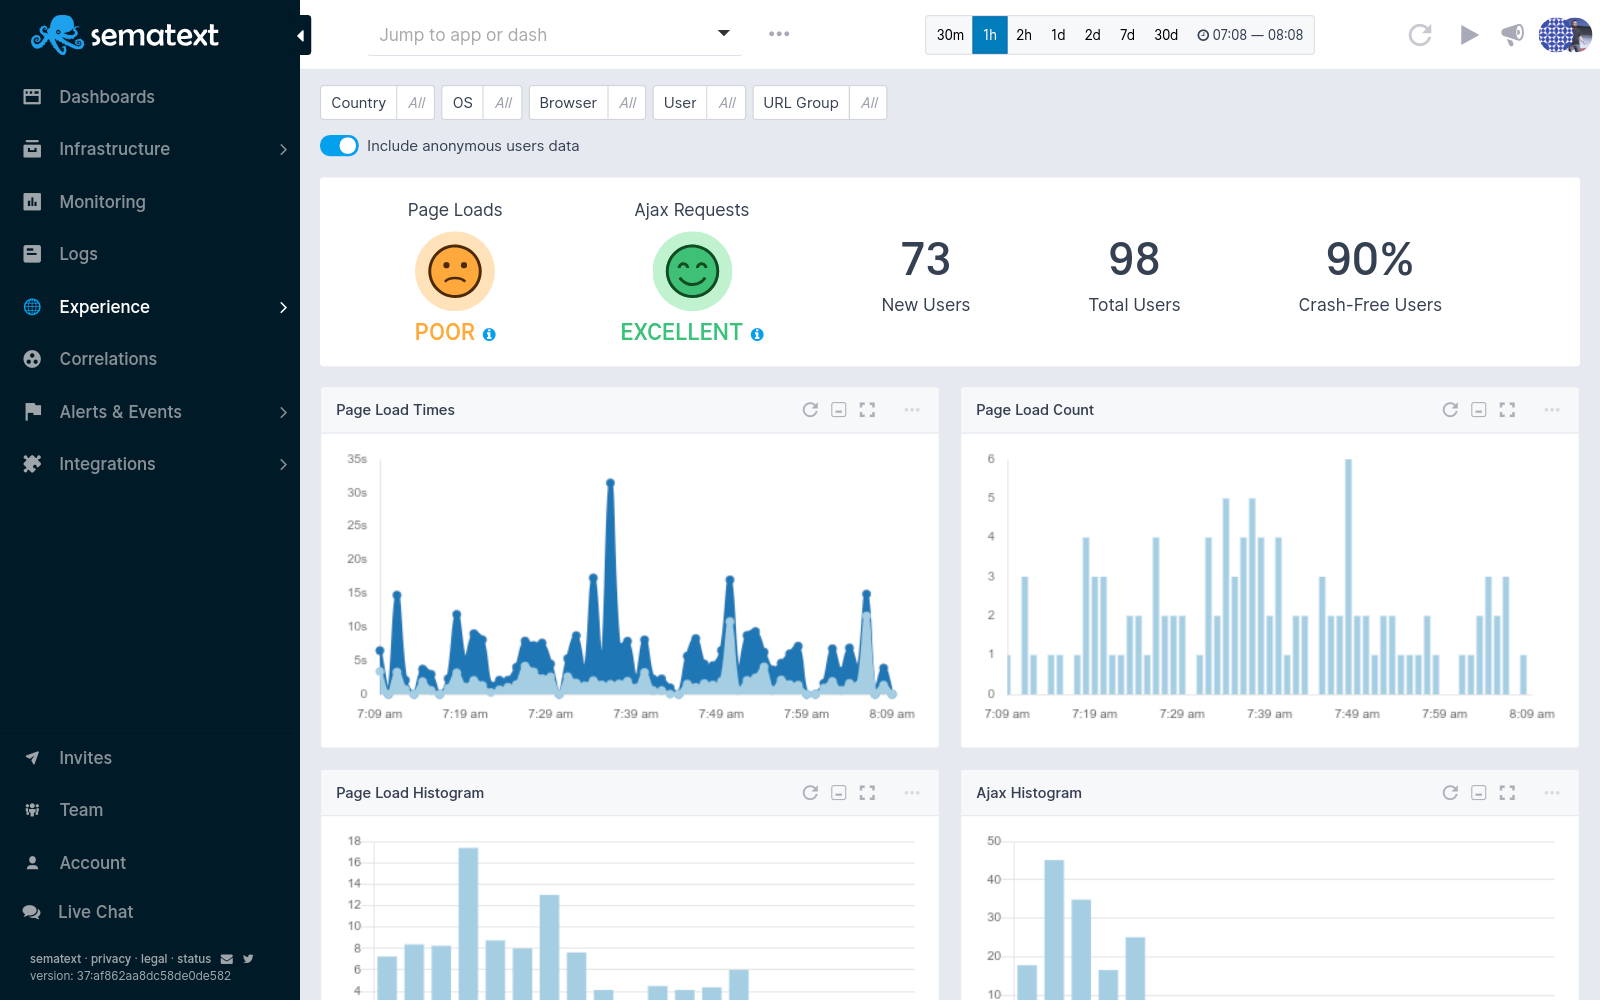
Sematext Experience is a real user monitoring system that provides complete visibility into the sections of your website or webapp that have an impact on your user experience. At the top of its dashboard, it has a very quick status recognition feature. This is represented by two smiley face icons that reflect the speed with which a site loads pages and responds to Ajax queries.
The dashboard is well-designed, with rapid results on the number of site visitors and recent performance graphed. Data can be displayed based on the user's country, operating system, browser type, page, or page group. At the touch of a button, the time segmentation can also be changed.
The same dashboard screen can be used for live data tracking and historical analysis due to these data customization features. Users can also see log and event data as a list of records or have those data sources evaluated in graphs.
Through its alerting mechanism, Sematext provides excellent support to busy website administrators. Administrators don't have to keep track of statuses because they'll be alerted if something goes wrong. All of the performance thresholds that set off alerts can be changed.
Features:
- Performance ranking with smiley face icons
- Live performance tracking
- Historical analysis tool
- Robust alerting
Pricing:
Sematext Experience is a monthly subscription service with pricing based on 100,000 page views.
#5 AppDynamics
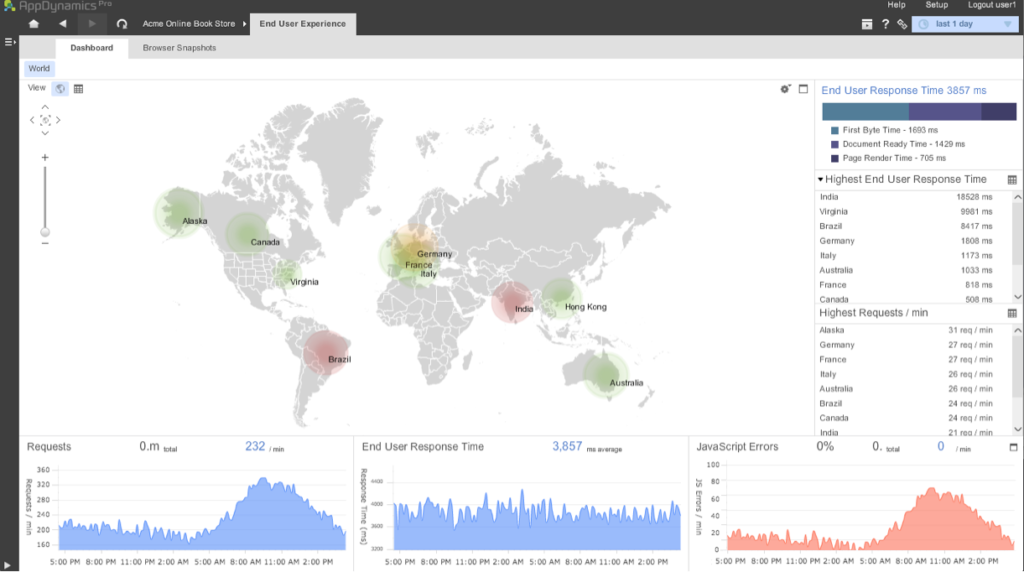
AppDynamics End User Monitoring captures system events throughout each user session and aggregates them into overall system performance metrics. All standard user experience metrics are captured, such as load times and error rates. Along with those standards, code-level transactions are logged, allowing website designers to understand which stages impede a website's display and service delivery.
A web developer can use the AppDynamics system to see which third-party applications are slowing down a website's performance. None of a website's performance issues may be caused by the website itself, but instead are the result of a slow-to-deliver API. In this scenario, the website designer has the choice of eliminating the library and replacing it with another or omitting the function entirely.
Each event can be analyzed from beginning to end, tracking a user's trip through the website, or on a drill-down basis, looking at each triggered event and then uncovering the services that make it possible, right down to the hardware. A website designer can detect the main cause of load issues or delayed response times by switching between these two displays.
Features:
- Displays Web page element performance
- Identifies slow third-party APIs
- Aggregates usage statistics
- Excellent dependency mapping and visualizations
Pricing:
AppDynamics End User Monitoring comes in two plans: Real User Monitoring Pro and Real User Monitoring Peak. Both are subscription services, with the Peak plan offering greater customization and analysis options.
#6 Dynatrace
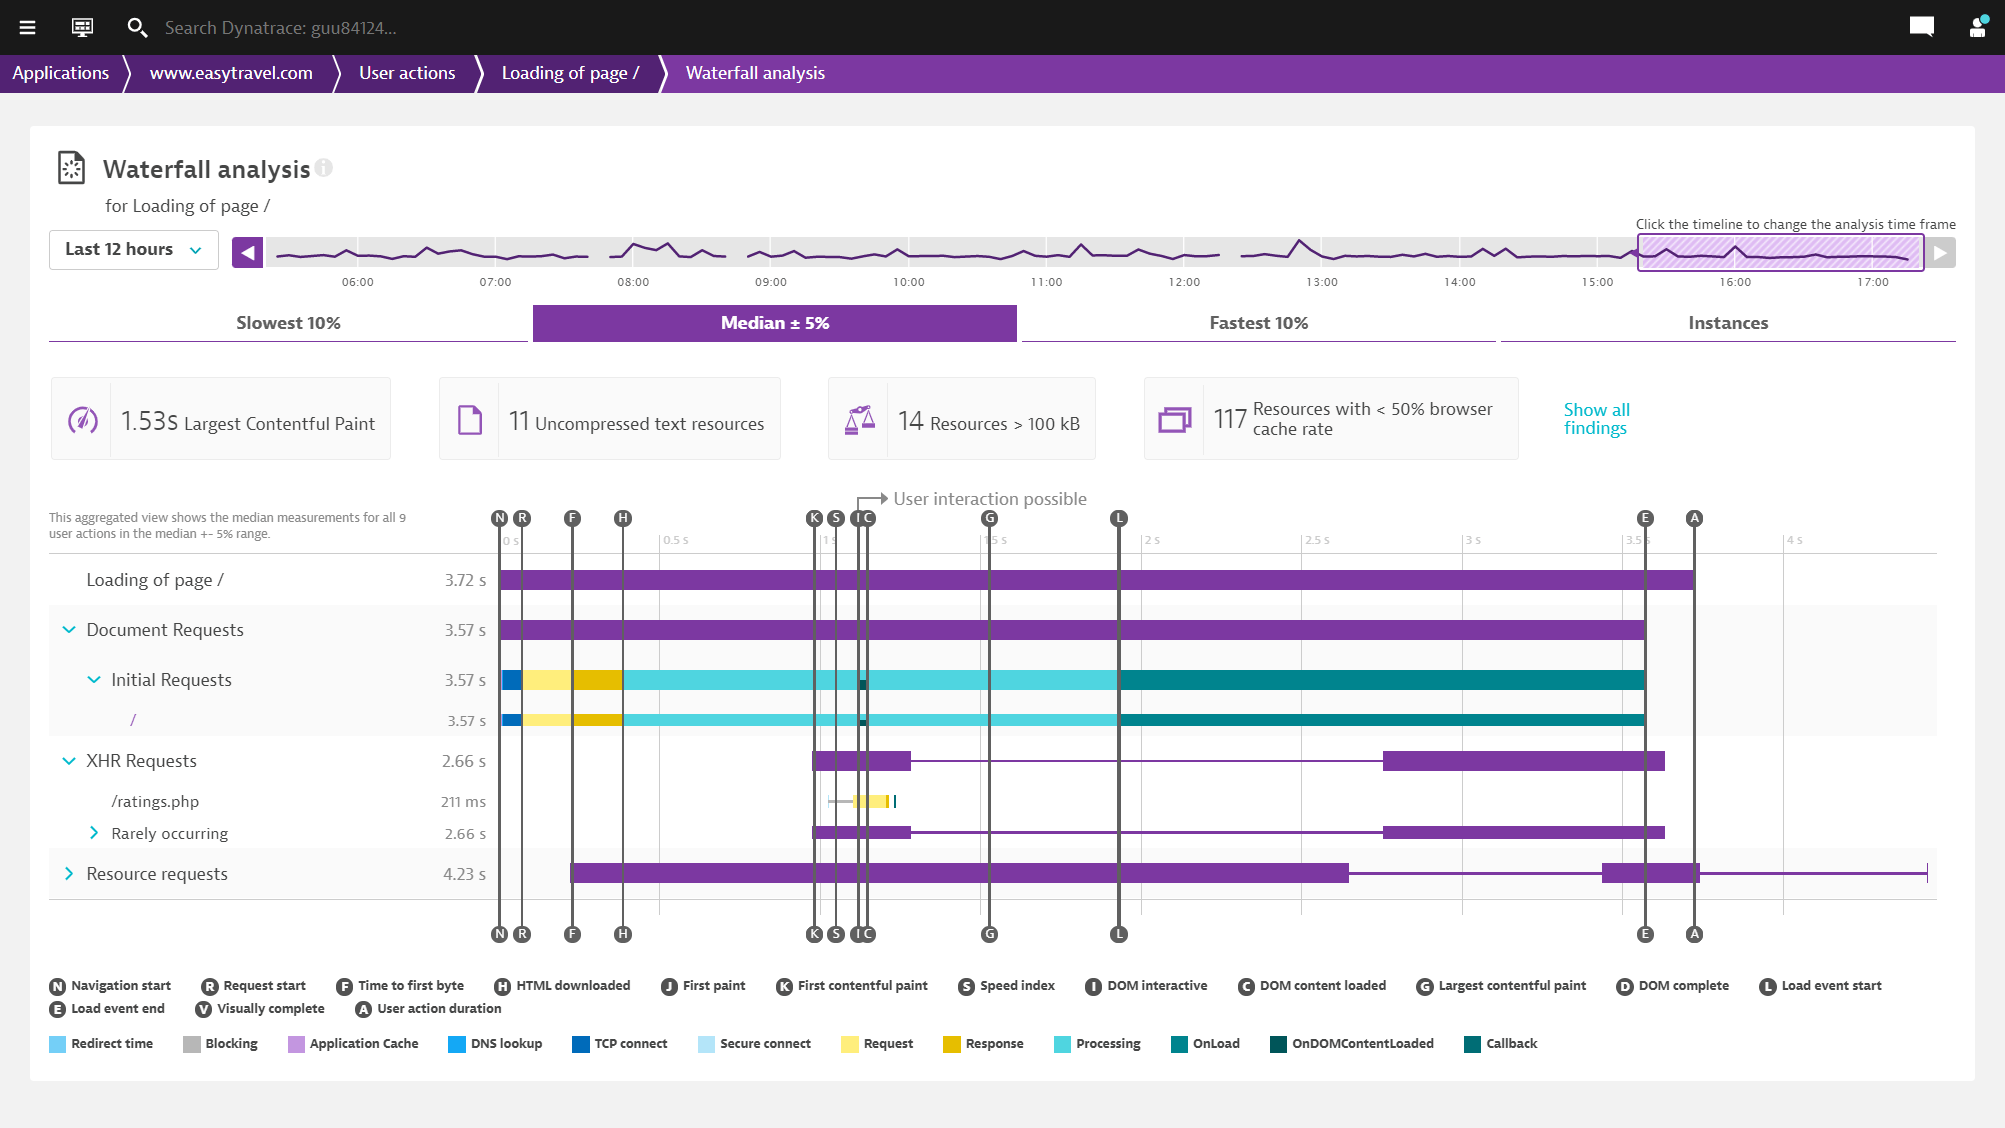
Dynatrace RUM is a powerful website monitoring service that provides complete visibility into the customer experience in real-time. To measure and improve user satisfaction, you can track the behavior of all mobile and web application users across all devices and browsers.
You can also collect business-relevant metrics with Dynatrace RUM, allowing you to link performance concerns to potential business effects.
The Dynatrace Digital Experience Monitoring service includes synthetic modeling and real user monitoring, as well as a session replay feature. After buying a block of credits, the customer must choose which service to utilize.
Dynatrace's Real User Monitoring features provide both a detailed run-through of an individual user's actions on a website and aggregated data that identifies the performance of each website element. The Dynatrace service's session recording feature is unique. After a session has finished, it allows a technician to watch the screen as if it were a remote desktop view of a user's live actions.
A technician can pinpoint which behaviors resulted in errors using both historical data and session run-throughs. These features can also help marketing analysts figure out which services generate the most user activity.
Features:
- Highly visual and customizable dashboards
- Records user journeys
- Aggregates activity statistics
- Displays performance metrics
Pricing:
Available on request.
#7 Raygun
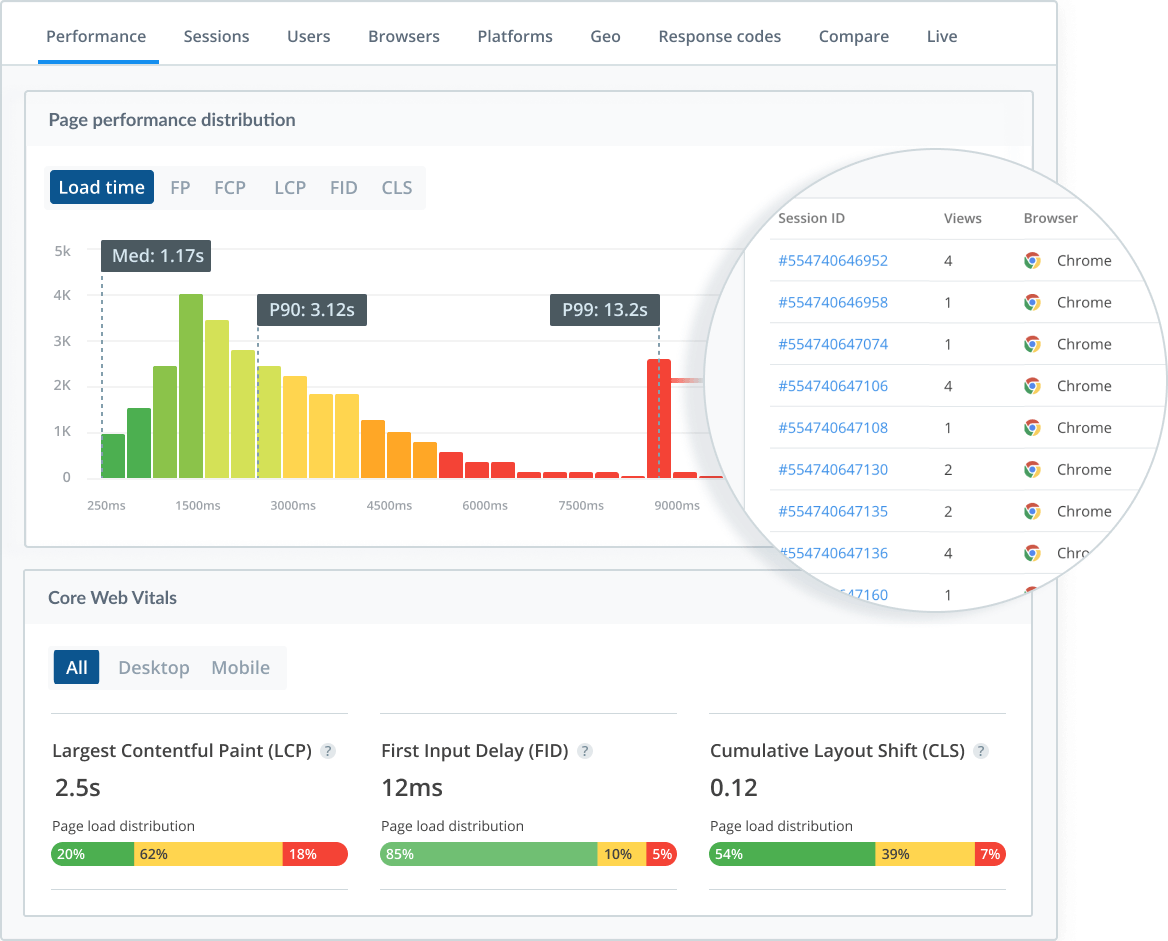
You can monitor how visitors interact with your applications using Raygun's RUM tool, as well as discover, diagnose, and resolve performance issues they experience. Raygun analyses real-time data from each user session to recommend the most "profitable" improvements to make to ensure a seamless web experience.
Raygun gives you a comprehensive picture of who is using your application and what problems they are having. It allows you to view each user's session, highlighting issue areas and potential remedies. The tool also automatically finds front-end performance issues that may be causing long load times.
You can examine where users experienced errors, where pages were too long to load, or where they simply abandoned the session by retracing the steps they traveled to navigate your website.
The detailed reports enable you to review individual customer sessions in advance, retrace their trip on your website or application, and observe and rectify the specific performance issues they encountered.
The reports include a detailed breakdown of load times, latency, and other factors across browsers, servers, DNS, and other factors. It lets you compare and filter data based on devices, browsers, and geographic location.
Features:
- Performance tracking
- Crash reporting support for all major languages
- Customer experience monitoring
Pricing:
Users can choose to be invoiced monthly or annually for $8/10,000 sessions each month.
Finally!!!
Real user monitoring is the most effective technique to learn about how users interact with your website and web application. It provides data that enables you to understand how your application is performing and alerts you to performance issues so that you can address them quickly before they have a negative impact on the user experience. All of these tools can assist your company in becoming proactive rather than reactive.
Monitor Your Entire Application with Atatus
Atatus Observability Platform lets you review problems as if they happened in your application. Instead of guessing why errors happen or asking users for screenshots and log dumps, Atatus lets you replay the session to quickly understand what went wrong.
We offer Application Performance Monitoring, Real User Monitoring, Serverless Monitoring, Logs Monitoring, Synthetic Monitoring, Uptime Monitoring, and API Analytics. It works perfectly with any application, regardless of framework, and has plugins.

Atatus can be beneficial to your business, which provides a comprehensive view of your application, including how it works, where performance bottlenecks exist, which users are most impacted, and which errors break your code for your frontend, backend, and infrastructure.
If you are not yet an Atatus customer, you can sign up for a 14-day free trial.
#1 Solution for Logs, Traces & Metrics
![]() APM
APM
![]() Kubernetes
Kubernetes
![]() Logs
Logs
![]() Synthetics
Synthetics
![]() RUM
RUM
![]() Serverless
Serverless
![]() Security
Security
![]() More
More