A Guide To PHP Performance Monitoring
Performance is not something you should compromise on, and it's important to have a healthy development process that improves as your application grows. If your PHP application is not super-fast, it will be much harder to scale and maintain. You need to identify errors in the early stage to fix them as soon as possible. And if you don’t know where your bottlenecks are, you can’t fix them.
The PHP development process is long and arduous—not only does it take a lot of time to write, test, and release a new feature, but to run a site you'll have to perform a number of tasks, including load testing, optimizing code for performance, and setting up a user experience for your site. Monitoring these tasks can be difficult and without a means of performance monitoring in place, it might be a bit hard to perform the tasks correctly.
#1 Need of PHP Monitoring
An Application Performance Monitoring helps you in determining how fast applications are running which gives you an overview of your application's performance as a whole. It helps in identifying the regions of the code where an error occurs, thus allowing fine-tuning of application behavior for optimal runtime speed and resource usage.
As a developer, our job is to ensure that our application runs as expected. The average time spent by an end-user in a web application is 15 seconds. And this is the perfect moment for capturing someone's attention on your website. To improve the performance of your app you should monitor it seamlessly without any interruption.
Here comes the Performance Monitoring Tools that helps you in measuring the performance-related issues which might impact your end-users.
PHP is efficient and versatile, which provides enormous configurations and options. Since it offers too many configurations, if you select the wrong settings or a minor bug in your code may cause rigorous scalability and performance problems.
Performance and speed are the most crucial factors in any web application or website. It's often not easy to strike the right balance between speed, accuracy, and scalability when attempting to achieve optimal performance.
To identify the issues in your PHP application, we have APM tools in our market. Using APM tools, you can easily detect all the performance bottlenecks at a single place through which you can resolve the issues at a faster rate. Evaluate the end-users experience in your application with the insights provided by APM tools.
Common Root Cause of Errors Made While Developing PHP Application
The most common mistakes developers do while building a new PHP applications are:
- Creating too many database queries
- Misconfiguring the web server
- Loading too many files
- Sleep method inside a call function
- External API requests
#2 Metrics to be Monitored
Many web applications run slowly and will never perform at their best until they are restarted. A great way to identify problems is to monitor the application's performance using PHP monitoring.
Here are some of the KPI metrics that should be considered before monitoring an PHP application.
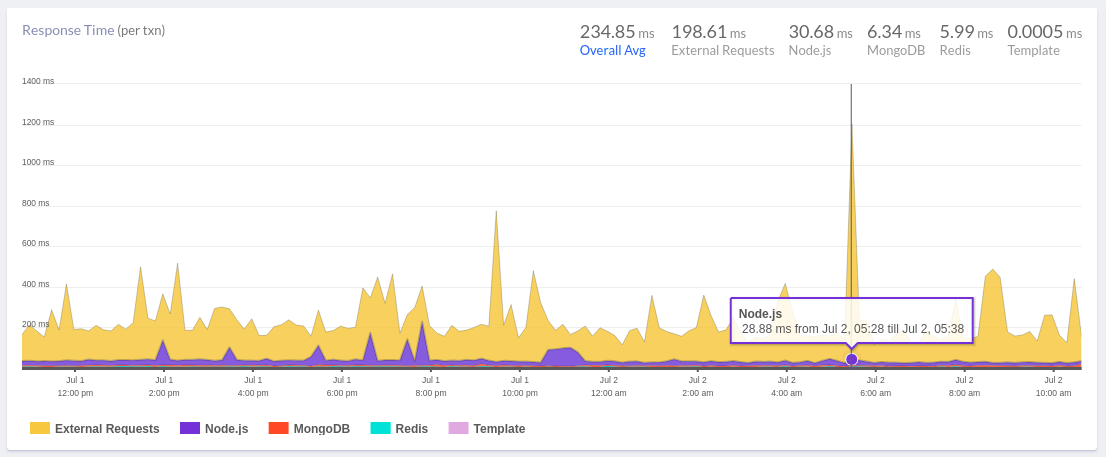
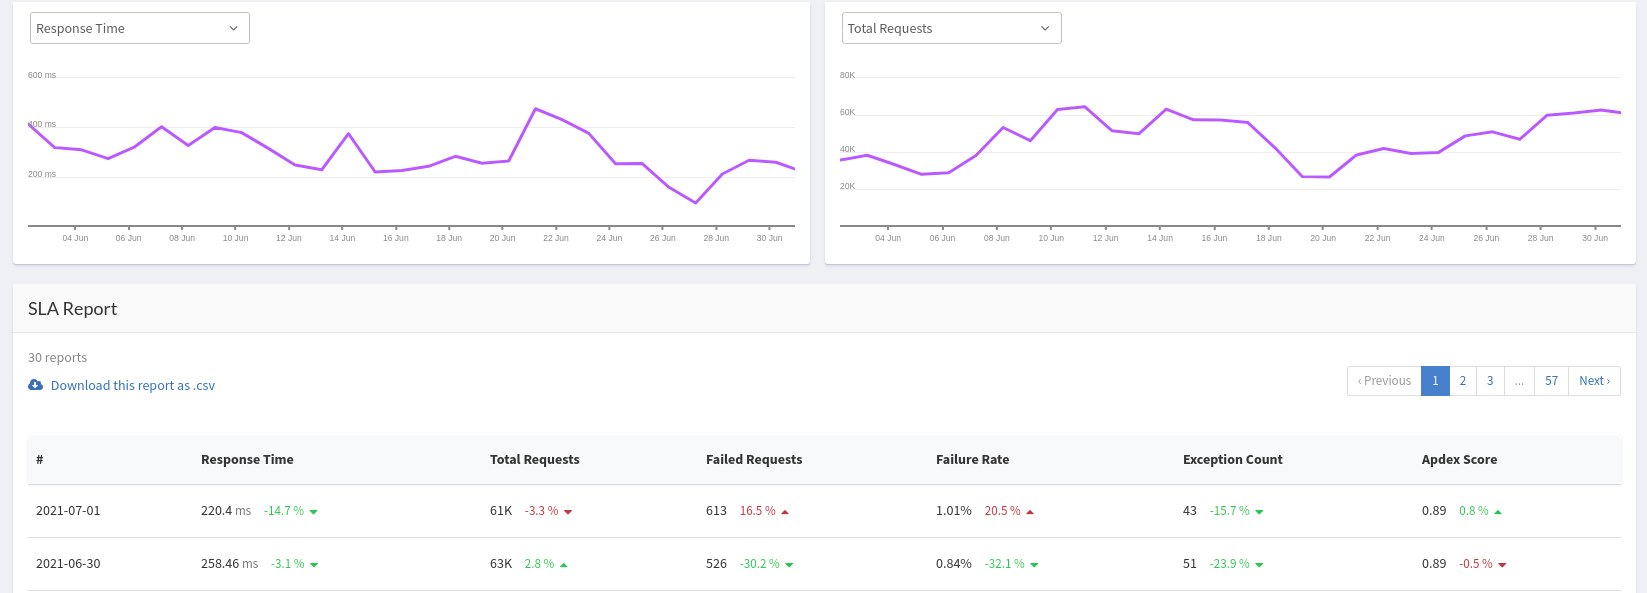
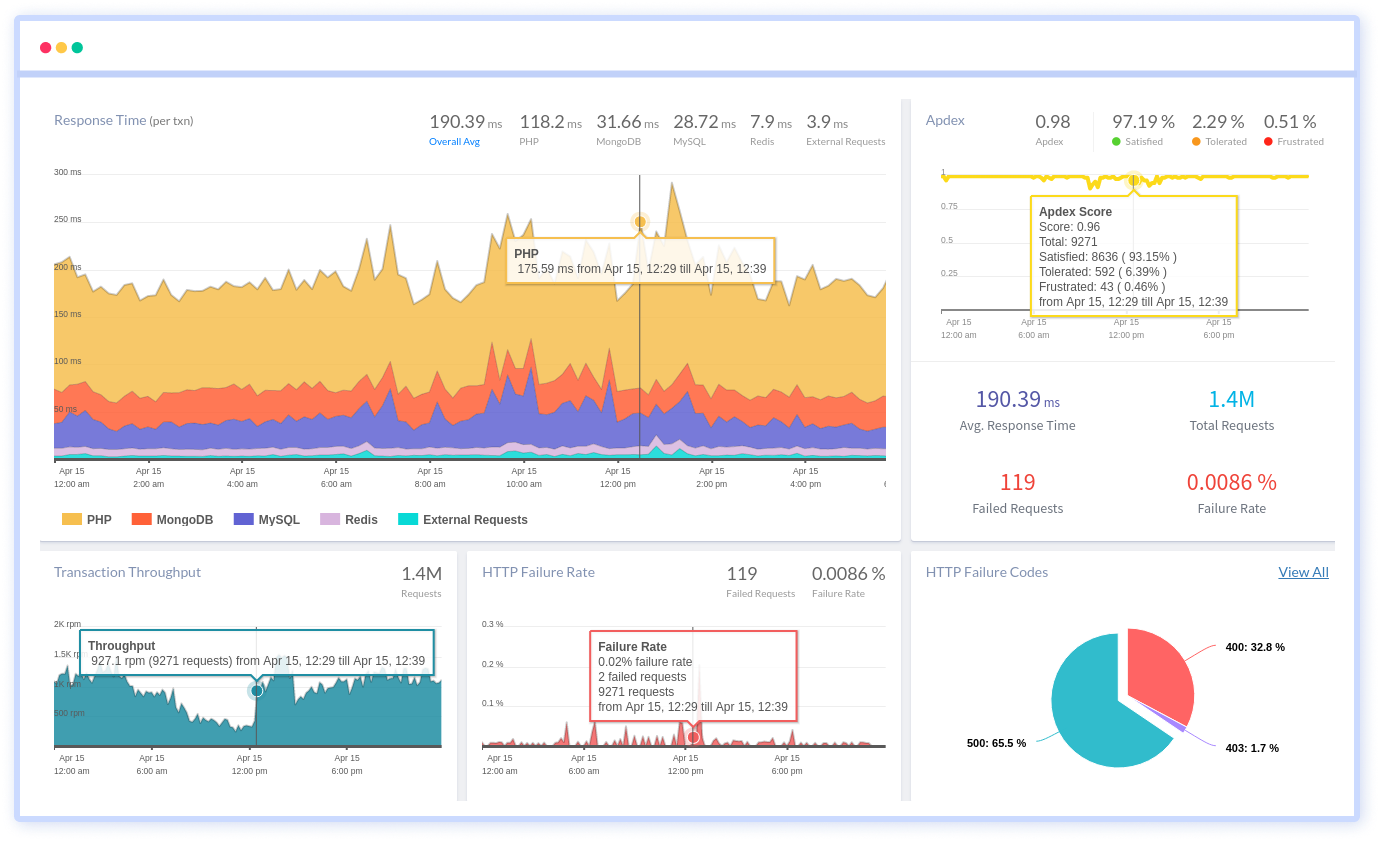
a.) Response Time - Response Time is the duration of how long it takes for a response to return back for a particular request in user perspectives. Capture all the transactions and provide response time for each transaction with an overall average.
b.) Apdex Score - Apdex or Application Performance Index Score has become the standard one for tracking the relative performance of an application. It is used to measure the user satisfaction regarding your PHP application.
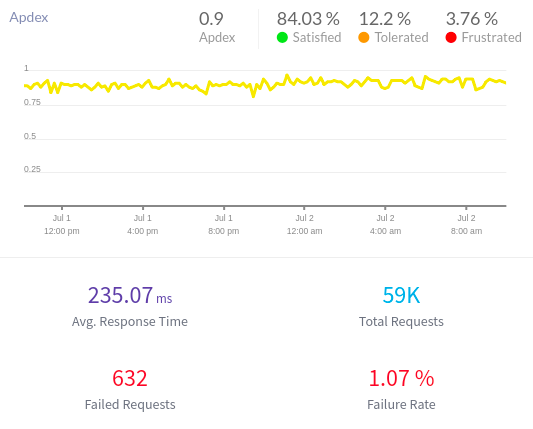
This lets you know how happy your users are using your services. It provides a score from 0 to 1. Based on the score you can easily understand how likely your customers are to use your application.
c.) Exception Rate - Exceptions thrown per second i.e the number of crashes took place in your PHP app.
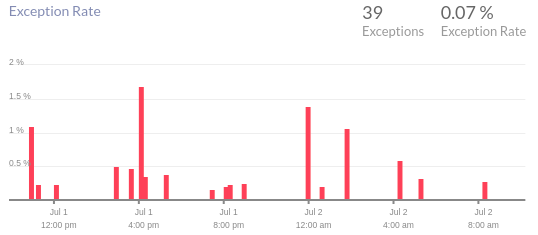
A good practice is to set an alert whenever this kind of exception occurs. Always get notified about the errors that arise in your app to resolve them at a faster rate.
d.) Query Time - This measures the time taken by each query in your db call using which you find out the most time consumed query and optimize them.
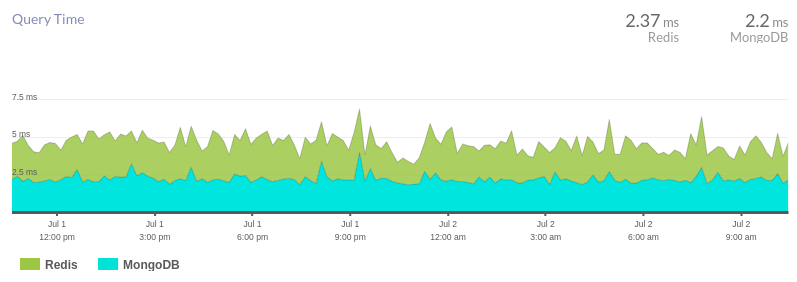
Keep an eye on your critical queries which might impact the performance and availability of your whole application. This is the execution time taken by each query in your app. If the execution time is higher than usual it might cause any issue in your PHP app.
e.) SLA report - It checks the extent to which your application has been operational, functional and usable for all the end-users. This report helps you to understand better by presenting the downtime and uptime of your application over time. The SLA report can be downloaded as a CSV file for further use.
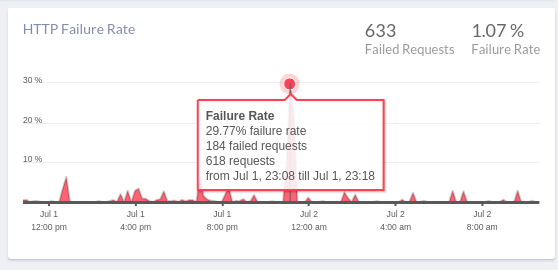
f.) HTTP Failure Rates - It is the total number of HTTP errors occurred in your application.
#3 Best APM tools to use
There are several appropriate monitoring tools available in the market to identify the crashes that occur in your PHP application. Some of the best PHP monitoring tools in the market are:
- Atatus
- New Relic
- Appdynamics
- Datadog
- Site24*7
With the above listed PHP monitoring tools you can monitor and track all the PHP errors and exceptions along with the dashboard they provide you can easily view all the performance-related metrics in real-time. With the insights you can quickly fix the PHP errors, provide end-users the best PHP application in the market place and boost revenue in your organization.
#4 Why should you consider using a PHP APM tool?
A PHP performance monitoring tool helps you in monitoring the entire infrastructure and identifies the critical issues in your application. PHP performance monitoring enables you to get a complete overview of PHP errors along with the complete stack trace where an error occurred, as well as know when and where your PHP application slows down.
It provides a clear picture of all the PHP errors with actionable insights upon which you can easily resolve all the issues.
What makes big enterprises choose PHP APM tools?
- No code changes in your PHP code
- Simple and Feature Rich UI
- Outstanding support (no extra fees for support)
- Affordable pricing
Features
a.) Transaction Monitoring - Transaction Monitoring lets you monitor your key transactions that your app serves and identify the server-side performance bottlenecks by drilling down into each requests.
b.) Database Monitoring - With Database Monitoring identify the most time-consuming and the queries that slow down your PHP app. Get insights like response time, throughput and slow db queries with the original stack trace. Optimize each and every db call that impacts your end-user experience.
c.) Slow Request Traces - Figure out which functions were executed and where you need to spend more time to debug further to make your application run faster with Slow Request Traces.
d.) External Request Monitoring - External Request Monitoring checks out all the third-party API calls that decelerates your app and identifies which external calls affect a particular transaction.
e.) API Failures - Get an overview of all the HTTP failures with API Failures along with the HTTP failure status codes. You can also pass custom data to examine the HTTP failures.
f.) Release Tracking - Track down each deployment to ensure whether the newer version doesn't affect your older version of your app. Our APM tool keeps track of all the intertwined activities involved while deploying an application.
g.) Error Tracking - Error Tracking lets you collect all PHP exceptions with the complete stack trace along with the exact line of the code that impacts your users.
Conclusion
Errors and performance bottlenecks can drive more unsatisfied customers. Make use of an APM tool to reduce the development time and speed delivery of high-quality applications.
Without knowing what's happening in your PHP application you cannot measure the failures in it. Continuously collect data by monitoring them 24*7 with a php monitoring tools and get alerted whenever an error occurs in your app.
While building web applications always remember that what works today might not be working the next upcoming month or year. To maintain the consistency of your PHP app's performance keep monitoring them and measure the bottlenecks as soon as possible.
Here are a few key points to be considered before choosing the best APM tool in the market.
i.) Choose the tool which sends you an alert on issues that occurred in your application with the exact details of the errors.
ii.) Look for the tool that captures the errors at a faster rate.
iii.) Check whether the tool monitors in-depth transactions, end-user experience, infrastructure, logs and complete network performance.
It would be wise to use Atatus because it is a perfect and top-notch PHP performance monitoring tool, with a G2 crowd and Capterra score of 4.5 and 4.8 respectively.
Furthermore, it supports several well-known frameworks, including Laravel, Symfony, Zend, Yii, WordPress and Magento.
Below listed are few key points to consider using Atatus:
- An outstanding 24*7*365 support service.
- Cost-effective pricing(Pay for what you use).
- Code changes in your PHP code are not required while installing Atatus PHP agent.
- Fully integrated alerts.
- An easy-to-use interface with many features.
#1 Solution for Logs, Traces & Metrics
![]() APM
APM
![]() Kubernetes
Kubernetes
![]() Logs
Logs
![]() Synthetics
Synthetics
![]() RUM
RUM
![]() Serverless
Serverless
![]() Security
Security
![]() More
More