API Failures Monitoring
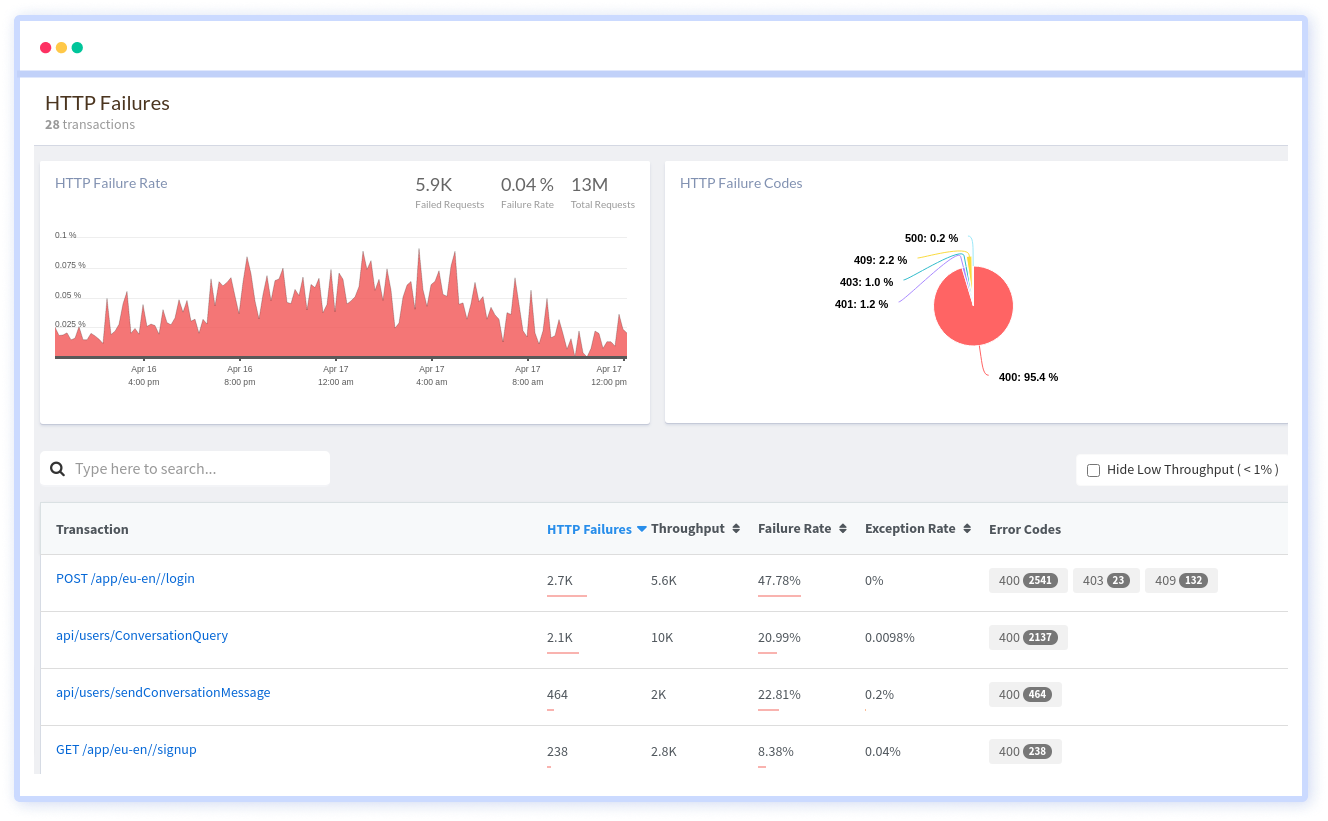
See detailed overview of all the HTTP Failures that happen in your app that impacts your users. Get in-depth details of the request parameters, various HTTP failure codes along with custom data that you can pass to analyze your failures.

Identify and diagnose failing end points faster
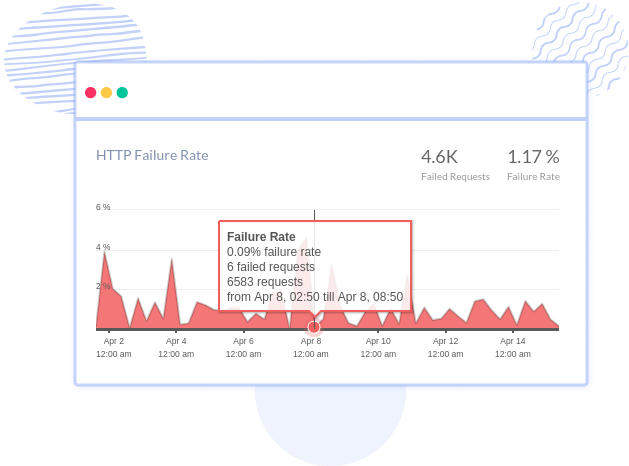
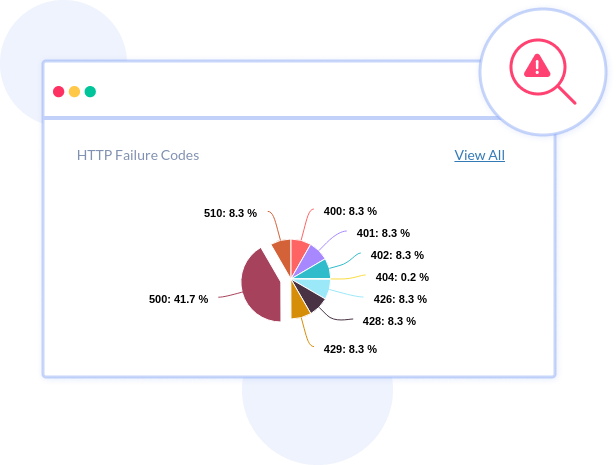
View the visual chart of all the HTTP Failures along with the status code breakdown to see how your app is performing and if you need to start acting upon the impact of these failures that your users have.

See how many 4xx, 5xx codes affect each end point
Get to know the various status codes that each end point receives. Aggregate, search and filter the codes to see how each end point is impacted by these API failures along with related session traces and exceptions.

Drill down into failures to understand the root cause
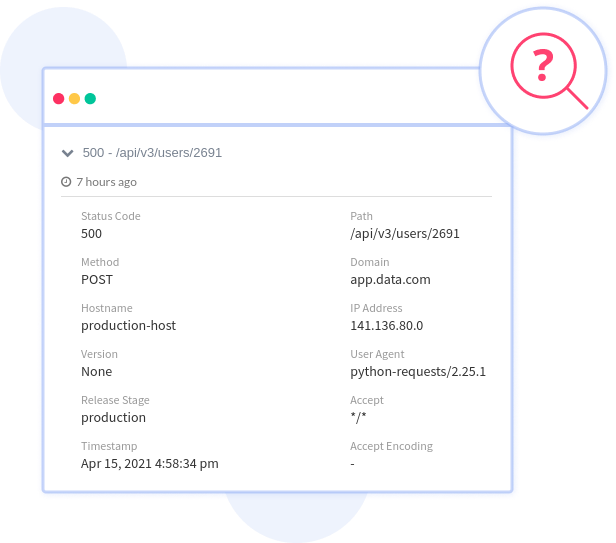
With each failure you get the complete set HTTP headers along with custom data that you pass on with each transaction. Using the detailed information such as request parameters, user agent, and more you can root cause the issues faster.


 +1-760-465-2330


