External Request Performance
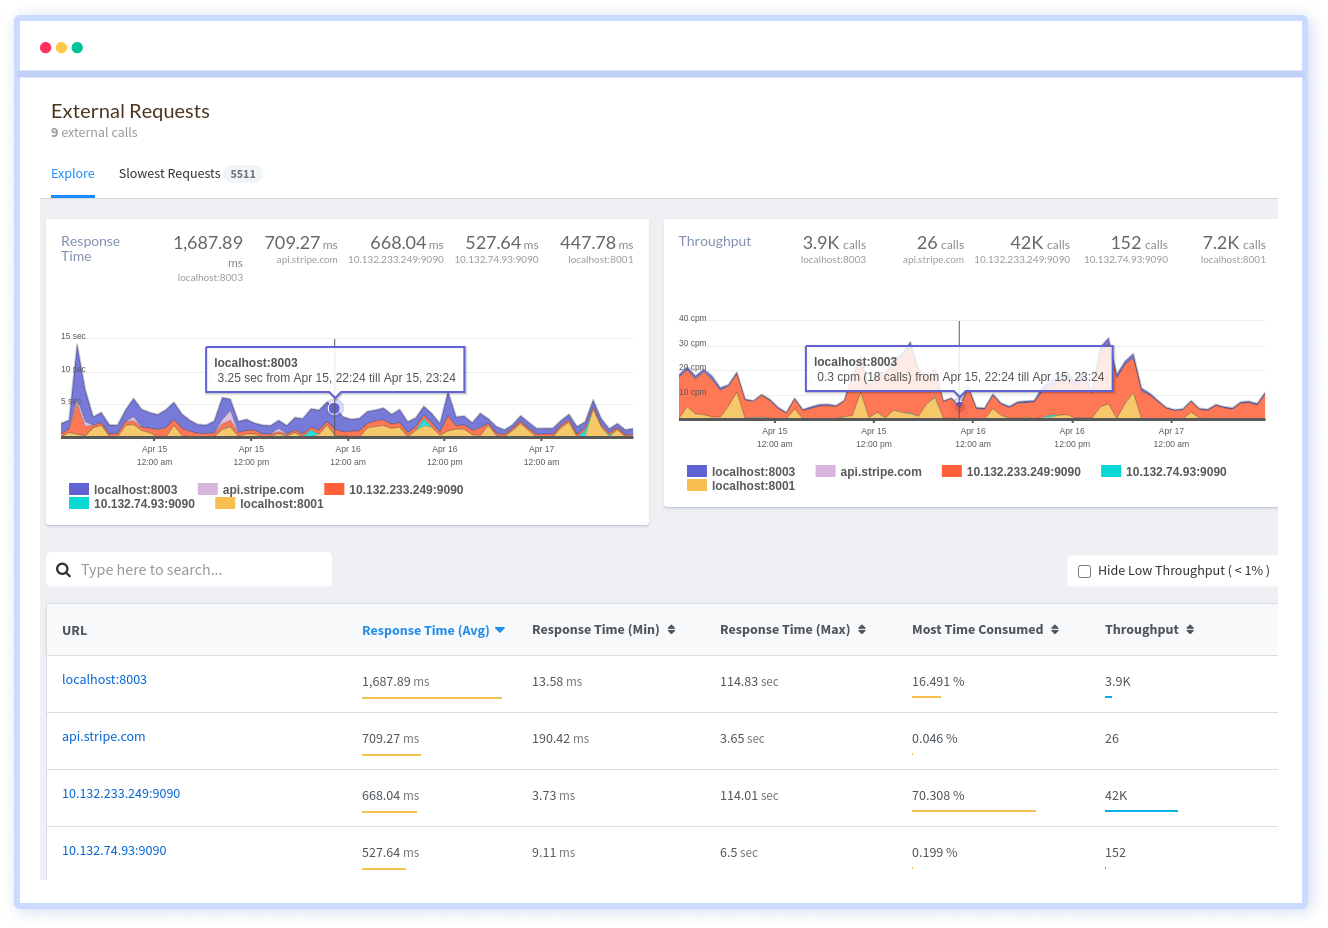
Get a comprehensive overview of all the out-of-process network calls that your app makes to third party apps, microservices, and other network services by surfacing slow calls occurring within your requests along with transaction traces to provide actionable insights.

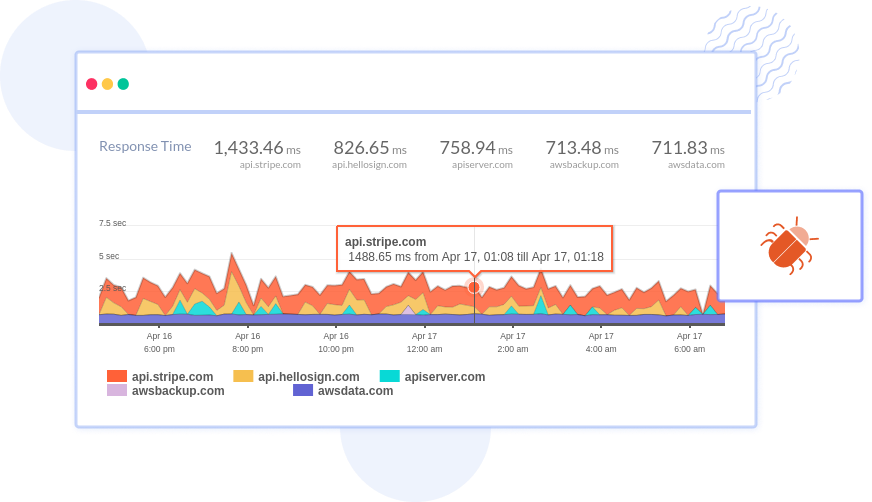
See how much you wait on response from external calls
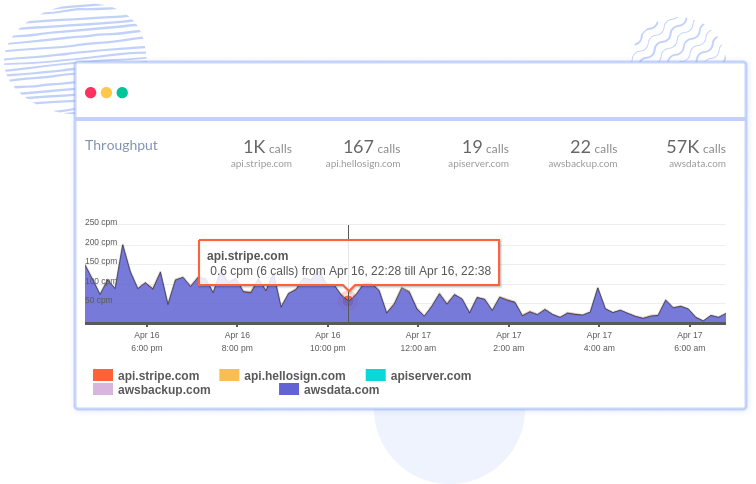
In-depth overview of each network domain performance to your app and how it impacts your transaction performance. Within each domain endpoint, get aggregated metrics for response times, throughput and slow external calls with the original traces.

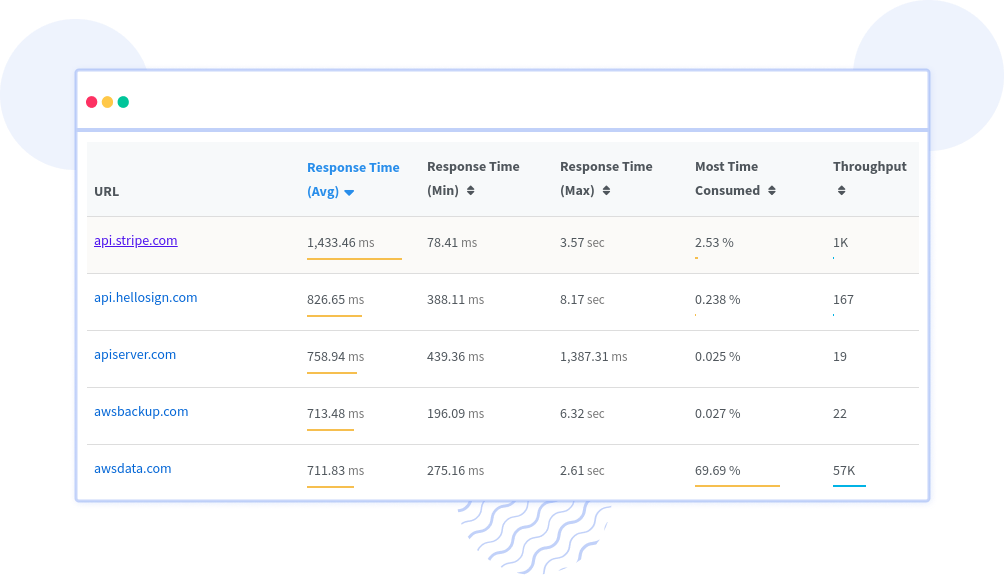
Identify external requests that are slowing down your application
Drill down into the list of all slow network calls with URLs to understand which domains have the most impact, know exactly where it originated and measure in a long term if your changes to the service improve performance.

Find which external calls affect a particular transaction
Get down into an individual URL to understand which end points make calls to a particular domain, along with specific details of the total time consumed, response time, throughput, slowest external requests.


 +1-760-465-2330


